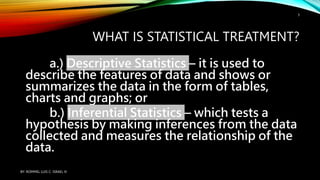
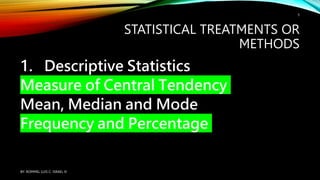
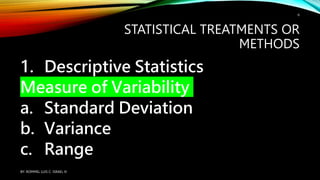
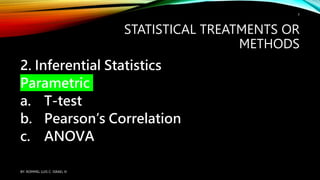
STATISTICAL TREATMENT
OF DATA
BY: ROMMEL LUIS C. ISRAEL III
1
WHAT IS STATISTICAL
TREATMENT?
Statistical Treatment is when you
apply a statistical method to a
data set to draw meaning from
it. Moreover, it can be either:
BY: ROMMEL LUIS C. ISRAEL III
2
WHAT IS STATISTICAL TREATMENT?
a.) Descriptive Statistics – it is used to
describe the features of data and shows or
summarizes the data in the form of tables,
charts and graphs; or
b.) Inferential Statistics – which tests a
hypothesis by making inferences from the data
collected and measures the relationship of the
data.
BY: ROMMEL LUIS C. ISRAEL III
3
Statistical
treatment of data is
when you apply some
form of statistical
methods set to
transform a raw data
into a meaningful
output.
STATISTICAL
TREATMENT
OF DATA
BY: ROMMEL LUIS C. ISRAEL III
4
STATISTICAL TREATMENTS OR
METHODS
1. Descriptive Statistics
Measure of Central Tendency
Mean, Median and Mode
Frequency and Percentage
BY: ROMMEL LUIS C. ISRAEL III
5
STATISTICAL TREATMENTS OR
METHODS
1. Descriptive Statistics
Measure of Variability
a. Standard Deviation
b. Variance
c. Range
BY: ROMMEL LUIS C. ISRAEL III
6
STATISTICAL TREATMENTS OR
METHODS
2. Inferential Statistics
Parametric
a. T-test
b. Pearson’s Correlation
c. ANOVA
BY: ROMMEL LUIS C. ISRAEL III
7
DESCRIPTIVE STATISTICS
Measure of Central Tendency
It is a single value that attempts
describe a set of data by identifying
the middle or central position within
that set of data.
BY: ROMMEL LUIS C. ISRAEL III
8
DESCRIPTIVE STATISTICS
Measure of Central Tendency
Mean – the arithmetic average of the
distribution
Median – the middle value that separates
the higher value and the lower
value equally.
Mode – most commonly occurring value
in
a distribution.
BY: ROMMEL LUIS C. ISRAEL III
9
DESCRIPTIVE STATISTICS
Measure of Central Tendency
Mean – it is a mathematical
representation of the typical
value of a series of numbers,
computed as the sum of all
numbers in the series divided
by the count of all numbers in the
series.
BY: ROMMEL LUIS C. ISRAEL III
10
DESCRIPTIVE STATISTICS
Measure of Central Tendency
BY: ROMMEL LUIS C. ISRAEL III
11
DESCRIPTIVE STATISTICS
Measure of Central Tendency
Mean: Assumptions that needs to be satisfied:
1. The measurement scale of the variable is at least
interval.
2. The data should be approximately normally
distributed.
3. The data should not contain significant outlier.
BY: ROMMEL LUIS C. ISRAEL III
12
DESCRIPTIVE STATISTICS
Measure of Central Tendency
Mean: It cannot be used for
nominal or ordinal values because
adding the data associated with
these kind of variable does not
sense.
BY: ROMMEL LUIS C. ISRAEL III
13
DESCRIPTIVE STATISTICS
Measure of Central Tendency
Mean:
Example scenarios:
1. describing the daily allowance of your
classmates and you assumed that is normally
distributed.
2. summarizing the grades in all subjects for the first
quarter
BY: ROMMEL LUIS C. ISRAEL III
14
DESCRIPTIVE STATISTICS
Measure of Central Tendency
Median – the middle value that
separates the higher value and the
lower value equally. The median is
less than affected by the outliers.
BY: ROMMEL LUIS C. ISRAEL III
15
DESCRIPTIVE STATISTICS
Measure of Central Tendency
Median
Example scenarios:
1. A researcher would like to summarize the weight of his
respondents, but the data is not normally distributed.
2. A researcher would like to summarize the monthly salary
of his employees, but he found out that it contains
significant outliers.
BY: ROMMEL LUIS C. ISRAEL III
16
DESCRIPTIVE STATISTICS
Measure of Central Tendency
Mode – most commonly
occurring value in a
distribution.
BY: ROMMEL LUIS C. ISRAEL III
17
DESCRIPTIVE STATISTICS
BY: ROMMEL LUIS C. ISRAEL III
18
DESCRIPTIVE STATISTICS
FREQUENCY AND PERCENTAGE DISTRIBUTION
Example:
A researcher would like to know:
a. what religion his respondents belong to;
b. demographic profile of his respondents
(age, race, ethnicity, gender, income,
education, employment;
c. whether people agree or disagree with
the Divorce Bill.
BY: ROMMEL LUIS C. ISRAEL III
19

DESCRIPTIVE STATISTICS - STATISTICAL TREATMENT OF DATA

  • 1.
    STATISTICAL TREATMENT OF DATA BY:ROMMEL LUIS C. ISRAEL III BY: ROMMEL LUIS C. ISRAEL III 1
  • 2.
    WHAT IS STATISTICAL TREATMENT? StatisticalTreatment is when you apply a statistical method to a data set to draw meaning from it. Moreover, it can be either: BY: ROMMEL LUIS C. ISRAEL III 2
  • 3.
    WHAT IS STATISTICALTREATMENT? a.) Descriptive Statistics – it is used to describe the features of data and shows or summarizes the data in the form of tables, charts and graphs; or b.) Inferential Statistics – which tests a hypothesis by making inferences from the data collected and measures the relationship of the data. BY: ROMMEL LUIS C. ISRAEL III 3
  • 4.
    Statistical treatment of datais when you apply some form of statistical methods set to transform a raw data into a meaningful output. STATISTICAL TREATMENT OF DATA BY: ROMMEL LUIS C. ISRAEL III 4
  • 5.
    STATISTICAL TREATMENTS OR METHODS 1.Descriptive Statistics Measure of Central Tendency Mean, Median and Mode Frequency and Percentage BY: ROMMEL LUIS C. ISRAEL III 5
  • 6.
    STATISTICAL TREATMENTS OR METHODS 1.Descriptive Statistics Measure of Variability a. Standard Deviation b. Variance c. Range BY: ROMMEL LUIS C. ISRAEL III 6
  • 7.
    STATISTICAL TREATMENTS OR METHODS 2.Inferential Statistics Parametric a. T-test b. Pearson’s Correlation c. ANOVA BY: ROMMEL LUIS C. ISRAEL III 7
  • 8.
    DESCRIPTIVE STATISTICS Measure ofCentral Tendency It is a single value that attempts describe a set of data by identifying the middle or central position within that set of data. BY: ROMMEL LUIS C. ISRAEL III 8
  • 9.
    DESCRIPTIVE STATISTICS Measure ofCentral Tendency Mean – the arithmetic average of the distribution Median – the middle value that separates the higher value and the lower value equally. Mode – most commonly occurring value in a distribution. BY: ROMMEL LUIS C. ISRAEL III 9
  • 10.
    DESCRIPTIVE STATISTICS Measure ofCentral Tendency Mean – it is a mathematical representation of the typical value of a series of numbers, computed as the sum of all numbers in the series divided by the count of all numbers in the series. BY: ROMMEL LUIS C. ISRAEL III 10
  • 11.
    DESCRIPTIVE STATISTICS Measure ofCentral Tendency BY: ROMMEL LUIS C. ISRAEL III 11
  • 12.
    DESCRIPTIVE STATISTICS Measure ofCentral Tendency Mean: Assumptions that needs to be satisfied: 1. The measurement scale of the variable is at least interval. 2. The data should be approximately normally distributed. 3. The data should not contain significant outlier. BY: ROMMEL LUIS C. ISRAEL III 12
  • 13.
    DESCRIPTIVE STATISTICS Measure ofCentral Tendency Mean: It cannot be used for nominal or ordinal values because adding the data associated with these kind of variable does not sense. BY: ROMMEL LUIS C. ISRAEL III 13
  • 14.
    DESCRIPTIVE STATISTICS Measure ofCentral Tendency Mean: Example scenarios: 1. describing the daily allowance of your classmates and you assumed that is normally distributed. 2. summarizing the grades in all subjects for the first quarter BY: ROMMEL LUIS C. ISRAEL III 14
  • 15.
    DESCRIPTIVE STATISTICS Measure ofCentral Tendency Median – the middle value that separates the higher value and the lower value equally. The median is less than affected by the outliers. BY: ROMMEL LUIS C. ISRAEL III 15
  • 16.
    DESCRIPTIVE STATISTICS Measure ofCentral Tendency Median Example scenarios: 1. A researcher would like to summarize the weight of his respondents, but the data is not normally distributed. 2. A researcher would like to summarize the monthly salary of his employees, but he found out that it contains significant outliers. BY: ROMMEL LUIS C. ISRAEL III 16
  • 17.
    DESCRIPTIVE STATISTICS Measure ofCentral Tendency Mode – most commonly occurring value in a distribution. BY: ROMMEL LUIS C. ISRAEL III 17
  • 18.
    DESCRIPTIVE STATISTICS BY: ROMMELLUIS C. ISRAEL III 18
  • 19.
    DESCRIPTIVE STATISTICS FREQUENCY ANDPERCENTAGE DISTRIBUTION Example: A researcher would like to know: a. what religion his respondents belong to; b. demographic profile of his respondents (age, race, ethnicity, gender, income, education, employment; c. whether people agree or disagree with the Divorce Bill. BY: ROMMEL LUIS C. ISRAEL III 19