Understanding Basic
Statistical Concepts
Welcome to the world of basic statistics! This presentation will
guide you through the fundamental concepts, methods, and
applications of statistics, all explained in simple terms. We'll cover
data collection, measures of central tendency, and the
importance of understanding standard deviations. This
introductory journey aims to equip you with the essential tools
for statistical thinking and analysis.
KASHISH 372 DIV E
→ →
What Is Statistics?
Statistics is the science of collecting, organizing,
analyzing, interpreting, and presenting data. It's a
powerful tool used across various fields to make
informed decisions and draw meaningful conclusions.
From healthcare to finance, statistics helps us
understand patterns and trends in the world around
us.
• Applying statistical methods involves critical
thinking and problem-solving.
• Statistical methods help in making objective
judgments and predictions.
• It's used to understand the likelihood of certain
outcomes.
Methods of Statistical Thinking
1 Data Collection
Gathering relevant information from a population or sample. This is the first and most
critical step.
2 Data Organization
Structuring data in a meaningful way, often using tables or databases, to facilitate
analysis.
3 Data Analysis
Applying statistical techniques to extract insights and patterns from the organized data.
4 Interpretation
Making sense of the analyzed data and drawing conclusions based on the findings.
Presenting data visually is key.
Data Collection: Population and Sampling
Population
The entire group of individuals, objects, or events of
interest in a study. Studying the entire population is
often impractical, requiring sampling techniques.
Sampling
Selecting a subset (sample) from the population to
represent the characteristics of the whole group.
Various sampling methods exist, such as random
sampling and stratified sampling.
Measures of Central Tendency: Mean, Median, Mode
Arithmetic Mean
The average of a set of numbers. Sum all values and divide by the number of values.
Median
The middle value in a sorted set of numbers. It's less sensitive to outliers compared to the mean.
Mode
The value that appears most frequently in a set of numbers. Useful for identifying the most common category.
Example: Calculating Central Tendency
Consider the dataset: 5, 7, 8, 8, 9, 10, 12.
• Mean: (5 + 7 + 8 + 8 + 9 + 10 + 12) / 7 = 8.43
• Median: 8 (the middle value)
• Mode: 8 (appears twice, more than any other value)
These measures provide a sense of the "center" of the
data. The choice of which measure to use depends on
the data's distribution and the presence of outliers.
Standard Deviation and Variance
Standard Deviation measures the spread or
dispersion of data points around the mean. A lower
standard deviation indicates that data points are
closer to the mean, while a higher value indicates
greater variability.
Variance is the square of the standard deviation,
providing another measure of data dispersion. It's
useful in statistical tests and analyses.
Key Takeaways and Next Steps
Statistics is a powerful
tool
For understanding data and
making informed decisions.
Central tendency
measures
Provide insights into the center
of a dataset.
Standard deviation and
variance
Quantify the spread or variability
within data.
Continue exploring statistical concepts to build a strong foundation. Practice applying these methods to real-world datasets
for a deeper understanding. Understanding these terms is a key step to understanding statistics.

Understanding-Basic-Statistical-Concepts (1).pptx.pptx

  • 1.
    Understanding Basic Statistical Concepts Welcometo the world of basic statistics! This presentation will guide you through the fundamental concepts, methods, and applications of statistics, all explained in simple terms. We'll cover data collection, measures of central tendency, and the importance of understanding standard deviations. This introductory journey aims to equip you with the essential tools for statistical thinking and analysis. KASHISH 372 DIV E → →
  • 2.
    What Is Statistics? Statisticsis the science of collecting, organizing, analyzing, interpreting, and presenting data. It's a powerful tool used across various fields to make informed decisions and draw meaningful conclusions. From healthcare to finance, statistics helps us understand patterns and trends in the world around us. • Applying statistical methods involves critical thinking and problem-solving. • Statistical methods help in making objective judgments and predictions. • It's used to understand the likelihood of certain outcomes.
  • 3.
    Methods of StatisticalThinking 1 Data Collection Gathering relevant information from a population or sample. This is the first and most critical step. 2 Data Organization Structuring data in a meaningful way, often using tables or databases, to facilitate analysis. 3 Data Analysis Applying statistical techniques to extract insights and patterns from the organized data. 4 Interpretation Making sense of the analyzed data and drawing conclusions based on the findings. Presenting data visually is key.
  • 4.
    Data Collection: Populationand Sampling Population The entire group of individuals, objects, or events of interest in a study. Studying the entire population is often impractical, requiring sampling techniques. Sampling Selecting a subset (sample) from the population to represent the characteristics of the whole group. Various sampling methods exist, such as random sampling and stratified sampling.
  • 5.
    Measures of CentralTendency: Mean, Median, Mode Arithmetic Mean The average of a set of numbers. Sum all values and divide by the number of values. Median The middle value in a sorted set of numbers. It's less sensitive to outliers compared to the mean. Mode The value that appears most frequently in a set of numbers. Useful for identifying the most common category.
  • 6.
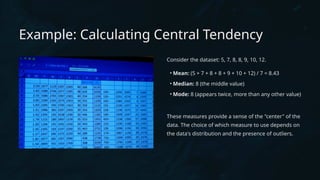
    Example: Calculating CentralTendency Consider the dataset: 5, 7, 8, 8, 9, 10, 12. • Mean: (5 + 7 + 8 + 8 + 9 + 10 + 12) / 7 = 8.43 • Median: 8 (the middle value) • Mode: 8 (appears twice, more than any other value) These measures provide a sense of the "center" of the data. The choice of which measure to use depends on the data's distribution and the presence of outliers.
  • 7.
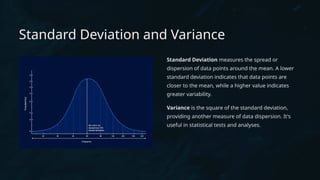
    Standard Deviation andVariance Standard Deviation measures the spread or dispersion of data points around the mean. A lower standard deviation indicates that data points are closer to the mean, while a higher value indicates greater variability. Variance is the square of the standard deviation, providing another measure of data dispersion. It's useful in statistical tests and analyses.
  • 8.
    Key Takeaways andNext Steps Statistics is a powerful tool For understanding data and making informed decisions. Central tendency measures Provide insights into the center of a dataset. Standard deviation and variance Quantify the spread or variability within data. Continue exploring statistical concepts to build a strong foundation. Practice applying these methods to real-world datasets for a deeper understanding. Understanding these terms is a key step to understanding statistics.

Editor's Notes