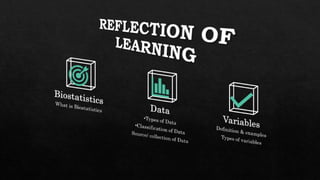
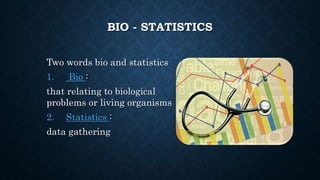
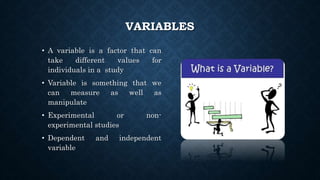
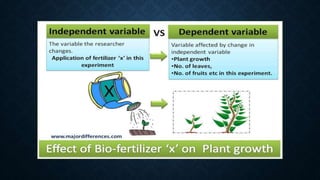
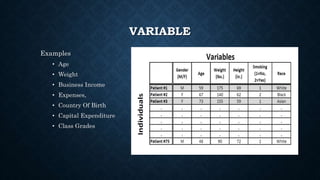
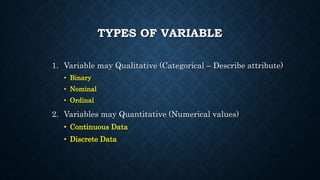
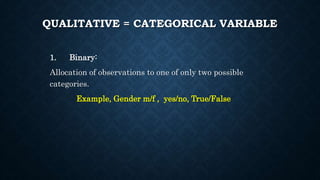
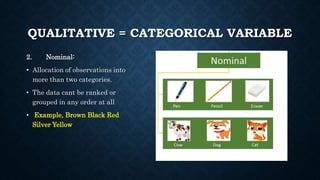
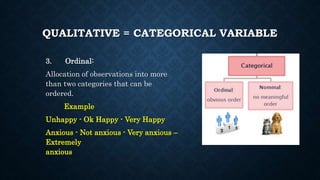
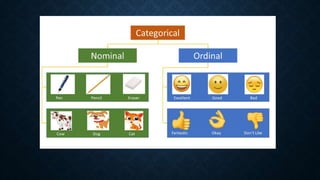
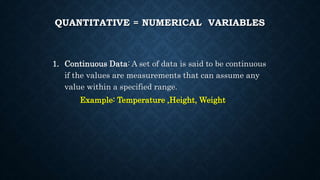
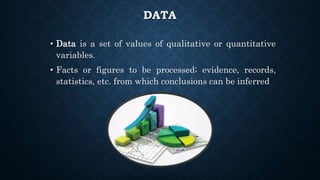
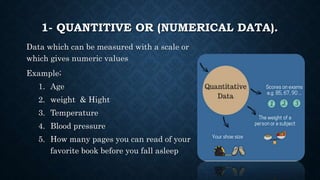
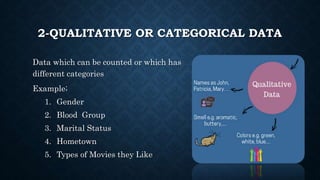
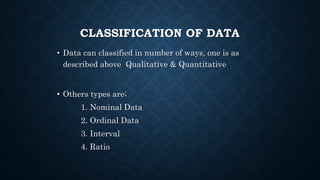
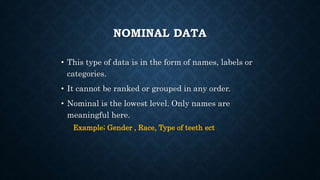
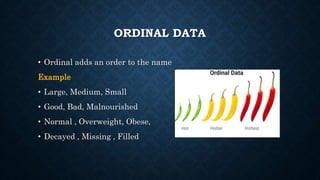
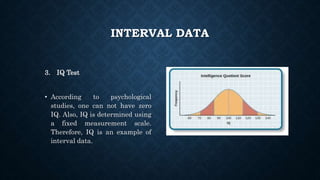
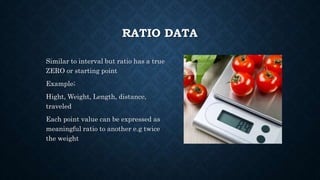
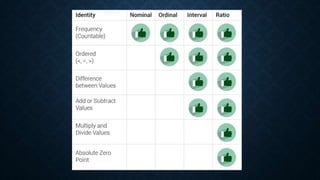
BIOSTATISTICS
MODULE-10
Dr Qurat-Ul-Ain
Assistant Professor / HoD
Community Dentistry Department
HBS Medical & Dental College
BIO - STATISTICS
Two words bio and statistics
1. Bio :
that relating to biological
problems or living organisms
2. Statistics :
data gathering
BIOSTATISTICS
• DEFINITION
Statistical processes and methods applied to the
collection, analysis, and interpretation of
biological data and especially data relating to
human biology, health, and medicine
VARIABLES
• A variable is a factor that can
take different values for
individuals in a study
• Variable is something that we
can measure as well as
manipulate
• Experimental or non-
experimental studies
• Dependent and independent
variable
VARIABLE
Examples
• Age
• Weight
• Business Income
• Expenses,
• Country Of Birth
• Capital Expenditure
• Class Grades
TYPES OF VARIABLE
1. Variable may Qualitative (Categorical – Describe attribute)
• Binary
• Nominal
• Ordinal
2. Variables may Quantitative (Numerical values)
• Continuous Data
• Discrete Data
QUALITATIVE = CATEGORICAL VARIABLE
1. Binary:
Allocation of observations to one of only two possible
categories.
Example, Gender m/f , yes/no, True/False
QUALITATIVE = CATEGORICAL VARIABLE
2. Nominal:
• Allocation of observations into
more than two categories.
• The data cant be ranked or
grouped in any order at all
• Example, Brown Black Red
Silver Yellow
QUALITATIVE = CATEGORICAL VARIABLE
3. Ordinal:
Allocation of observations into more
than two categories that can be
ordered.
Example
Unhappy - Ok Happy - Very Happy
Anxious - Not anxious - Very anxious –
Extremely
anxious
QUANTITATIVE = NUMERICAL VARIABLES
1. Continuous Data: A set of data is said to be continuous
if the values are measurements that can assume any
value within a specified range.
Example: Temperature ,Height, Weight
QUALITATIVE = CATEGORICAL VARIABLE
2. Discrete Data: A set of data is said to be discrete if the
values are distinct and separate. That is, they can be
counted (1,2,3, ...).
Example : Number of new TB cases in a month /
Number of patients in a clinic
DATA
• Data is a set of values of qualitative or quantitative
variables.
• Facts or figures to be processed; evidence, records,
statistics, etc. from which conclusions can be inferred
1- QUANTITIVE OR (NUMERICAL DATA).
Data which can be measured with a scale or
which gives numeric values
Example;
1. Age
2. weight & Hight
3. Temperature
4. Blood pressure
5. How many pages you can read of your
favorite book before you fall asleep
2-QUALITATIVE OR CATEGORICAL DATA
Data which can be counted or which has
different categories
Example;
1. Gender
2. Blood Group
3. Marital Status
4. Hometown
5. Types of Movies they Like
CLASSIFICATION OF DATA
• Data can classified in number of ways, one is as
described above Qualitative & Quantitative
• Others types are;
1. Nominal Data
2. Ordinal Data
3. Interval
4. Ratio
NOMINAL DATA
• This type of data is in the form of names, labels or
categories.
• It cannot be ranked or grouped in any order.
• Nominal is the lowest level. Only names are
meaningful here.
Example; Gender , Race, Type of teeth ect
ORDINAL DATA
• Ordinal adds an order to the name
Example
• Large, Medium, Small
• Good, Bad, Malnourished
• Normal , Overweight, Obese,
• Decayed , Missing , Filled
INTERVAL DATA
• Interval data is a type of data which is measured
along a scale, in which each point is placed at an
equal distance (interval) from one another.
• Examples;
1. Temperature
2. Time
3. IQ
INTERVAL DATA
1. Temperature
An example of interval data is the
data collected on a thermometer—
its gradation or markings are
equidistant.
INTERVAL DATA
2. Time
• Time passes as a good example of interval
data if measured during the day or using a
12-hour clock. The numbers on a wall clock
are on an interval scale since they are
equidistant and measurable.
• For example, the difference between 1
o’clock and 2 o’clock is the same as that
between 2 o’clock and 3 o’clock.
INTERVAL DATA
3. IQ Test
• According to psychological
studies, one can not have zero
IQ. Also, IQ is determined using
a fixed measurement scale.
Therefore, IQ is an example of
interval data.
RATIO DATA
Similar to interval but ratio has a true
ZERO or starting point
Example;
Hight, Weight, Length, distance,
traveled
Each point value can be expressed as
meaningful ratio to another e.g twice
the weight
EXAMPLES
What is your weight in kgs?
• Less than 50 kgs
• 51-60 kgs
• 61-70 kgs
• 71-80 kgs
• 81-90 kgs
• Above 90 Kgs
What is your height in feet
and inches?
• Less than 5 feet.
• 5 feet 1 inch – 5 feet 5
inches
• 5 feet 6 inches- 6 feet
• More than 6 feet
What is the number of
burgers you can eat daily?
• 1-2
• 2-3
• 3-4
• 4-5
• 5-6
• More than 6
Questions

Introduction to biostatistics

  • 1.
    BIOSTATISTICS MODULE-10 Dr Qurat-Ul-Ain Assistant Professor/ HoD Community Dentistry Department HBS Medical & Dental College
  • 3.
    BIO - STATISTICS Twowords bio and statistics 1. Bio : that relating to biological problems or living organisms 2. Statistics : data gathering
  • 4.
    BIOSTATISTICS • DEFINITION Statistical processesand methods applied to the collection, analysis, and interpretation of biological data and especially data relating to human biology, health, and medicine
  • 5.
    VARIABLES • A variableis a factor that can take different values for individuals in a study • Variable is something that we can measure as well as manipulate • Experimental or non- experimental studies • Dependent and independent variable
  • 8.
    VARIABLE Examples • Age • Weight •Business Income • Expenses, • Country Of Birth • Capital Expenditure • Class Grades
  • 9.
    TYPES OF VARIABLE 1.Variable may Qualitative (Categorical – Describe attribute) • Binary • Nominal • Ordinal 2. Variables may Quantitative (Numerical values) • Continuous Data • Discrete Data
  • 10.
    QUALITATIVE = CATEGORICALVARIABLE 1. Binary: Allocation of observations to one of only two possible categories. Example, Gender m/f , yes/no, True/False
  • 11.
    QUALITATIVE = CATEGORICALVARIABLE 2. Nominal: • Allocation of observations into more than two categories. • The data cant be ranked or grouped in any order at all • Example, Brown Black Red Silver Yellow
  • 12.
    QUALITATIVE = CATEGORICALVARIABLE 3. Ordinal: Allocation of observations into more than two categories that can be ordered. Example Unhappy - Ok Happy - Very Happy Anxious - Not anxious - Very anxious – Extremely anxious
  • 14.
    QUANTITATIVE = NUMERICALVARIABLES 1. Continuous Data: A set of data is said to be continuous if the values are measurements that can assume any value within a specified range. Example: Temperature ,Height, Weight
  • 15.
    QUALITATIVE = CATEGORICALVARIABLE 2. Discrete Data: A set of data is said to be discrete if the values are distinct and separate. That is, they can be counted (1,2,3, ...). Example : Number of new TB cases in a month / Number of patients in a clinic
  • 16.
    DATA • Data isa set of values of qualitative or quantitative variables. • Facts or figures to be processed; evidence, records, statistics, etc. from which conclusions can be inferred
  • 19.
    1- QUANTITIVE OR(NUMERICAL DATA). Data which can be measured with a scale or which gives numeric values Example; 1. Age 2. weight & Hight 3. Temperature 4. Blood pressure 5. How many pages you can read of your favorite book before you fall asleep
  • 20.
    2-QUALITATIVE OR CATEGORICALDATA Data which can be counted or which has different categories Example; 1. Gender 2. Blood Group 3. Marital Status 4. Hometown 5. Types of Movies they Like
  • 21.
    CLASSIFICATION OF DATA •Data can classified in number of ways, one is as described above Qualitative & Quantitative • Others types are; 1. Nominal Data 2. Ordinal Data 3. Interval 4. Ratio
  • 22.
    NOMINAL DATA • Thistype of data is in the form of names, labels or categories. • It cannot be ranked or grouped in any order. • Nominal is the lowest level. Only names are meaningful here. Example; Gender , Race, Type of teeth ect
  • 23.
    ORDINAL DATA • Ordinaladds an order to the name Example • Large, Medium, Small • Good, Bad, Malnourished • Normal , Overweight, Obese, • Decayed , Missing , Filled
  • 24.
    INTERVAL DATA • Intervaldata is a type of data which is measured along a scale, in which each point is placed at an equal distance (interval) from one another. • Examples; 1. Temperature 2. Time 3. IQ
  • 25.
    INTERVAL DATA 1. Temperature Anexample of interval data is the data collected on a thermometer— its gradation or markings are equidistant.
  • 26.
    INTERVAL DATA 2. Time •Time passes as a good example of interval data if measured during the day or using a 12-hour clock. The numbers on a wall clock are on an interval scale since they are equidistant and measurable. • For example, the difference between 1 o’clock and 2 o’clock is the same as that between 2 o’clock and 3 o’clock.
  • 27.
    INTERVAL DATA 3. IQTest • According to psychological studies, one can not have zero IQ. Also, IQ is determined using a fixed measurement scale. Therefore, IQ is an example of interval data.
  • 28.
    RATIO DATA Similar tointerval but ratio has a true ZERO or starting point Example; Hight, Weight, Length, distance, traveled Each point value can be expressed as meaningful ratio to another e.g twice the weight
  • 29.
    EXAMPLES What is yourweight in kgs? • Less than 50 kgs • 51-60 kgs • 61-70 kgs • 71-80 kgs • 81-90 kgs • Above 90 Kgs What is your height in feet and inches? • Less than 5 feet. • 5 feet 1 inch – 5 feet 5 inches • 5 feet 6 inches- 6 feet • More than 6 feet What is the number of burgers you can eat daily? • 1-2 • 2-3 • 3-4 • 4-5 • 5-6 • More than 6
  • 31.