Download to read offline


![MEASURES OF CENTRL TENDENCY FOR GROUPED DATA
Median ( 𝜇, 𝑥 )
𝜇 = 𝐿𝐶𝐵 𝑚 + 𝑐 [
𝑛
2
− 𝐹 𝑚−1
𝑓𝑚
]
𝑥 =𝐿𝐶𝐵 𝑚 + 𝑐 [
𝑛
2
−𝐹 𝑚−1
𝑓 𝑚
]
Where :
𝐿𝐶𝐵 𝑚 = is the lower class boundary of the median class
𝑐 = class width
𝐹 𝑚−1 = cumulative frequency before the cumulative frequency of the
median class.
𝑓𝑚 = frequency of the median class
n = number of observation](https://image.slidesharecdn.com/presentation1-151208090121-lva1-app6891/85/statistic-midterm-9-320.jpg)
![MEASURES OF CENTRL TENDENCY FOR GROUPED DATA
Mode ( 𝜇, 𝑥 )
𝜇 = 𝐿𝐶𝐵 𝑚𝑜 + 𝑐 [
𝑓 𝑚0 − 𝑓1
2𝑓𝑚𝑜 − 𝑓1 − 𝑓2
]
𝑥 = 𝐿𝐶𝐵 𝑚𝑜 + 𝑐 [
𝑓 𝑚0 − 𝑓1
2𝑓𝑚𝑜 − 𝑓1 − 𝑓2
]
where
𝐿𝐶𝐵 𝑚𝑜= is the lower class boundary of the
modal class
c = the class width
𝑓 𝑚0 = frequency of the modal class
𝑓1 = frequency before the modal class
𝑓2 = frequency after the modal class.](https://image.slidesharecdn.com/presentation1-151208090121-lva1-app6891/85/statistic-midterm-10-320.jpg)


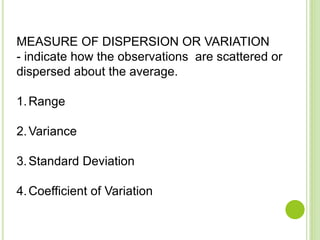
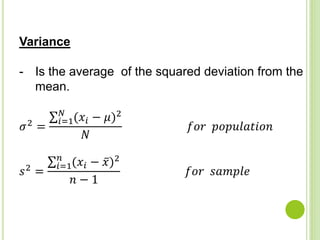
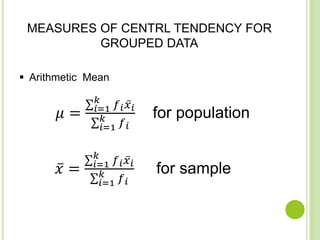
This document discusses measures of central tendency and dispersion for grouped and ungrouped data. It defines range, variance, standard deviation, and coefficient of variation as measures of dispersion that indicate how observations are scattered around the average. It also provides the formulas to calculate the mean, median, and mode for grouped data as measures of central tendency, and the lower class boundary method to determine median and mode for grouped data.