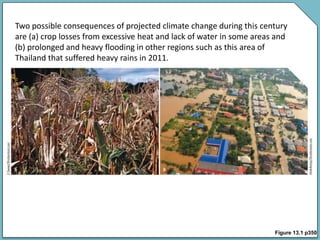
1) The document discusses the evidence and impacts of climate change, including rising global temperatures, extreme weather events, and effects on ecosystems and human health and society.
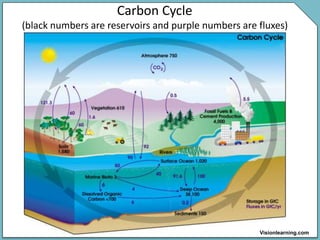
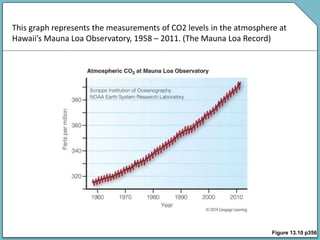
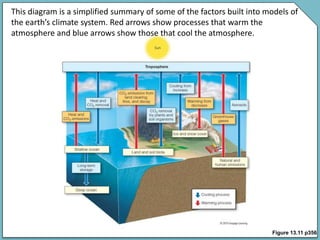
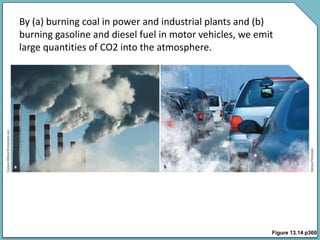
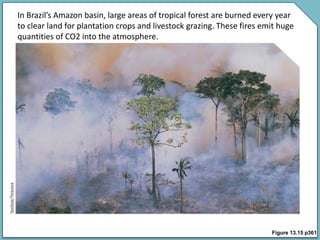
2) Key drivers of climate change identified are greenhouse gas emissions from burning fossil fuels and deforestation which increase atmospheric CO2 and global temperatures.
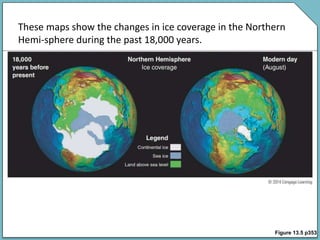
3) Impacts of climate change discussed include melting ice sheets and glaciers, rising sea levels, ocean warming and acidification, and threats to food production and biodiversity.