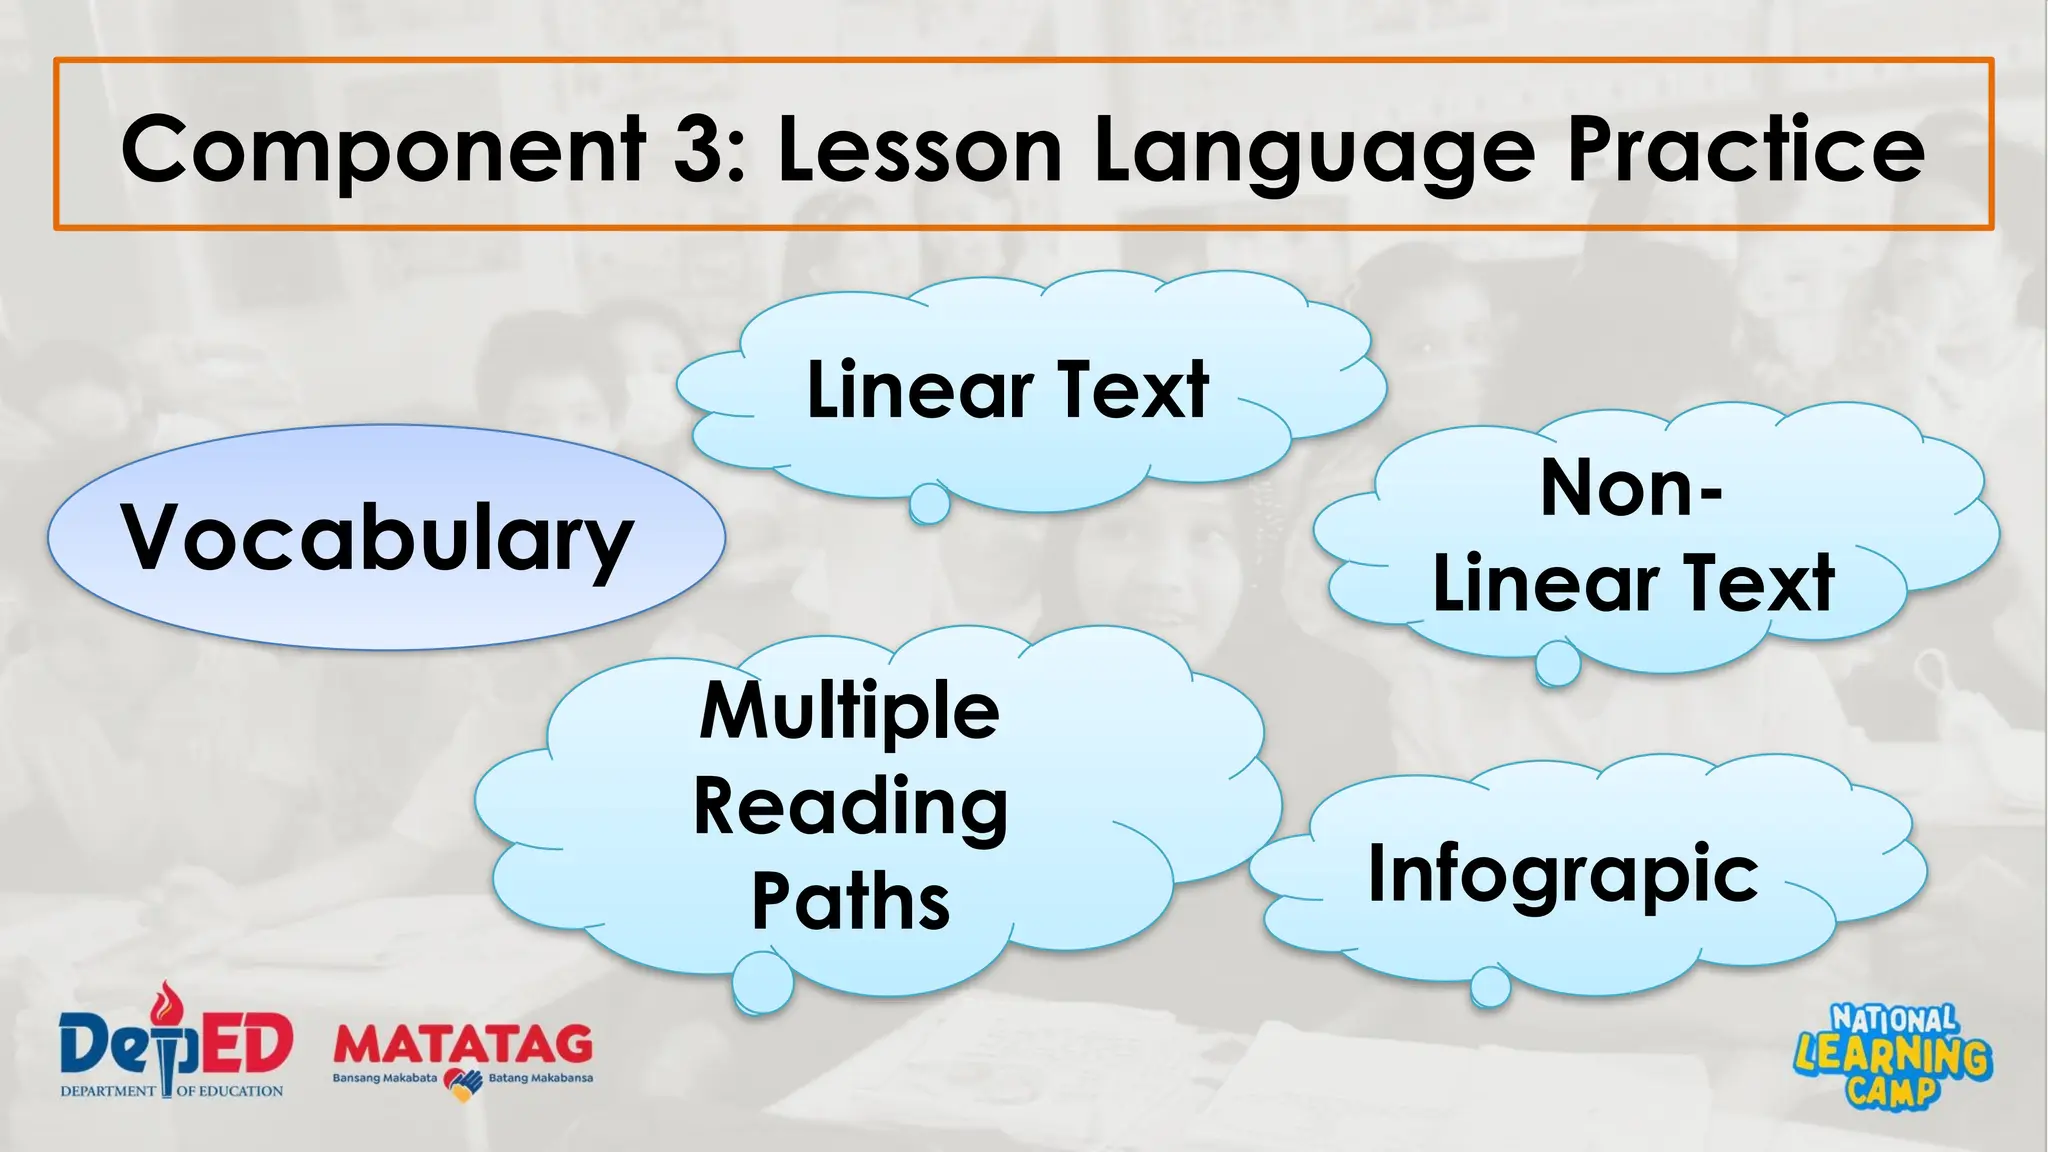
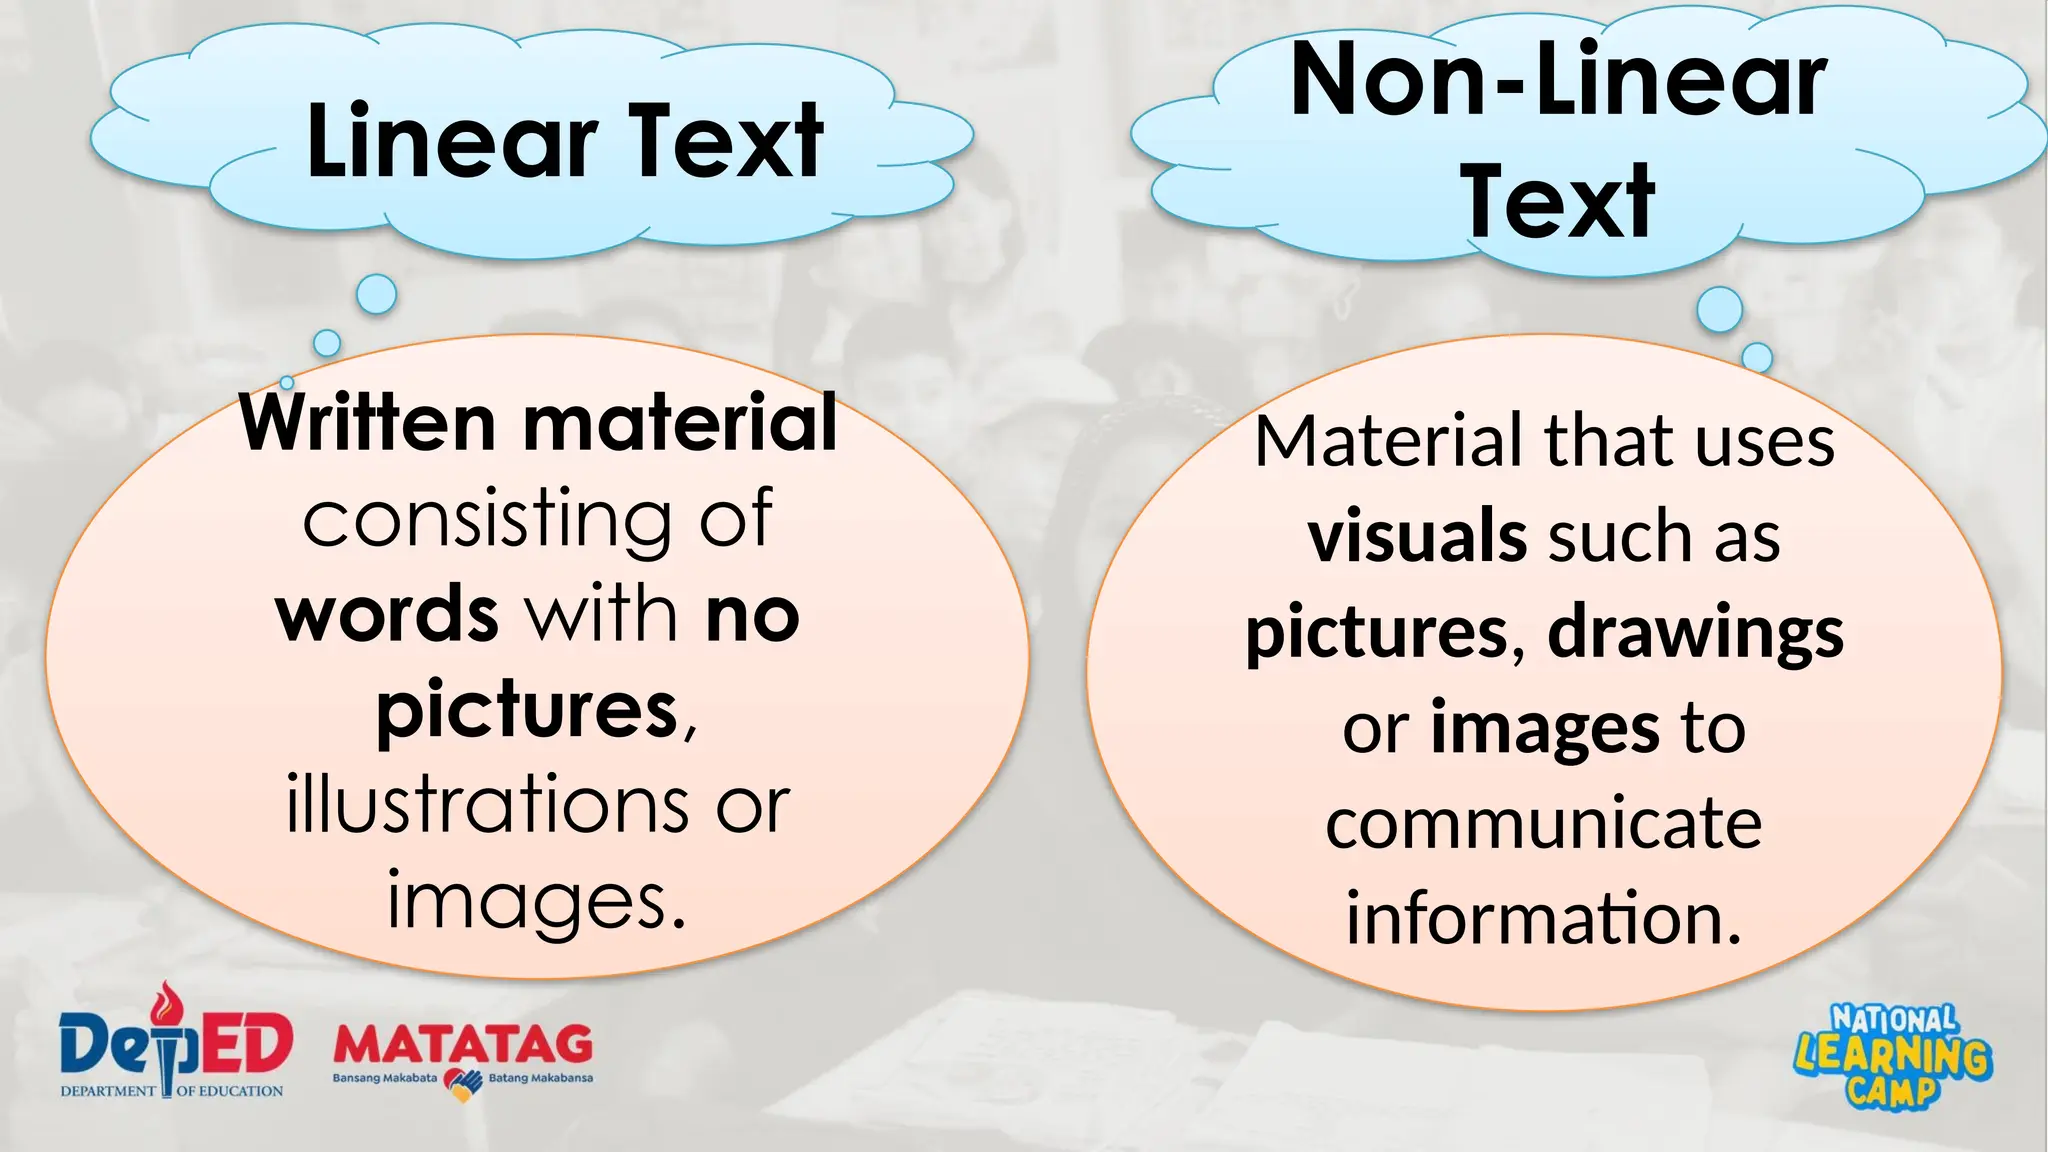
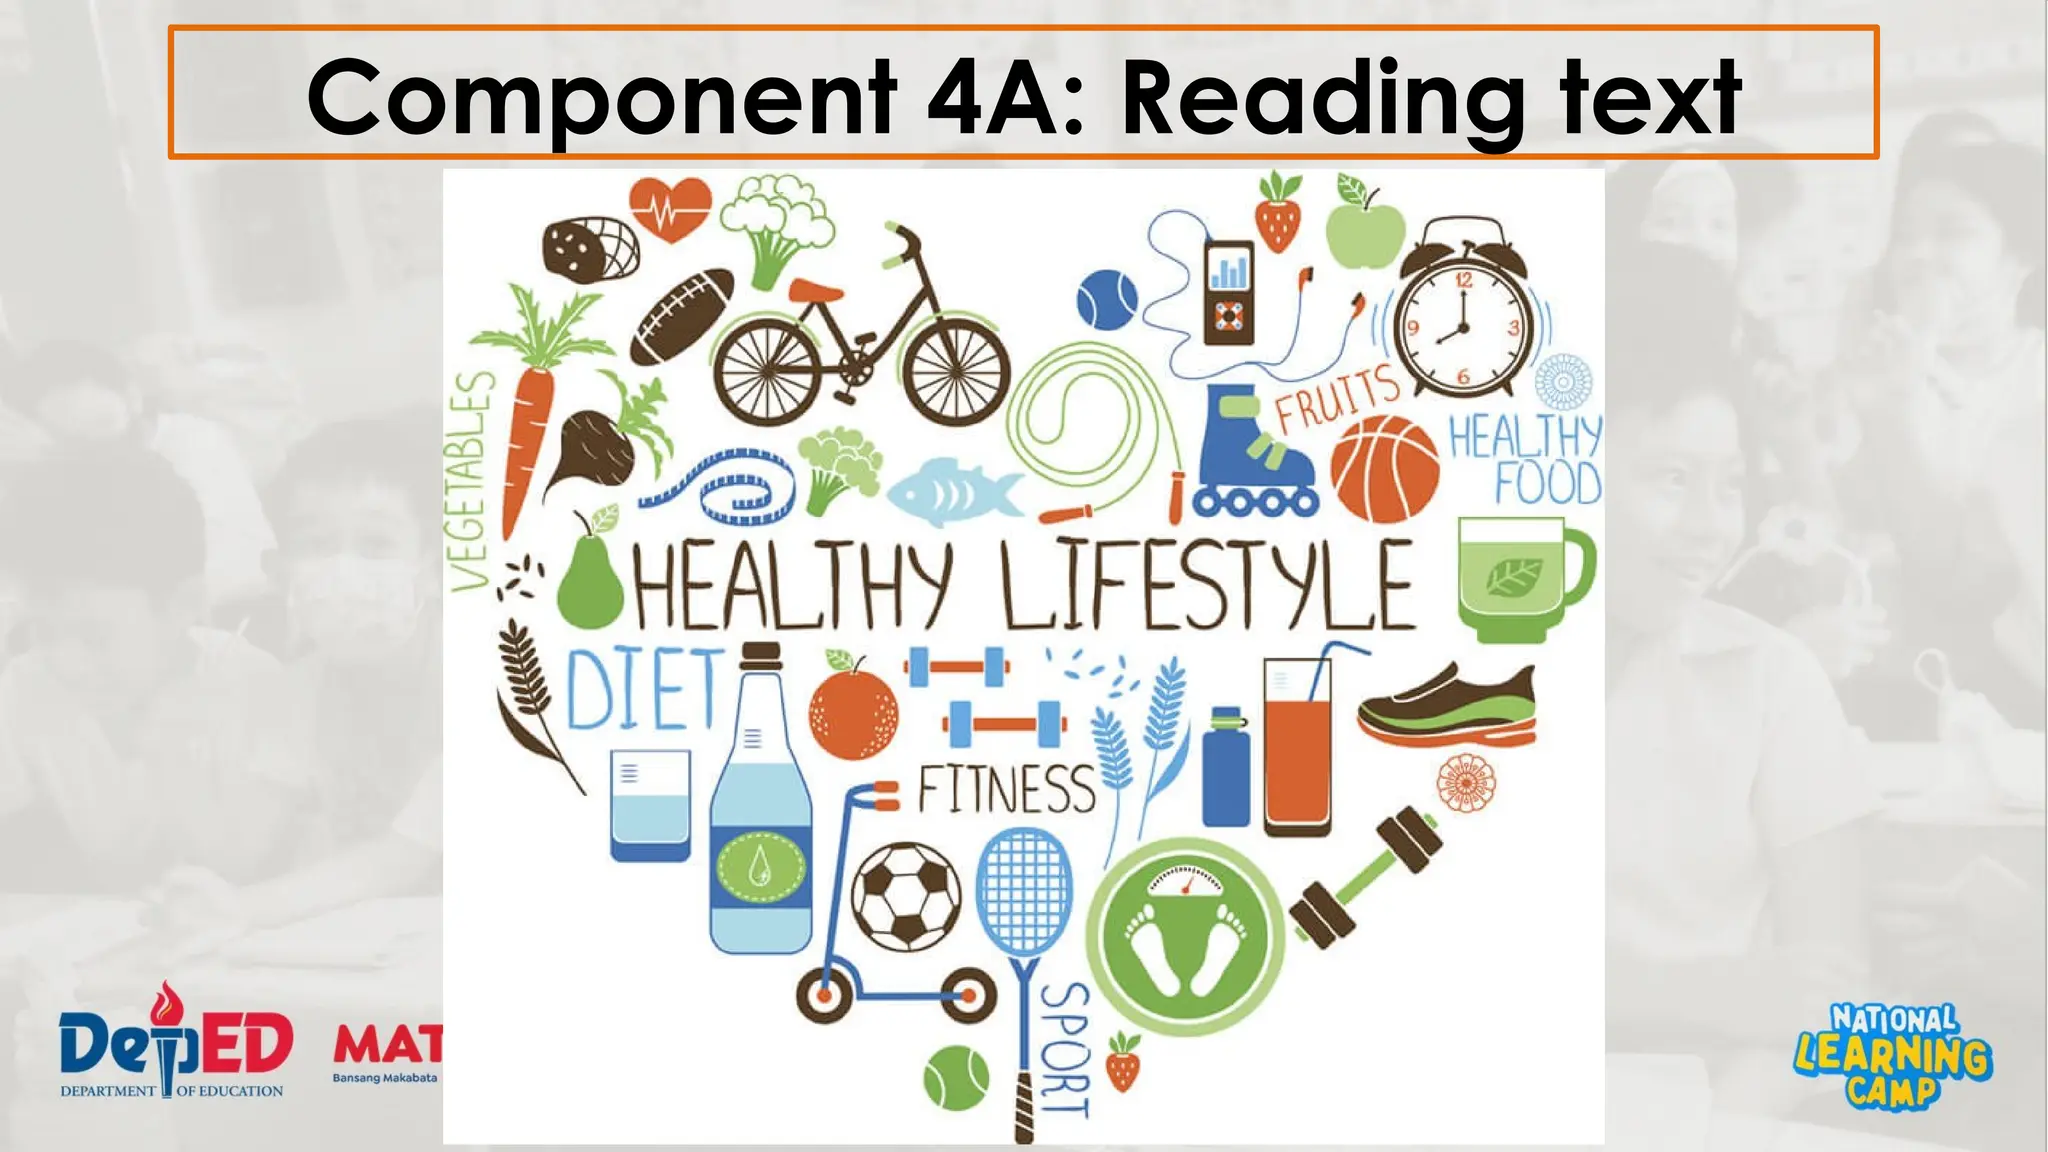
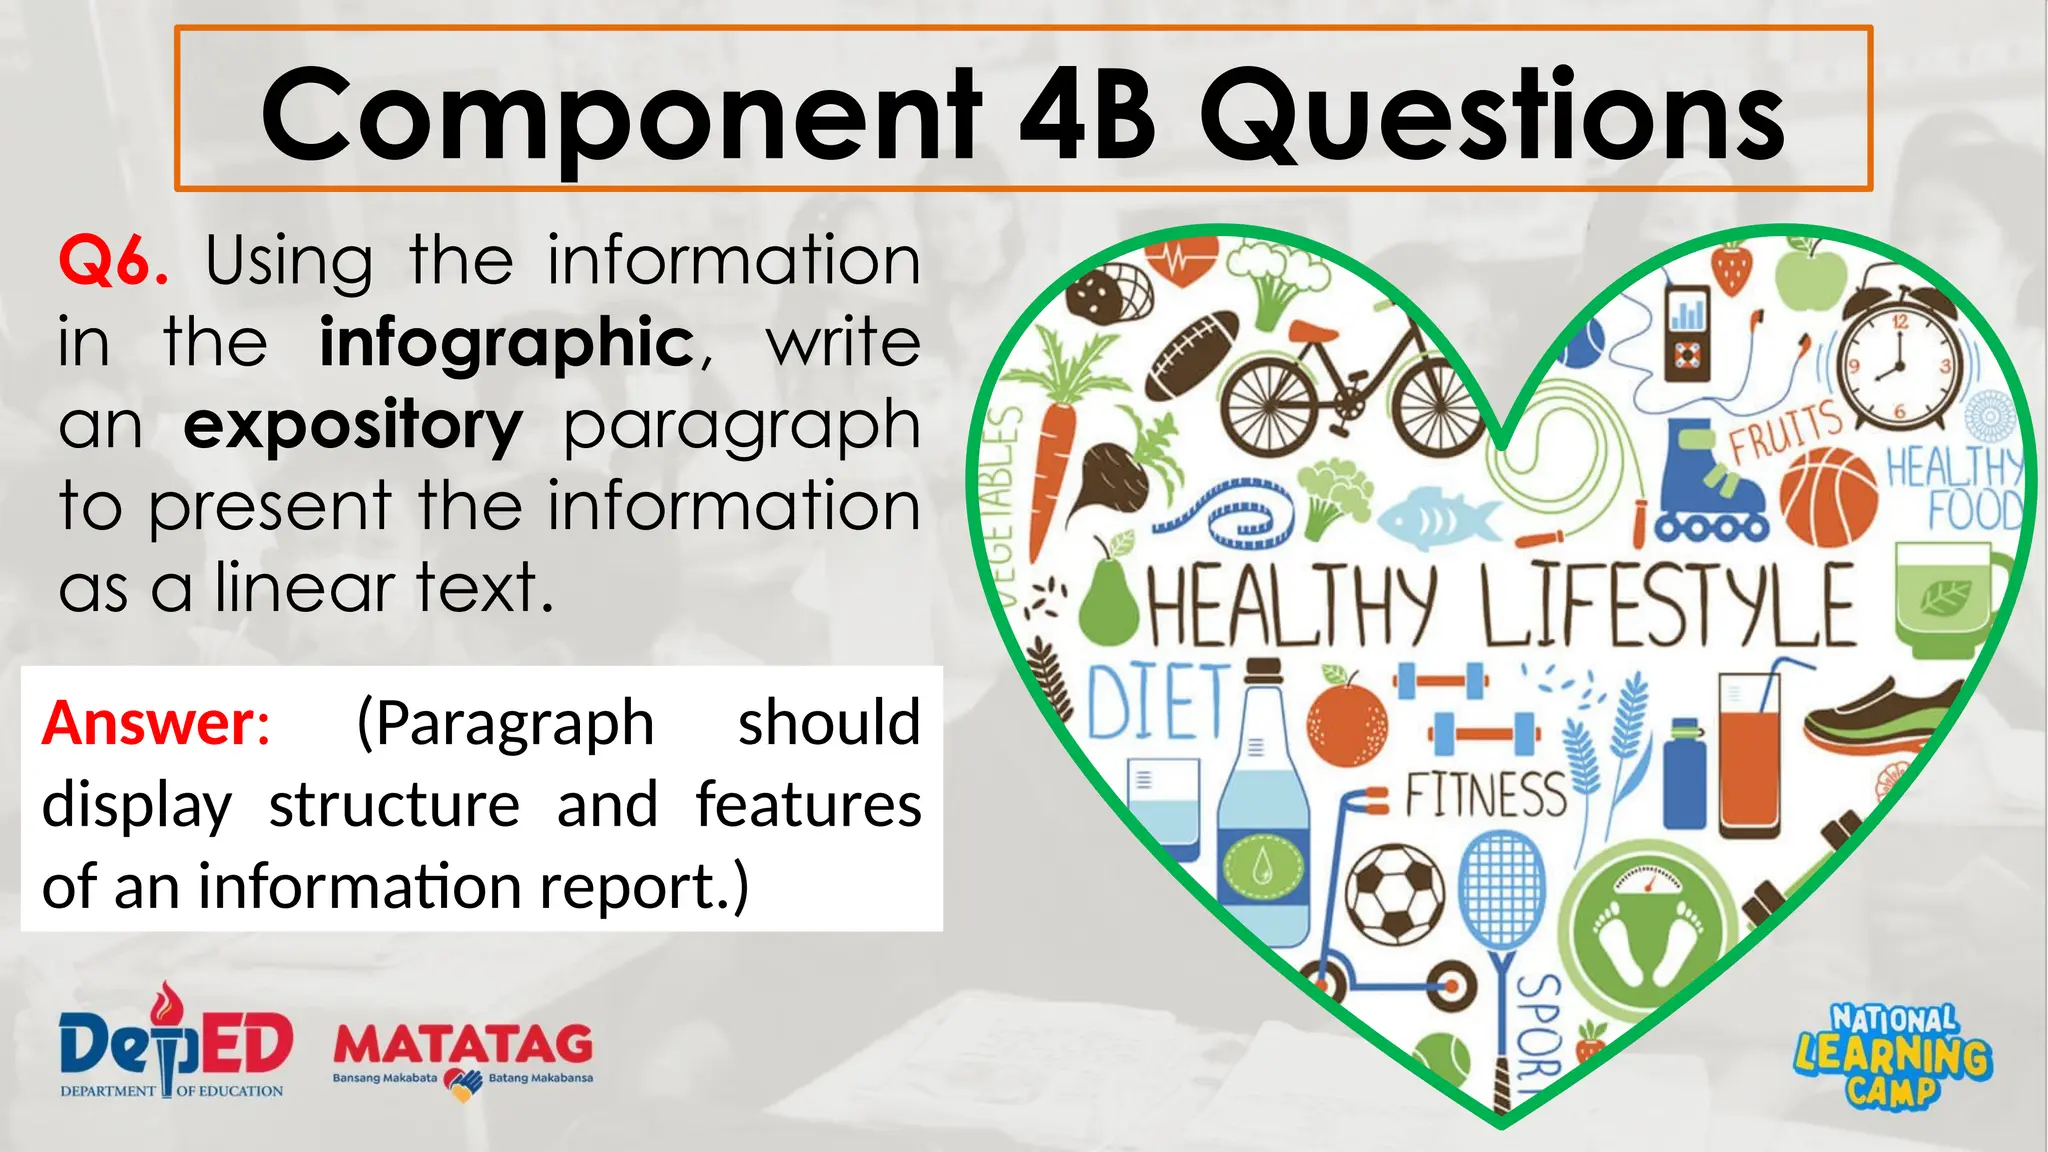
CAMPERS!
CONSOLIDATION CAMP
Lesson 8
Reading Non-Linear Texts
Key Idea
Locating and
interpreting information
in non-linear texts
Most Essential Learning Competencies:
 Explain visual-verbal relationships illustrated in
tables, graphs, and information maps found
in expository texts
 Compare and contrast the presentation of
the same topic in different multimodal texts
 Synthesize essential information found in
various sources
Component 1: Short review
Q1. What are some types of information
texts you know?
Answer: Expository (or information
reports), explanation.
Component 1: Short review
Q2. What is the purpose of information
texts?
Answer: To provide information about
things, processes or phenomena.
Component 1: Short review
Q3. What are some features of
information texts?
Answer: They are factual or non-fiction
texts; they give us information or explain
things.
Component 2: Purpose of the lesson
In this lesson:
 We are going to look at a different way of
organizing information.
 We are going to focus on how information
can be communicated visually.
 You are going to learn some strategies for
making sense of information from an
infographic.
Component 3: Lesson Language Practice
Vocabulary
Linear Text
Non-
Linear Text
Multiple
Reading
Paths Infograpic
Written material
consisting of
words with no
pictures,
illustrations or
images.
Linear Text
Non-Linear
Text
Material that uses
visuals such as
pictures, drawings
or images to
communicate
information.
Reading in linear,
nonlinear or non-
sequential way; the
readers can choose
their own reading
path.
information + graphic - a
representation of
information using pictures
and diagrams designed to
make the data easy to
understand at a glance.
Infograpic
Multiple
Reading Paths
Component 4A: Reading text
Here are some tips on getting information
from a non-linear text.
R A E S S
READ
ANALYZE
EXAMINE
STUDY
SUMMARIZE
Read the title which gives the gist of what the
image is about.
Analyze the information by examining the
images and words thoroughly.
Examine the pictures, symbols or shapes that
tell information.
Study the relationship of the information and
images deeply.
Summarize the information in the text.
Component 4B Questions
Q1. What does this
infographic show?
(Write your answer in
a full sentence.)
Answer: The infographic shows
different aspects of a healthy
lifestyle in a heart-shaped
image. This suggests a healthy
lifestyle is something to like and
is good for the heart.
Component 4B Questions
Q2. According to
the graphic, what
does a healthy
lifestyle include?
Answer: A diet of
healthy food; fitness
and sporting activities.
Component 4B Questions
Q3. What are some
examples of healthy
food provided in the
image?
Answer: Healthy food including
fruit, e.g., apple, pear,
strawberry; vegetables ,e.g.,
carrot, broccoli,
cauliflower; healthy drinks, e.g.,
water, fruit juice, green tea.
Component 4B Questions
Q4. Do you think
the information in
this image is
arranged
effectively? Give
reasons for your
answer.
Component 4B Questions
Q5. How could you organize
the information in this
graphic differently? Create
your own non-linear text using
some of the information in the
image.
Answer: (Various responses are
acceptable, e.g., table, concept
map)
Component 4B Questions
Q6. Using the information
in the infographic, write
an expository paragraph
to present the information
as a linear text.
Answer: (Paragraph should
display structure and features
of an information report.)
Component 5: Lesson Conclusion
Questions: 1. The focus of the lesson
was on learning about how to locate
and interpret information presented
visually. How has the lesson helped you
to make sense of a non-linear text?
Component 5: Lesson Conclusion
Question 2. Which questions were easy
to answer? Why?
Question 3. What strategies did you use
to answer the harder
questions?
Campers!

Grade 8 Consolidation - Lesson 8 (Reading Non Linear Text).pptx

  • 1.
  • 2.
  • 3.
    Key Idea Locating and interpretinginformation in non-linear texts
  • 4.
    Most Essential LearningCompetencies:  Explain visual-verbal relationships illustrated in tables, graphs, and information maps found in expository texts  Compare and contrast the presentation of the same topic in different multimodal texts  Synthesize essential information found in various sources
  • 5.
    Component 1: Shortreview Q1. What are some types of information texts you know? Answer: Expository (or information reports), explanation.
  • 6.
    Component 1: Shortreview Q2. What is the purpose of information texts? Answer: To provide information about things, processes or phenomena.
  • 7.
    Component 1: Shortreview Q3. What are some features of information texts? Answer: They are factual or non-fiction texts; they give us information or explain things.
  • 8.
    Component 2: Purposeof the lesson In this lesson:  We are going to look at a different way of organizing information.  We are going to focus on how information can be communicated visually.  You are going to learn some strategies for making sense of information from an infographic.
  • 9.
    Component 3: LessonLanguage Practice Vocabulary Linear Text Non- Linear Text Multiple Reading Paths Infograpic
  • 10.
    Written material consisting of wordswith no pictures, illustrations or images. Linear Text Non-Linear Text Material that uses visuals such as pictures, drawings or images to communicate information.
  • 11.
    Reading in linear, nonlinearor non- sequential way; the readers can choose their own reading path. information + graphic - a representation of information using pictures and diagrams designed to make the data easy to understand at a glance. Infograpic Multiple Reading Paths
  • 12.
  • 13.
    Here are sometips on getting information from a non-linear text. R A E S S READ ANALYZE EXAMINE STUDY SUMMARIZE
  • 14.
    Read the titlewhich gives the gist of what the image is about. Analyze the information by examining the images and words thoroughly. Examine the pictures, symbols or shapes that tell information. Study the relationship of the information and images deeply. Summarize the information in the text.
  • 15.
    Component 4B Questions Q1.What does this infographic show? (Write your answer in a full sentence.) Answer: The infographic shows different aspects of a healthy lifestyle in a heart-shaped image. This suggests a healthy lifestyle is something to like and is good for the heart.
  • 16.
    Component 4B Questions Q2.According to the graphic, what does a healthy lifestyle include? Answer: A diet of healthy food; fitness and sporting activities.
  • 17.
    Component 4B Questions Q3.What are some examples of healthy food provided in the image? Answer: Healthy food including fruit, e.g., apple, pear, strawberry; vegetables ,e.g., carrot, broccoli, cauliflower; healthy drinks, e.g., water, fruit juice, green tea.
  • 18.
    Component 4B Questions Q4.Do you think the information in this image is arranged effectively? Give reasons for your answer.
  • 19.
    Component 4B Questions Q5.How could you organize the information in this graphic differently? Create your own non-linear text using some of the information in the image. Answer: (Various responses are acceptable, e.g., table, concept map)
  • 20.
    Component 4B Questions Q6.Using the information in the infographic, write an expository paragraph to present the information as a linear text. Answer: (Paragraph should display structure and features of an information report.)
  • 21.
    Component 5: LessonConclusion Questions: 1. The focus of the lesson was on learning about how to locate and interpret information presented visually. How has the lesson helped you to make sense of a non-linear text?
  • 22.
    Component 5: LessonConclusion Question 2. Which questions were easy to answer? Why? Question 3. What strategies did you use to answer the harder questions?
  • 23.