Download as PDF, PPTX
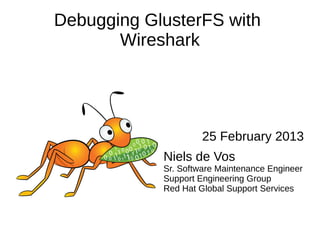

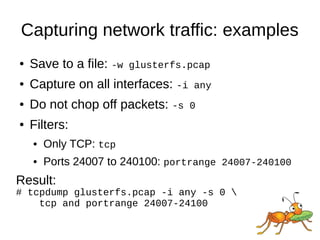
![Identifying packets: example
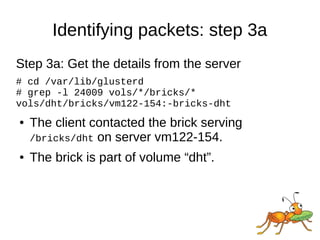
Minimal packet details needed:
Internet Protocol Version 4
Source: 172.31.122.154
Destination: 172.31.122.104
Transmission Control Protocol
Source port: 24009
Destination port: 1022
Remote Procedure Call
Message Type: Reply (1)
[Program: GlusterFS (1298437)]
[Program Version: 330]
[Procedure: LOOKUP (27)]](https://image.slidesharecdn.com/x4ftqultq22r5ak9il9a-signature-1e22e3c02f143bdbaade1033e41083e3186e10cee46774b782105433d60d093c-poli-160517072538/85/Debugging-with-wireshark-niels-de-vos-8-320.jpg)
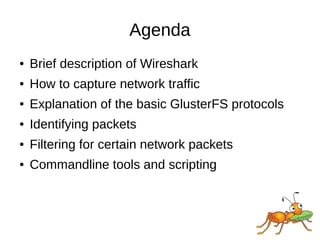
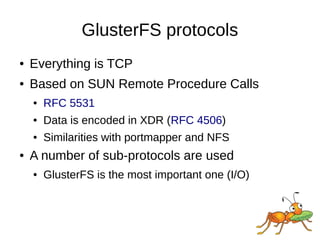
![Identifying packets: step 1
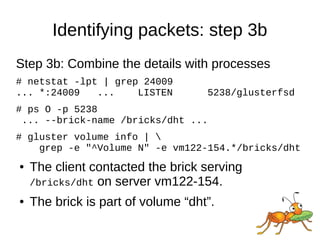
Step 1:
Remote Procedure Call
Message Type: Reply (1)
[Program: GlusterFS (1298437)]
[Program Version: 330]
[Procedure: LOOKUP (27)]
● A reply on a LOOKUP is sent from a brick to a
client.
● The GlusterFS protocol is handled by a brick
process (glusterfsd) on the server.](https://image.slidesharecdn.com/x4ftqultq22r5ak9il9a-signature-1e22e3c02f143bdbaade1033e41083e3186e10cee46774b782105433d60d093c-poli-160517072538/85/Debugging-with-wireshark-niels-de-vos-9-320.jpg)
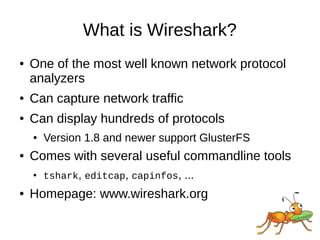
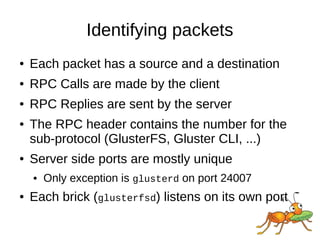
![Filtering on RPC Credentials
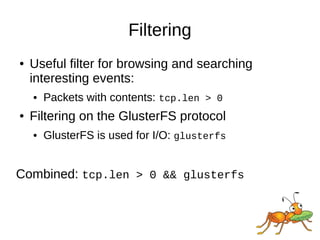
The RPC Credentials sent with a Call contain:
Remote Procedure Call, Type:Call
Program: GlusterFS (1298437)
Procedure: CREATE (23)
Credentials
Flavor: AUTH_GLUSTERFS (390039)
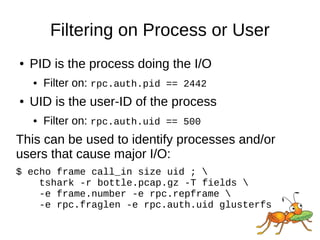
PID: 2442
UID: 500
GID: 500
Auxiliary GIDs (1) [500]
GID: 500
An RPC Reply does not contain the Credentials,
but there is a reference to the Call.](https://image.slidesharecdn.com/x4ftqultq22r5ak9il9a-signature-1e22e3c02f143bdbaade1033e41083e3186e10cee46774b782105433d60d093c-poli-160517072538/85/Debugging-with-wireshark-niels-de-vos-15-320.jpg)


This document discusses using Wireshark to debug GlusterFS network traffic. It provides an overview of Wireshark, how to capture GlusterFS packets, identify the basic GlusterFS protocols, and build filters. Specific examples are given to identify packets from a client to a GlusterFS brick, determine which volume and server the brick is on, and filter on process ID, user ID, and RPC procedures. Statistics collection and decrypting SSL traffic are also briefly covered.