Download to read offline
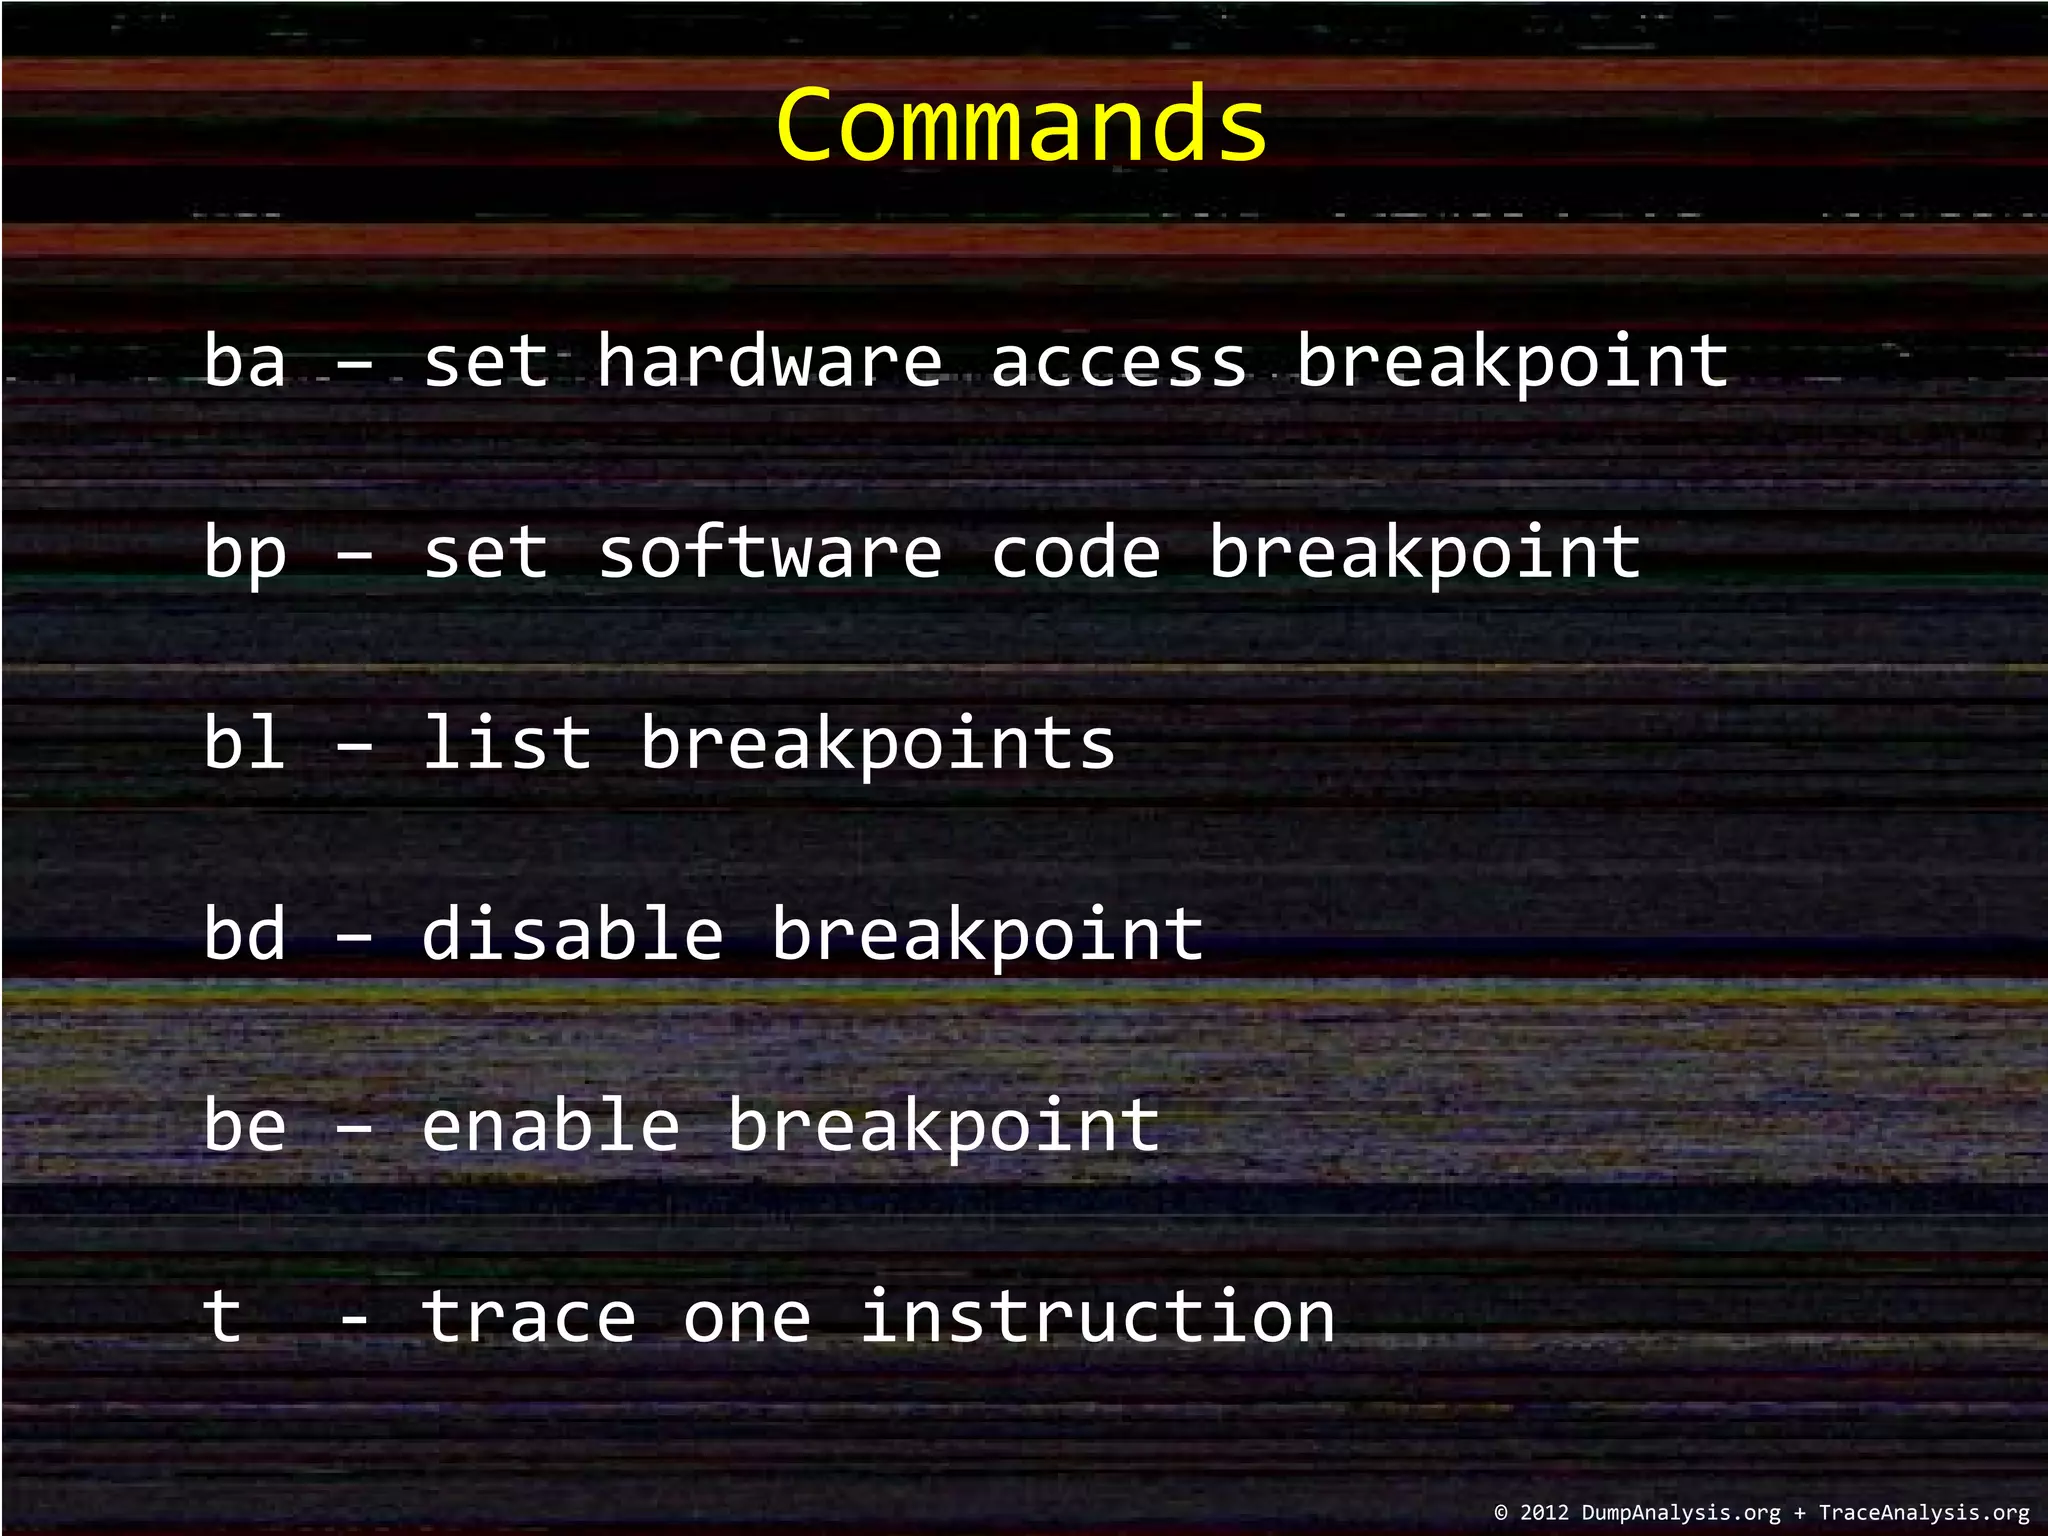
![0:001> ba w4 Controller
0:001> bp MixedBreakpoints!WorkItemNormal+0x4a “bd 0; t“ * disable, skip
0:001> u MixedBreakpoints!WorkItemNormal+0x4a
MixedBreakpoints!WorkItemNormal+0x4a:
00000001`3fe414ea c705ecaa000010000000 mov dword ptr [MixedBreakpoints!Controller (00000001`3fe4bfe0)],10h
00000001`3fe414f4 ebbd [...]
0:001> bp 00000001`3fe414f4 “be 0; g“ * enable, resume
0:001> bl
0 e 00000001`3f03bfe0 w 4 0001 (0001) 0:**** MixedBreakpoints!Controller
1 e 00000001`3f0314ea 0001 (0001) 0:**** MixedBreakpoints!WorkItemNormal+0x4a "bd 0; t"
2 e 00000001`3f0314f4 0001 (0001) 0:**** MixedBreakpoints!WorkItemNormal+0x54 "be 0; g"
0:001> g; g * we skip the first write
Breakpoint 0 hit
Breakpoint 0 hit
MixedBreakpoints!WorkItemDefect+0x12:
00000001`3fdc1512 33c0 xor eax,eax
0:002> k
Child-SP RetAddr Call Site
00000000`02f8fda8
00000000`02f8fdb0 00000000`76d5c521 kernel32!BaseThreadInitThunk+0xd
00000000`02f8fde0 00000000`00000000 ntdll!RtlUserThreadStart+0x1d
Debugger Output
© 2012 DumpAnalysis.org + TraceAnalysis.org](https://image.slidesharecdn.com/debuggingtvframe0x09-171020151342/75/Debugging-TV-Frame-0x09-5-2048.jpg)

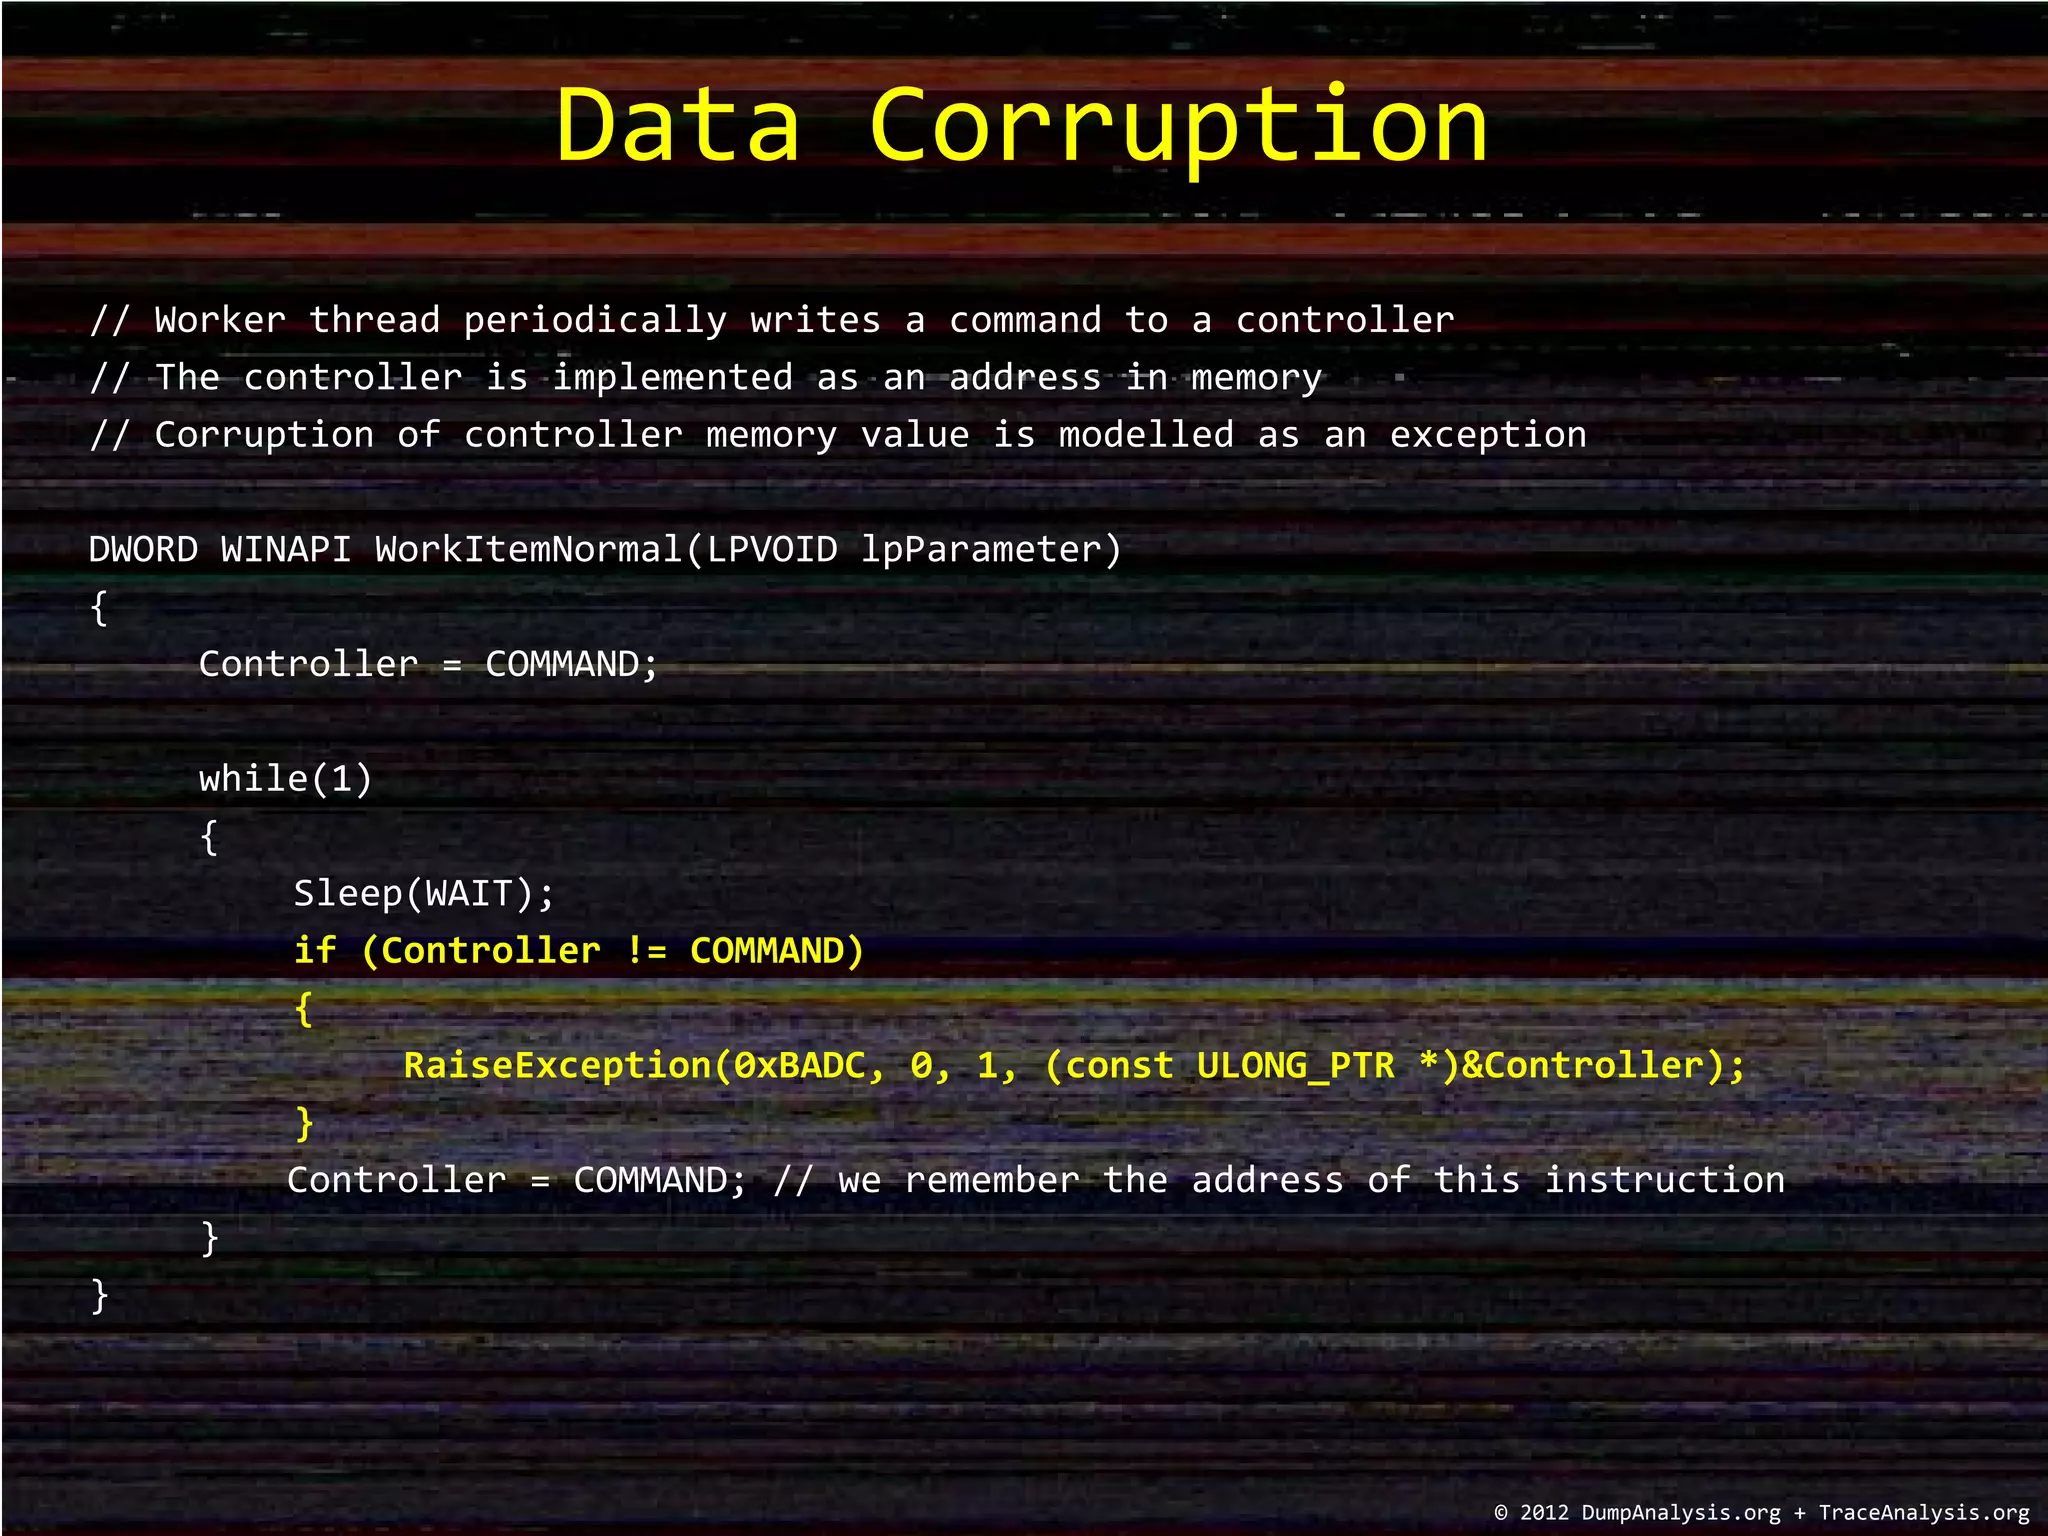
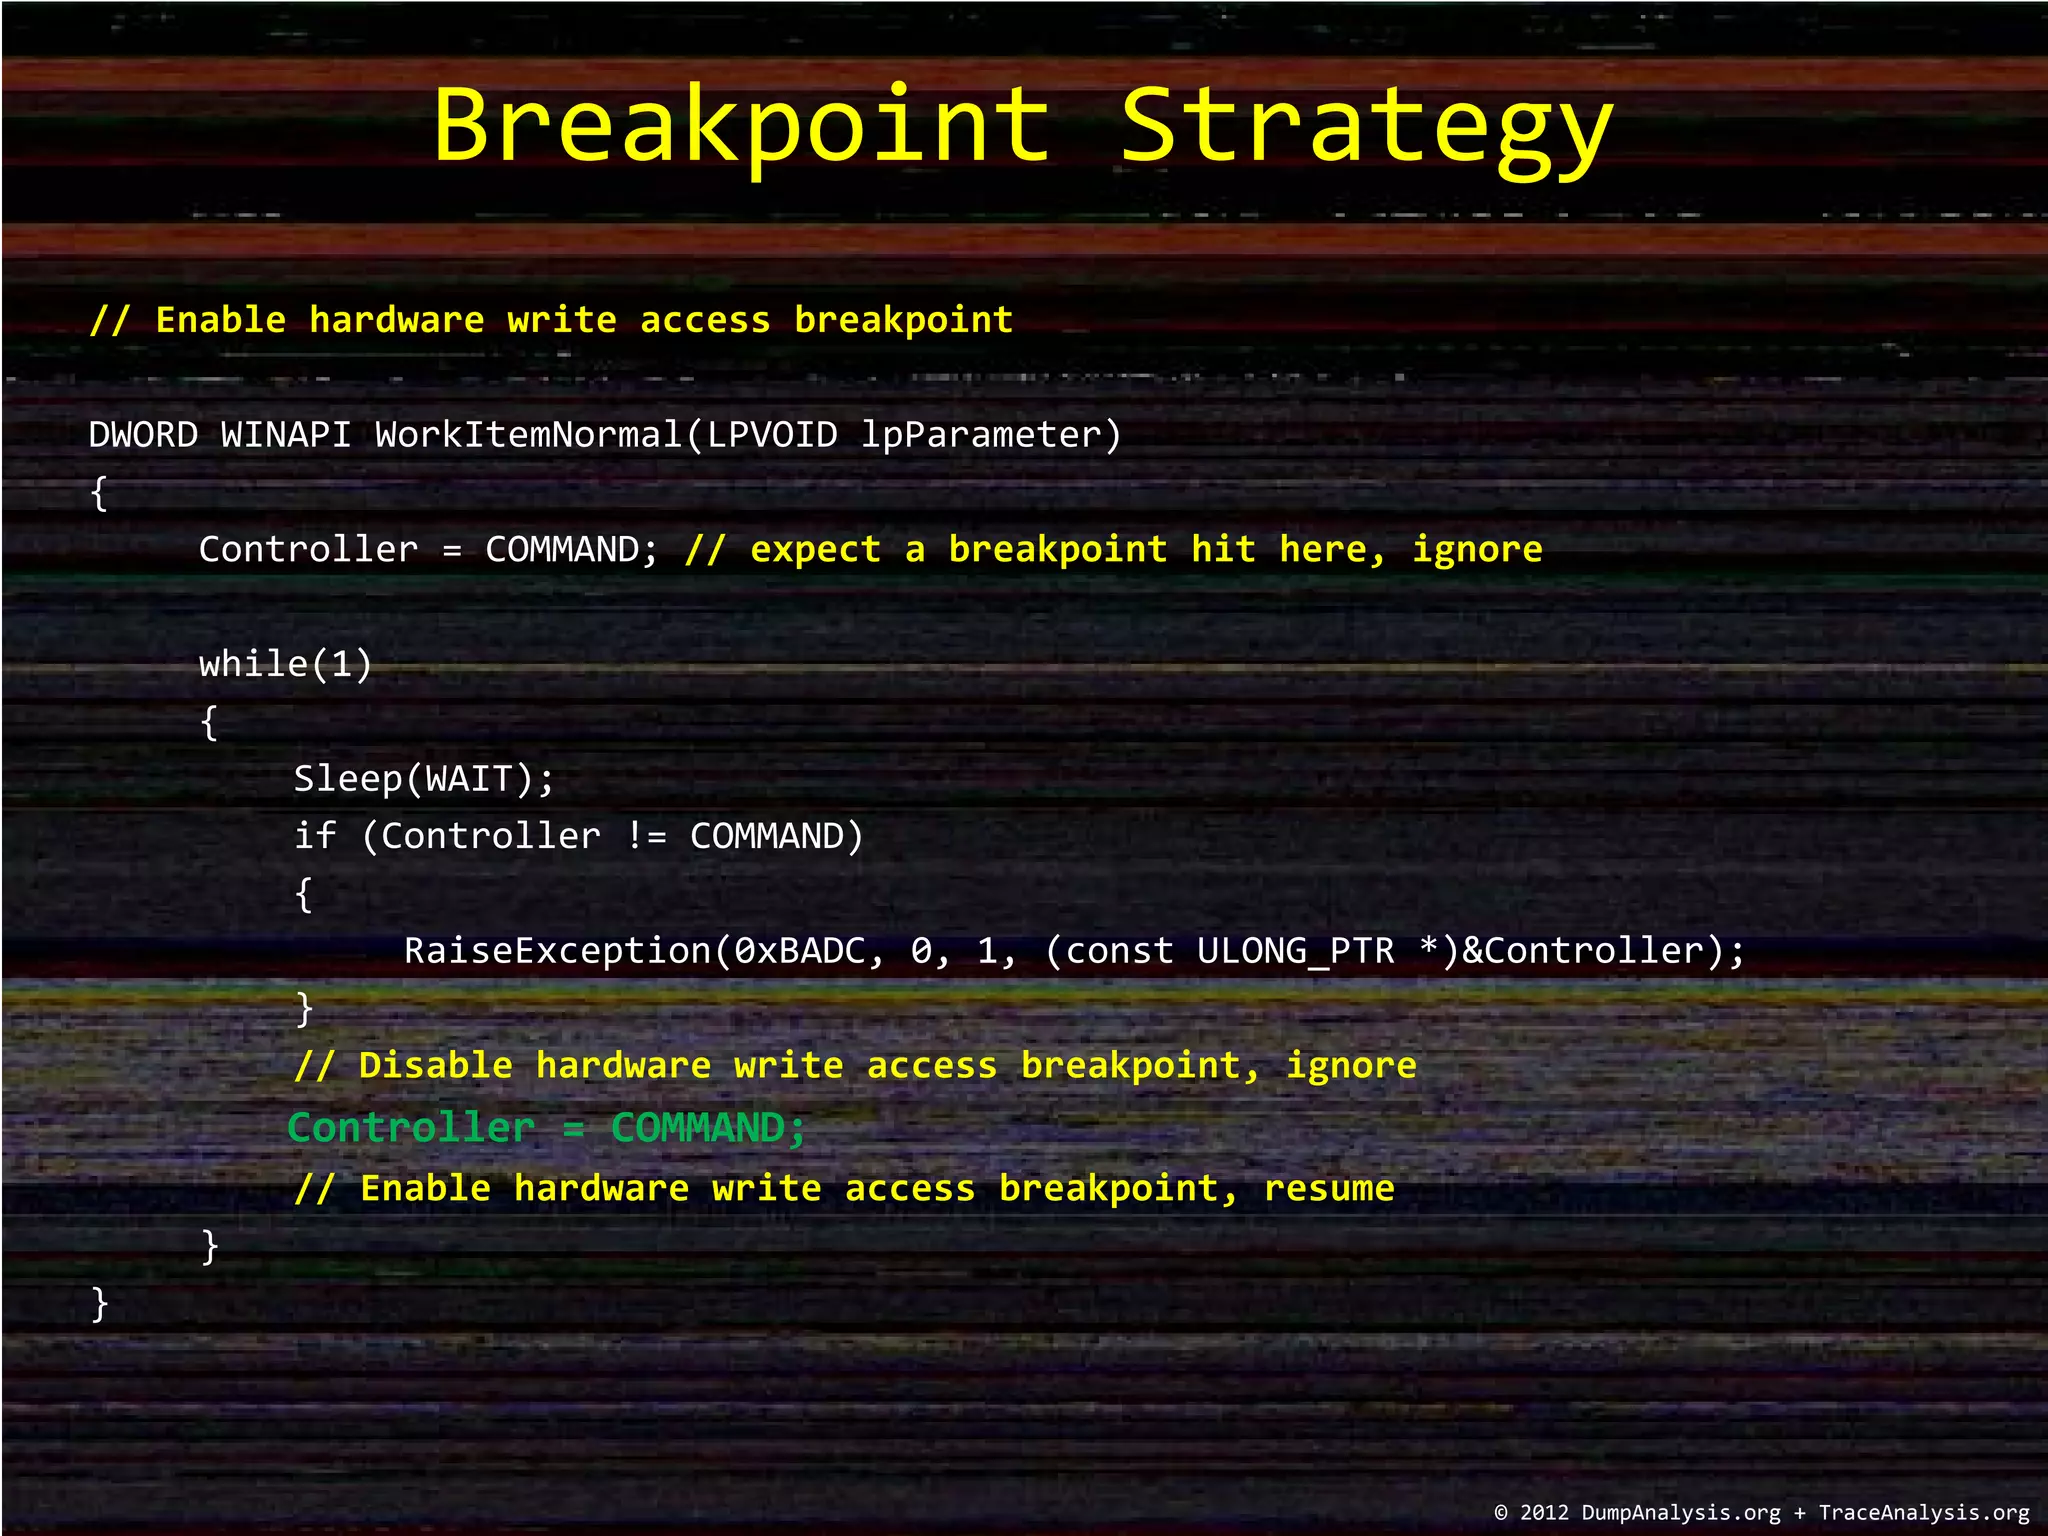
The document discusses debugging strategies for data corruption in software, highlighting the use of hardware and software breakpoints. It includes code examples for setting hardware write access breakpoints, raising exceptions, and managing commands to a controller in memory. Additionally, it provides commands for debugging along with a training schedule for various memory dump analysis courses offered in 2012.


![[Ruxcon 2011] Post Memory Corruption Memory Analysis](https://cdn.slidesharecdn.com/ss_thumbnails/ruxcon-111127233040-phpapp02-thumbnail.jpg?width=640&height=640&fit=bounds)