

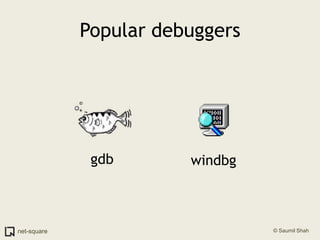

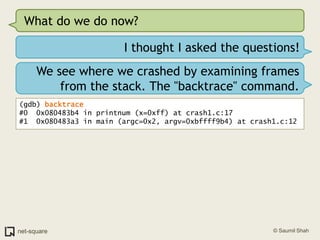
![crash1.cint main(int argc, char *argv[]){ int number; int *pointer; number = atoi(argv[1]); pointer = number; printnum(pointer);}void printnum(int *x){ printf("The number supplied is %d\n", *x);}](https://image.slidesharecdn.com/debuggers-110509142758-phpapp01/85/Introduction-to-Debuggers-14-320.jpg)
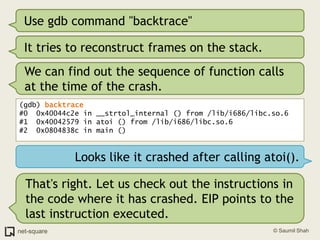
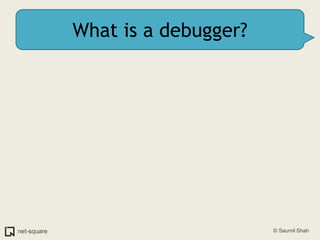
!["x" to examine memory(gdb) x/10i $eip=> 0x40044c2e: movzx ecx,BYTE PTR [edi] 0x40044c31: mov eax,DWORD PTR [esi] 0x40044c33: movsx edx,cl 0x40044c36: movzx eax,WORD PTR [eax+edx*2] 0x40044c3a: and eax,0x2000 0x40044c3f: test ax,ax](https://image.slidesharecdn.com/debuggers-110509142758-phpapp01/85/Introduction-to-Debuggers-38-320.jpg)
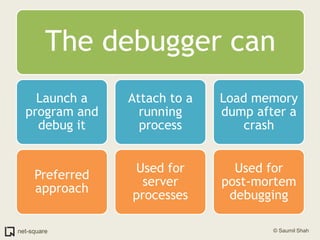
!["x" to examine memory(gdb) x/10i $eip=> 0x40044c2e: movzx ecx,BYTE PTR [edi] 0x40044c31: mov eax,DWORD PTR [esi] 0x40044c33: movsx edx,cl 0x40044c36: movzx eax,WORD PTR [eax+edx*2] 0x40044c3a: and eax,0x2000 0x40044c3f: test ax,axSo what is x/10i ?](https://image.slidesharecdn.com/debuggers-110509142758-phpapp01/85/Introduction-to-Debuggers-39-320.jpg)
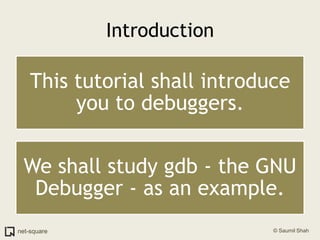
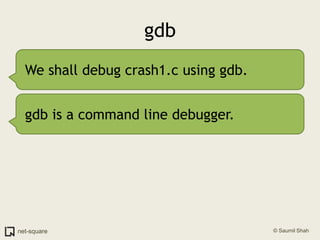
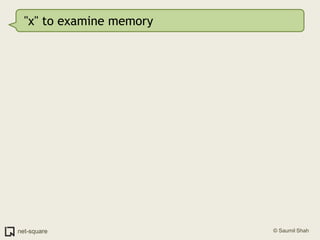
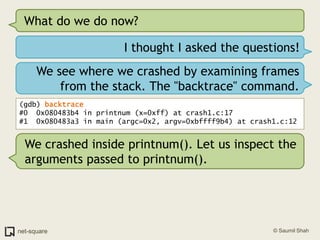
!["x" to examine memory(gdb) x/10i $eip=> 0x40044c2e: movzx ecx,BYTE PTR [edi] 0x40044c31: mov eax,DWORD PTR [esi] 0x40044c33: movsx edx,cl 0x40044c36: movzx eax,WORD PTR [eax+edx*2] 0x40044c3a: and eax,0x2000 0x40044c3f: test ax,axSo what is x/10i ?"x" displays memory contents in various formats. "i" is for instructions (disassembly). 10 is the count of instructions to disassemble.Here are some more options for "x"](https://image.slidesharecdn.com/debuggers-110509142758-phpapp01/85/Introduction-to-Debuggers-40-320.jpg)
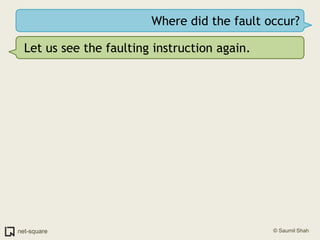
![Where did the fault occur?Let us see the faulting instruction again.(gdb) x/10i $eip=> 0x40044c2e: movzx ecx,BYTE PTR [edi]](https://image.slidesharecdn.com/debuggers-110509142758-phpapp01/85/Introduction-to-Debuggers-44-320.jpg)
![Where did the fault occur?Let us see the faulting instruction again.(gdb) x/10i $eip=> 0x40044c2e: movzx ecx,BYTE PTR [edi]movzx ecx, byte ptr [edi] takes the byte at memory address stored within EDI and copies it into the ECX register.](https://image.slidesharecdn.com/debuggers-110509142758-phpapp01/85/Introduction-to-Debuggers-45-320.jpg)
![Where did the fault occur?Let us see the faulting instruction again.(gdb) x/10i $eip=> 0x40044c2e: movzx ecx,BYTE PTR [edi]movzx ecx, byte ptr [edi] takes the byte at memory address stored within EDI and copies it into the ECX register.I see no apparent error here.](https://image.slidesharecdn.com/debuggers-110509142758-phpapp01/85/Introduction-to-Debuggers-46-320.jpg)
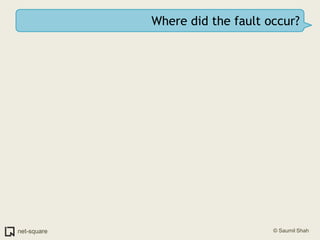
![Where did the fault occur?Let us see the faulting instruction again.(gdb) x/10i $eip=> 0x40044c2e: movzx ecx,BYTE PTR [edi]movzx ecx, byte ptr [edi] takes the byte at memory address stored within EDI and copies it into the ECX register.I see no apparent error here.It depends on where EDI points to. Let us inspect the registers.](https://image.slidesharecdn.com/debuggers-110509142758-phpapp01/85/Introduction-to-Debuggers-47-320.jpg)
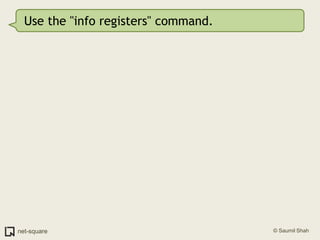
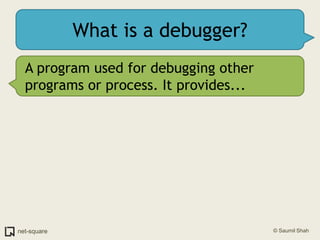
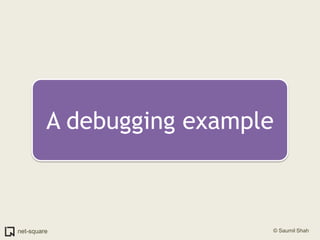
![Use the "info registers" command.(gdb) info registerseax 0x40136660 0x40136660ecx 0x0 0x0edx 0x0 0x0ebx 0x40148f50 0x40148f50esp 0xbffff8d0 0xbffff8d0ebp 0xbffff928 0xbffff928esi 0x4014b8b8 0x4014b8b8edi 0x0 0x0eip 0x40044c2e 0x40044c2e <__strtol_internal+142>eflags 0x10206 [ PF IF RF ]](https://image.slidesharecdn.com/debuggers-110509142758-phpapp01/85/Introduction-to-Debuggers-49-320.jpg)
![Use the "info registers" command.(gdb) info registerseax 0x40136660 0x40136660ecx 0x0 0x0edx 0x0 0x0ebx 0x40148f50 0x40148f50esp 0xbffff8d0 0xbffff8d0ebp 0xbffff928 0xbffff928esi 0x4014b8b8 0x4014b8b8edi 0x0 0x0eip 0x40044c2e 0x40044c2e <__strtol_internal+142>eflags 0x10206 [ PF IF RF ]I see that EDI is 0.](https://image.slidesharecdn.com/debuggers-110509142758-phpapp01/85/Introduction-to-Debuggers-50-320.jpg)
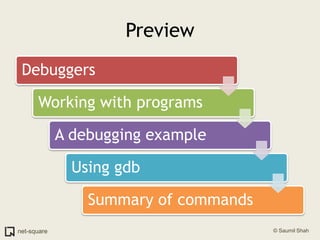
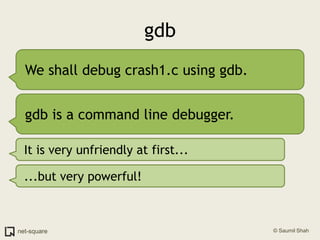
![Use the "info registers" command.(gdb) info registerseax 0x40136660 0x40136660ecx 0x0 0x0edx 0x0 0x0ebx 0x40148f50 0x40148f50esp 0xbffff8d0 0xbffff8d0ebp 0xbffff928 0xbffff928esi 0x4014b8b8 0x4014b8b8edi 0x0 0x0eip 0x40044c2e 0x40044c2e <__strtol_internal+142>eflags 0x10206 [ PF IF RF ]I see that EDI is 0.EDI is a NULL pointer. It points to non-existent memory. Hence the crash.](https://image.slidesharecdn.com/debuggers-110509142758-phpapp01/85/Introduction-to-Debuggers-51-320.jpg)
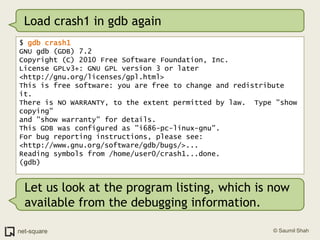
![Use gdb's "list" command(gdb) list1 #include <stdio.h>2 3 void printnum(int *x);4 5 int main(int argc, char *argv[])6 {7 int number;8 int *pointer;9 10 number = atoi(argv[1]);](https://image.slidesharecdn.com/debuggers-110509142758-phpapp01/85/Introduction-to-Debuggers-65-320.jpg)
![Use gdb's "list" command(gdb) list1 #include <stdio.h>2 3 void printnum(int *x);4 5 int main(int argc, char *argv[])6 {7 int number;8 int *pointer;9 10 number = atoi(argv[1]);But there are more than 10 lines in this program.](https://image.slidesharecdn.com/debuggers-110509142758-phpapp01/85/Introduction-to-Debuggers-66-320.jpg)
![Use gdb's "list" command(gdb) list1 #include <stdio.h>2 3 void printnum(int *x);4 5 int main(int argc, char *argv[])6 {7 int number;8 int *pointer;9 10 number = atoi(argv[1]);But there are more than 10 lines in this program.Press Enter on a blank gdb prompt to get another screenful of program listing.](https://image.slidesharecdn.com/debuggers-110509142758-phpapp01/85/Introduction-to-Debuggers-67-320.jpg)
![RecapWe know that the program crashed when executing atoi(argv[1]).](https://image.slidesharecdn.com/debuggers-110509142758-phpapp01/85/Introduction-to-Debuggers-68-320.jpg)
![RecapWe know that the program crashed when executing atoi(argv[1]).We shall now set a breakpoint at the statement where atoi() is called.](https://image.slidesharecdn.com/debuggers-110509142758-phpapp01/85/Introduction-to-Debuggers-69-320.jpg)
![RecapWe know that the program crashed when executing atoi(argv[1]).We shall now set a breakpoint at the statement where atoi() is called.atoi() is called in line #10:7 int number;8 int *pointer;9 10 number = atoi(argv[1]);](https://image.slidesharecdn.com/debuggers-110509142758-phpapp01/85/Introduction-to-Debuggers-70-320.jpg)
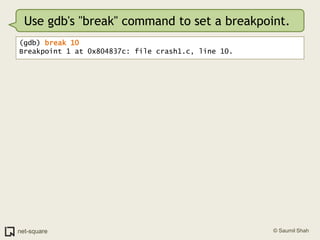
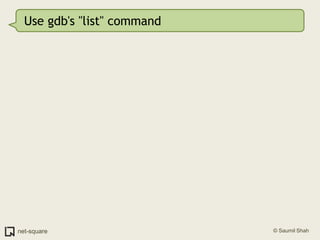
![Use gdb's "break" command to set a breakpoint.(gdb) break 10Breakpoint 1 at 0x804837c: file crash1.c, line 10.Now let us run the program.(gdb) runStarting program: /home/user0/crash1 Breakpoint 1, main (argc=0x1, argv=0xbffff9b4) at crash1.c:1010 number = atoi(argv[1]);](https://image.slidesharecdn.com/debuggers-110509142758-phpapp01/85/Introduction-to-Debuggers-74-320.jpg)
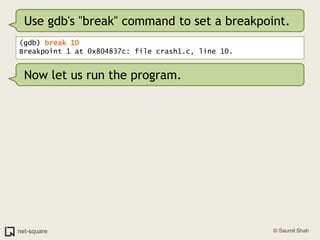
![Use gdb's "break" command to set a breakpoint.(gdb) break 10Breakpoint 1 at 0x804837c: file crash1.c, line 10.Now let us run the program.(gdb) runStarting program: /home/user0/crash1 Breakpoint 1, main (argc=0x1, argv=0xbffff9b4) at crash1.c:1010 number = atoi(argv[1]);Process execution is suspended when it reaches the breakpoint. Control is transferred to gdb.](https://image.slidesharecdn.com/debuggers-110509142758-phpapp01/85/Introduction-to-Debuggers-75-320.jpg)
![Use gdb's "break" command to set a breakpoint.(gdb) break 10Breakpoint 1 at 0x804837c: file crash1.c, line 10.Now let us run the program.(gdb) runStarting program: /home/user0/crash1 Breakpoint 1, main (argc=0x1, argv=0xbffff9b4) at crash1.c:1010 number = atoi(argv[1]);Process execution is suspended when it reaches the breakpoint. Control is transferred to gdb.Let us now look at argv[1]. gdb will now allow us to inspect variables symbolically.](https://image.slidesharecdn.com/debuggers-110509142758-phpapp01/85/Introduction-to-Debuggers-76-320.jpg)
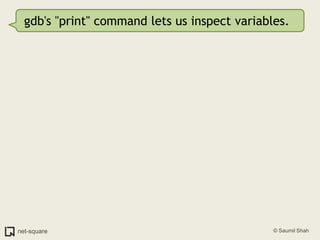
![gdb's "print" command lets us inspect variables.(gdb) print argv[1]$1 = 0x0](https://image.slidesharecdn.com/debuggers-110509142758-phpapp01/85/Introduction-to-Debuggers-78-320.jpg)
![gdb's "print" command lets us inspect variables.(gdb) print argv[1]$1 = 0x0argv[1] is the culprit NULL pointer! This is what gets loaded into the EDI register (remember?)](https://image.slidesharecdn.com/debuggers-110509142758-phpapp01/85/Introduction-to-Debuggers-79-320.jpg)
![gdb's "print" command lets us inspect variables.(gdb) print argv[1]$1 = 0x0argv[1] is the culprit NULL pointer! This is what gets loaded into the EDI register (remember?)Let us continue with the process execution.](https://image.slidesharecdn.com/debuggers-110509142758-phpapp01/85/Introduction-to-Debuggers-80-320.jpg)
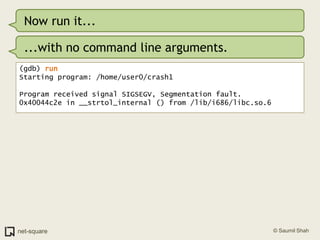
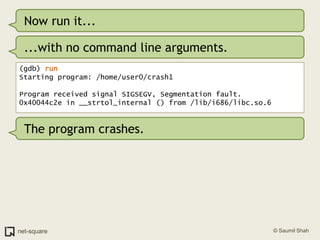
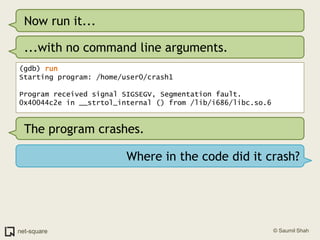
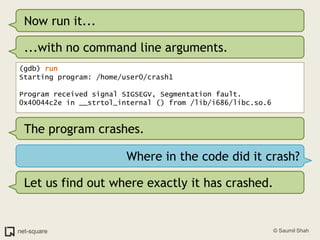
![gdb's "print" command lets us inspect variables.(gdb) print argv[1]$1 = 0x0argv[1] is the culprit NULL pointer! This is what gets loaded into the EDI register (remember?)Let us continue with the process execution.(gdb) continueContinuing.Program received signal SIGSEGV, Segmentation fault.0x40044c2e in __strtol_internal () from /lib/i686/libc.so.6](https://image.slidesharecdn.com/debuggers-110509142758-phpapp01/85/Introduction-to-Debuggers-81-320.jpg)
![gdb's "print" command lets us inspect variables.(gdb) print argv[1]$1 = 0x0argv[1] is the culprit NULL pointer! This is what gets loaded into the EDI register (remember?)Let us continue with the process execution.(gdb) continueContinuing.Program received signal SIGSEGV, Segmentation fault.0x40044c2e in __strtol_internal () from /lib/i686/libc.so.6As expected, here's the segmentation fault. Verify the value of EDI using "info registers" and the disassembly of the crash using "x/10i $eip"](https://image.slidesharecdn.com/debuggers-110509142758-phpapp01/85/Introduction-to-Debuggers-82-320.jpg)
![Bug #1 - Null pointerTo fix this problem the programmer needs to check the number of command line arguments before using argv[1] in the program.](https://image.slidesharecdn.com/debuggers-110509142758-phpapp01/85/Introduction-to-Debuggers-83-320.jpg)
![Bug #1 - Null pointerTo fix this problem the programmer needs to check the number of command line arguments before using argv[1] in the program.For now, we shall run the program with a valid argv[1] supplied.](https://image.slidesharecdn.com/debuggers-110509142758-phpapp01/85/Introduction-to-Debuggers-84-320.jpg)
![Bug #1 - Null pointerTo fix this problem the programmer needs to check the number of command line arguments before using argv[1] in the program.For now, we shall run the program with a valid argv[1] supplied.On to bug #2.Quit gdb and load crash1 again.](https://image.slidesharecdn.com/debuggers-110509142758-phpapp01/85/Introduction-to-Debuggers-85-320.jpg)
![(gdb) frame 0(gdb) x/10i $eip=> 0x80483b4 <printnum+12>: push DWORD PTR [eax] 0x80483b6 <printnum+14>: push 0x8048488 0x80483bb <printnum+19>: call 0x804828c <printf@plt> 0x80483c0 <printnum+24>: add esp,0x10 0x80483c3 <printnum+27>: leave 0x80483c4 <printnum+28>: ret](https://image.slidesharecdn.com/debuggers-110509142758-phpapp01/85/Introduction-to-Debuggers-114-320.jpg)
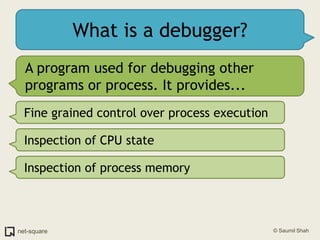
![(gdb) frame 0(gdb) x/10i $eip=> 0x80483b4 <printnum+12>: push DWORD PTR [eax] 0x80483b6 <printnum+14>: push 0x8048488 0x80483bb <printnum+19>: call 0x804828c <printf@plt> 0x80483c0 <printnum+24>: add esp,0x10 0x80483c3 <printnum+27>: leave 0x80483c4 <printnum+28>: ret (gdb) info registerseax 0xff 0xffecx 0x0 0x0edx 0x0 0x0ebx 0x40148f50 0x40148f50esp 0xbffff938 0xbffff938ebp 0xbffff948 0xbffff948esi 0x40012780 0x40012780edi 0xbffff9b4 0xbffff9b4eip 0x80483b4 0x80483b4 <printnum+12>eflags 0x10292 [ AF SF IF RF ]](https://image.slidesharecdn.com/debuggers-110509142758-phpapp01/85/Introduction-to-Debuggers-115-320.jpg)
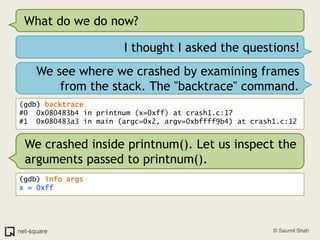
![(gdb) frame 0(gdb) x/10i $eip=> 0x80483b4 <printnum+12>: push DWORD PTR [eax] 0x80483b6 <printnum+14>: push 0x8048488 0x80483bb <printnum+19>: call 0x804828c <printf@plt> 0x80483c0 <printnum+24>: add esp,0x10 0x80483c3 <printnum+27>: leave 0x80483c4 <printnum+28>: ret (gdb) info registerseax 0xff 0xffecx 0x0 0x0edx 0x0 0x0ebx 0x40148f50 0x40148f50esp 0xbffff938 0xbffff938ebp 0xbffff948 0xbffff948esi 0x40012780 0x40012780edi 0xbffff9b4 0xbffff9b4eip 0x80483b4 0x80483b4 <printnum+12>eflags 0x10292 [ AF SF IF RF ]We are trying to push a value whose address is stored in EAX. This address is 0x000000ff.](https://image.slidesharecdn.com/debuggers-110509142758-phpapp01/85/Introduction-to-Debuggers-116-320.jpg)
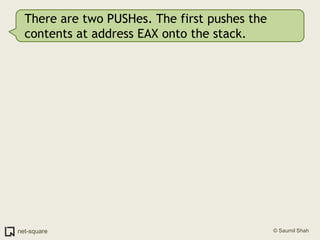
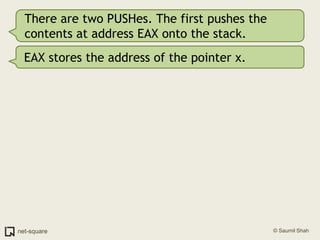
![There are two PUSHes. The first pushes the contents at address EAX onto the stack.EAX stores the address of the pointer x.DWORD PTR [EAX] implies *x (contents at addr x)](https://image.slidesharecdn.com/debuggers-110509142758-phpapp01/85/Introduction-to-Debuggers-119-320.jpg)
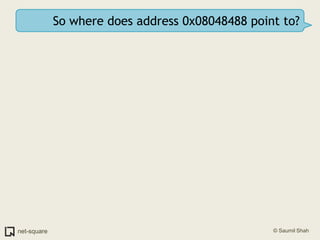
![There are two PUSHes. The first pushes the contents at address EAX onto the stack.EAX stores the address of the pointer x.DWORD PTR [EAX] implies *x (contents at addr x)What does the second PUSH do? push 0x08048488](https://image.slidesharecdn.com/debuggers-110509142758-phpapp01/85/Introduction-to-Debuggers-120-320.jpg)
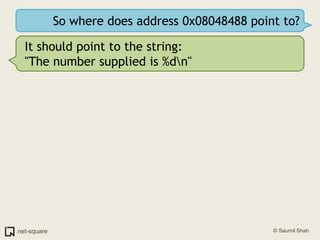
![There are two PUSHes. The first pushes the contents at address EAX onto the stack.EAX stores the address of the pointer x.DWORD PTR [EAX] implies *x (contents at addr x)What does the second PUSH do? push 0x080484880x08048488 looks like a memory address. Notice that the next instruction is a CALL to printf.=> 0x80483b4 <printnum+12>: push DWORD PTR [eax] 0x80483b6 <printnum+14>: push 0x8048488 0x80483bb <printnum+19>: call 0x804828c <printf@plt>](https://image.slidesharecdn.com/debuggers-110509142758-phpapp01/85/Introduction-to-Debuggers-121-320.jpg)
![There are two PUSHes. The first pushes the contents at address EAX onto the stack.EAX stores the address of the pointer x.DWORD PTR [EAX] implies *x (contents at addr x)What does the second PUSH do? push 0x080484880x08048488 looks like a memory address. Notice that the next instruction is a CALL to printf.=> 0x80483b4 <printnum+12>: push DWORD PTR [eax] 0x80483b6 <printnum+14>: push 0x8048488 0x80483bb <printnum+19>: call 0x804828c <printf@plt>The two PUSHes set up the parameters passed to printf().](https://image.slidesharecdn.com/debuggers-110509142758-phpapp01/85/Introduction-to-Debuggers-122-320.jpg)
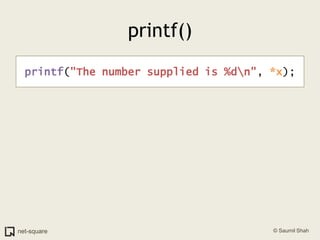
![printf()printf("The number supplied is %d\n", *x); push DWORD PTR [eax]](https://image.slidesharecdn.com/debuggers-110509142758-phpapp01/85/Introduction-to-Debuggers-124-320.jpg)
![printf()printf("The number supplied is %d\n", *x); push DWORD PTR [eax] push 0x8048488](https://image.slidesharecdn.com/debuggers-110509142758-phpapp01/85/Introduction-to-Debuggers-125-320.jpg)
![printf()printf("The number supplied is %d\n", *x); push DWORD PTR [eax] push 0x8048488 call 0x804828c](https://image.slidesharecdn.com/debuggers-110509142758-phpapp01/85/Introduction-to-Debuggers-126-320.jpg)
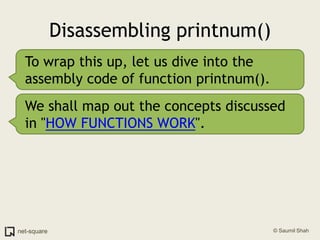
![printf()printf("The number supplied is %d\n", *x); push DWORD PTR [eax] push 0x8048488 call 0x804828cRemember our discussion in the tutorial"HOW FUNCTIONS WORK?"](https://image.slidesharecdn.com/debuggers-110509142758-phpapp01/85/Introduction-to-Debuggers-127-320.jpg)
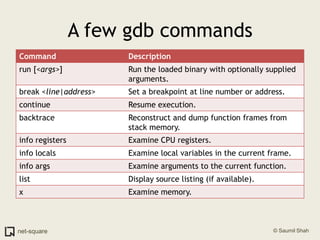
![Use the "disassemble" command(gdb) disassemble printnumDump of assembler code for function printnum: 0x080483a8 <+0>: push ebp 0x080483a9 <+1>: mov ebp,esp 0x080483ab <+3>: sub esp,0x8 0x080483ae <+6>: sub esp,0x8 0x080483b1 <+9>: mov eax,DWORD PTR [ebp+0x8]=> 0x080483b4 <+12>: push DWORD PTR [eax] 0x080483b6 <+14>: push 0x8048488 0x080483bb <+19>: call 0x804828c <printf@plt> 0x080483c0 <+24>: add esp,0x10 0x080483c3 <+27>: leave 0x080483c4 <+28>: ret End of assembler dump.](https://image.slidesharecdn.com/debuggers-110509142758-phpapp01/85/Introduction-to-Debuggers-134-320.jpg)
![Use the "disassemble" command(gdb) disassemble printnumDump of assembler code for function printnum: 0x080483a8 <+0>: push ebp 0x080483a9 <+1>: mov ebp,esp 0x080483ab <+3>: sub esp,0x8 0x080483ae <+6>: sub esp,0x8 0x080483b1 <+9>: mov eax,DWORD PTR [ebp+0x8]=> 0x080483b4 <+12>: push DWORD PTR [eax] 0x080483b6 <+14>: push 0x8048488 0x080483bb <+19>: call 0x804828c <printf@plt> 0x080483c0 <+24>: add esp,0x10 0x080483c3 <+27>: leave 0x080483c4 <+28>: ret End of assembler dump.Let us map this disassembly to the various components of a function.](https://image.slidesharecdn.com/debuggers-110509142758-phpapp01/85/Introduction-to-Debuggers-135-320.jpg)
![printnum() disassemblyPrologue push ebp mov ebp,esp sub esp,0x8 sub esp,0x8 mov eax,DWORD PTR [ebp+0x8] push DWORD PTR [eax] push 0x8048488 call 0x804828c <printf@plt> add esp,0x10 leave ret BodyEpilogueReturn](https://image.slidesharecdn.com/debuggers-110509142758-phpapp01/85/Introduction-to-Debuggers-136-320.jpg)
![printnum() disassemblyPrologue push ebp mov ebp,esp sub esp,0x8 sub esp,0x8 mov eax,DWORD PTR [ebp+0x8]> push DWORD PTR [eax] push 0x8048488 call 0x804828c <printf@plt> add esp,0x10 leave ret BodyEpilogueReturnCrash occurs at "push dword ptr [eax]".](https://image.slidesharecdn.com/debuggers-110509142758-phpapp01/85/Introduction-to-Debuggers-137-320.jpg)
![printnum() disassemblyPrologue push ebp mov ebp,esp sub esp,0x8 sub esp,0x8 mov eax,DWORD PTR [ebp+0x8]> push DWORD PTR [eax] push 0x8048488 call 0x804828c <printf@plt> add esp,0x10 leave ret BodyEpilogueReturnCrash occurs at "push dword ptr [eax]".Let us see how the stack is built up.](https://image.slidesharecdn.com/debuggers-110509142758-phpapp01/85/Introduction-to-Debuggers-138-320.jpg)
![Before printnum() is called push ebp mov ebp,esp sub esp,0x8 sub esp,0x8 mov eax,DWORD PTR [ebp+0x8] push DWORD PTR [eax] push 0x8048488 call 0x804828c <printf@plt> add esp,0x10 leave ret Pointer x is pushed on the stack...0x000000ffESP...EBP](https://image.slidesharecdn.com/debuggers-110509142758-phpapp01/85/Introduction-to-Debuggers-139-320.jpg)
![Before printnum() is called> push ebp mov ebp,esp sub esp,0x8 sub esp,0x8 mov eax,DWORD PTR [ebp+0x8] push DWORD PTR [eax] push 0x8048488 call 0x804828c <printf@plt> add esp,0x10 leave ret ...and printnum is CALLed.Saved EIPESP0x000000ffparam 1...EBP](https://image.slidesharecdn.com/debuggers-110509142758-phpapp01/85/Introduction-to-Debuggers-140-320.jpg)
![Prologuepush ebp> mov ebp,esp sub esp,0x8 sub esp,0x8 mov eax,DWORD PTR [ebp+0x8] push DWORD PTR [eax] push 0x8048488 call 0x804828c <printf@plt> add esp,0x10 leave ret Old EBPESPSave the old frame pointer.Saved EIP0x000000ffparam 1...EBP](https://image.slidesharecdn.com/debuggers-110509142758-phpapp01/85/Introduction-to-Debuggers-141-320.jpg)
![Prologuepush ebpmov ebp,esp> sub esp,0x8 sub esp,0x8 mov eax,DWORD PTR [ebp+0x8] push DWORD PTR [eax] push 0x8048488 call 0x804828c <printf@plt> add esp,0x10 leave ret Old EBPEBPESPSet the EBP to the current frame.Saved EIP0x000000ffparam 1...](https://image.slidesharecdn.com/debuggers-110509142758-phpapp01/85/Introduction-to-Debuggers-142-320.jpg)
![Prologuepush ebpmov ebp,esp sub esp,0x8 sub esp,0x8> mov eax,DWORD PTR [ebp+0x8] push DWORD PTR [eax] push 0x8048488 call 0x804828c <printf@plt> add esp,0x10 leave ret ...ESP.........Old EBPEBPLeave some space on the stack (16 bytes)Saved EIP0x000000ffparam 1...](https://image.slidesharecdn.com/debuggers-110509142758-phpapp01/85/Introduction-to-Debuggers-143-320.jpg)
![Bodypush ebpmov ebp,esp sub esp,0x8 sub esp,0x8mov eax,DWORD PTR [ebp+0x8]> push DWORD PTR [eax] push 0x8048488 call 0x804828c <printf@plt> add esp,0x10 leave ret ...ESP.........Old EBPEBPEAX = 0x000000ffSaved EIP0x000000ffparam 1...](https://image.slidesharecdn.com/debuggers-110509142758-phpapp01/85/Introduction-to-Debuggers-144-320.jpg)
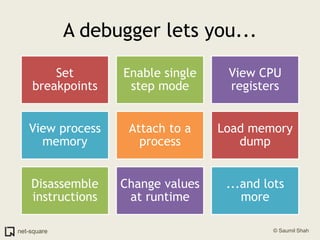
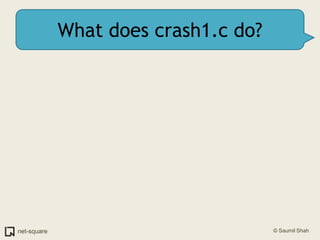
![Segmentation Fault!push ebpmov ebp,esp sub esp,0x8 sub esp,0x8mov eax,DWORD PTR [ebp+0x8]>push DWORD PTR [eax] push 0x8048488 call 0x804828c <printf@plt> add esp,0x10 leave ret ...ESP.........Old EBPEBPMemory at 0x000000ff cannot be referenced.Saved EIP0x000000ffparam 1...](https://image.slidesharecdn.com/debuggers-110509142758-phpapp01/85/Introduction-to-Debuggers-145-320.jpg)
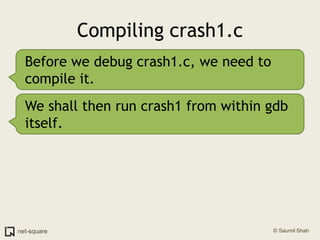
![Segmentation Fault!push ebpmov ebp,esp sub esp,0x8 sub esp,0x8mov eax,DWORD PTR [ebp+0x8]>push DWORD PTR [eax] push 0x8048488 call 0x804828c <printf@plt> add esp,0x10 leave ret ...ESP.........Old EBPEBPMemory at 0x000000ff cannot be referenced.Saved EIP0x000000ffparam 1What will stack memory contain at this moment?...](https://image.slidesharecdn.com/debuggers-110509142758-phpapp01/85/Introduction-to-Debuggers-146-320.jpg)


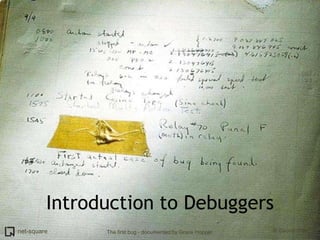
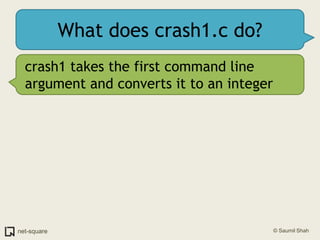
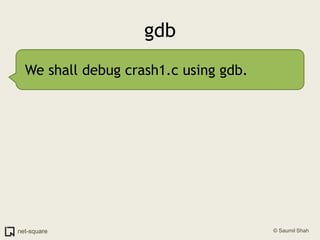
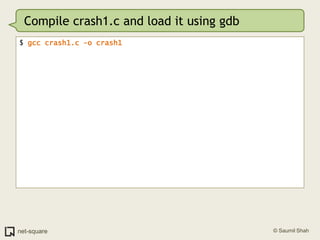
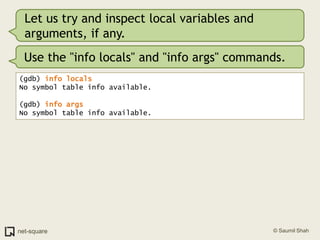
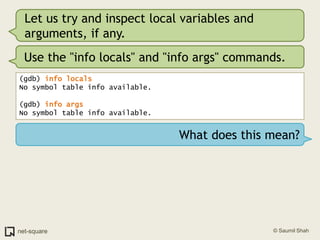
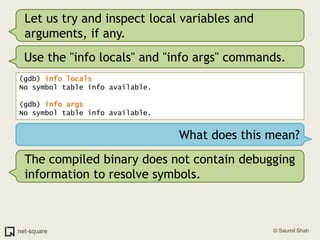
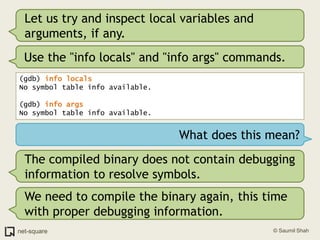
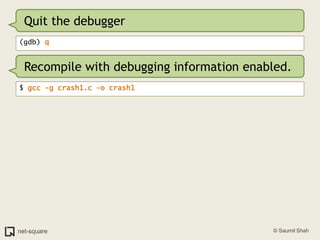
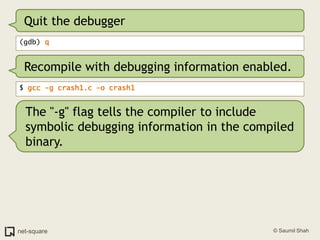
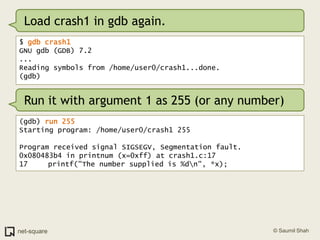
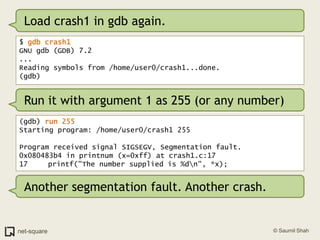
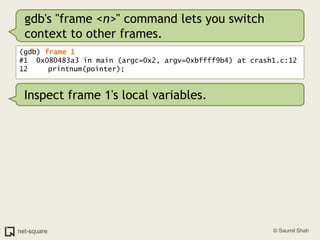
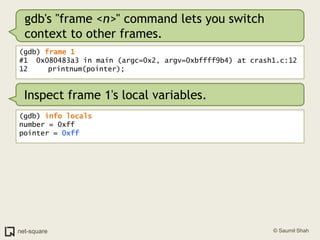
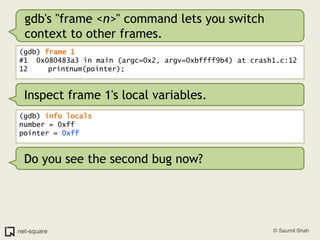
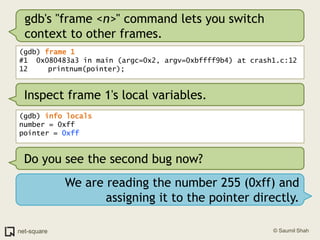
The document provides an introduction to debuggers, focusing on using gdb to debug a simple C program called crash1.c that has two bugs. It explains how to compile the program with debugging information, run it in gdb, and diagnose the segmentation fault that occurs when the program is executed without command line arguments. The guide details the use of various gdb commands to inspect the state of the program and locate errors, emphasizing the importance of proper compilation for effective debugging.


![Getting Started with Apache Spark: Big Data Made Simple [Free Meetup]](https://cdn.slidesharecdn.com/ss_thumbnails/apachesparkgettingstarted-260203175547-8361bcc3-thumbnail.jpg?width=640&height=640&fit=bounds)


