Download as PDF, PPTX
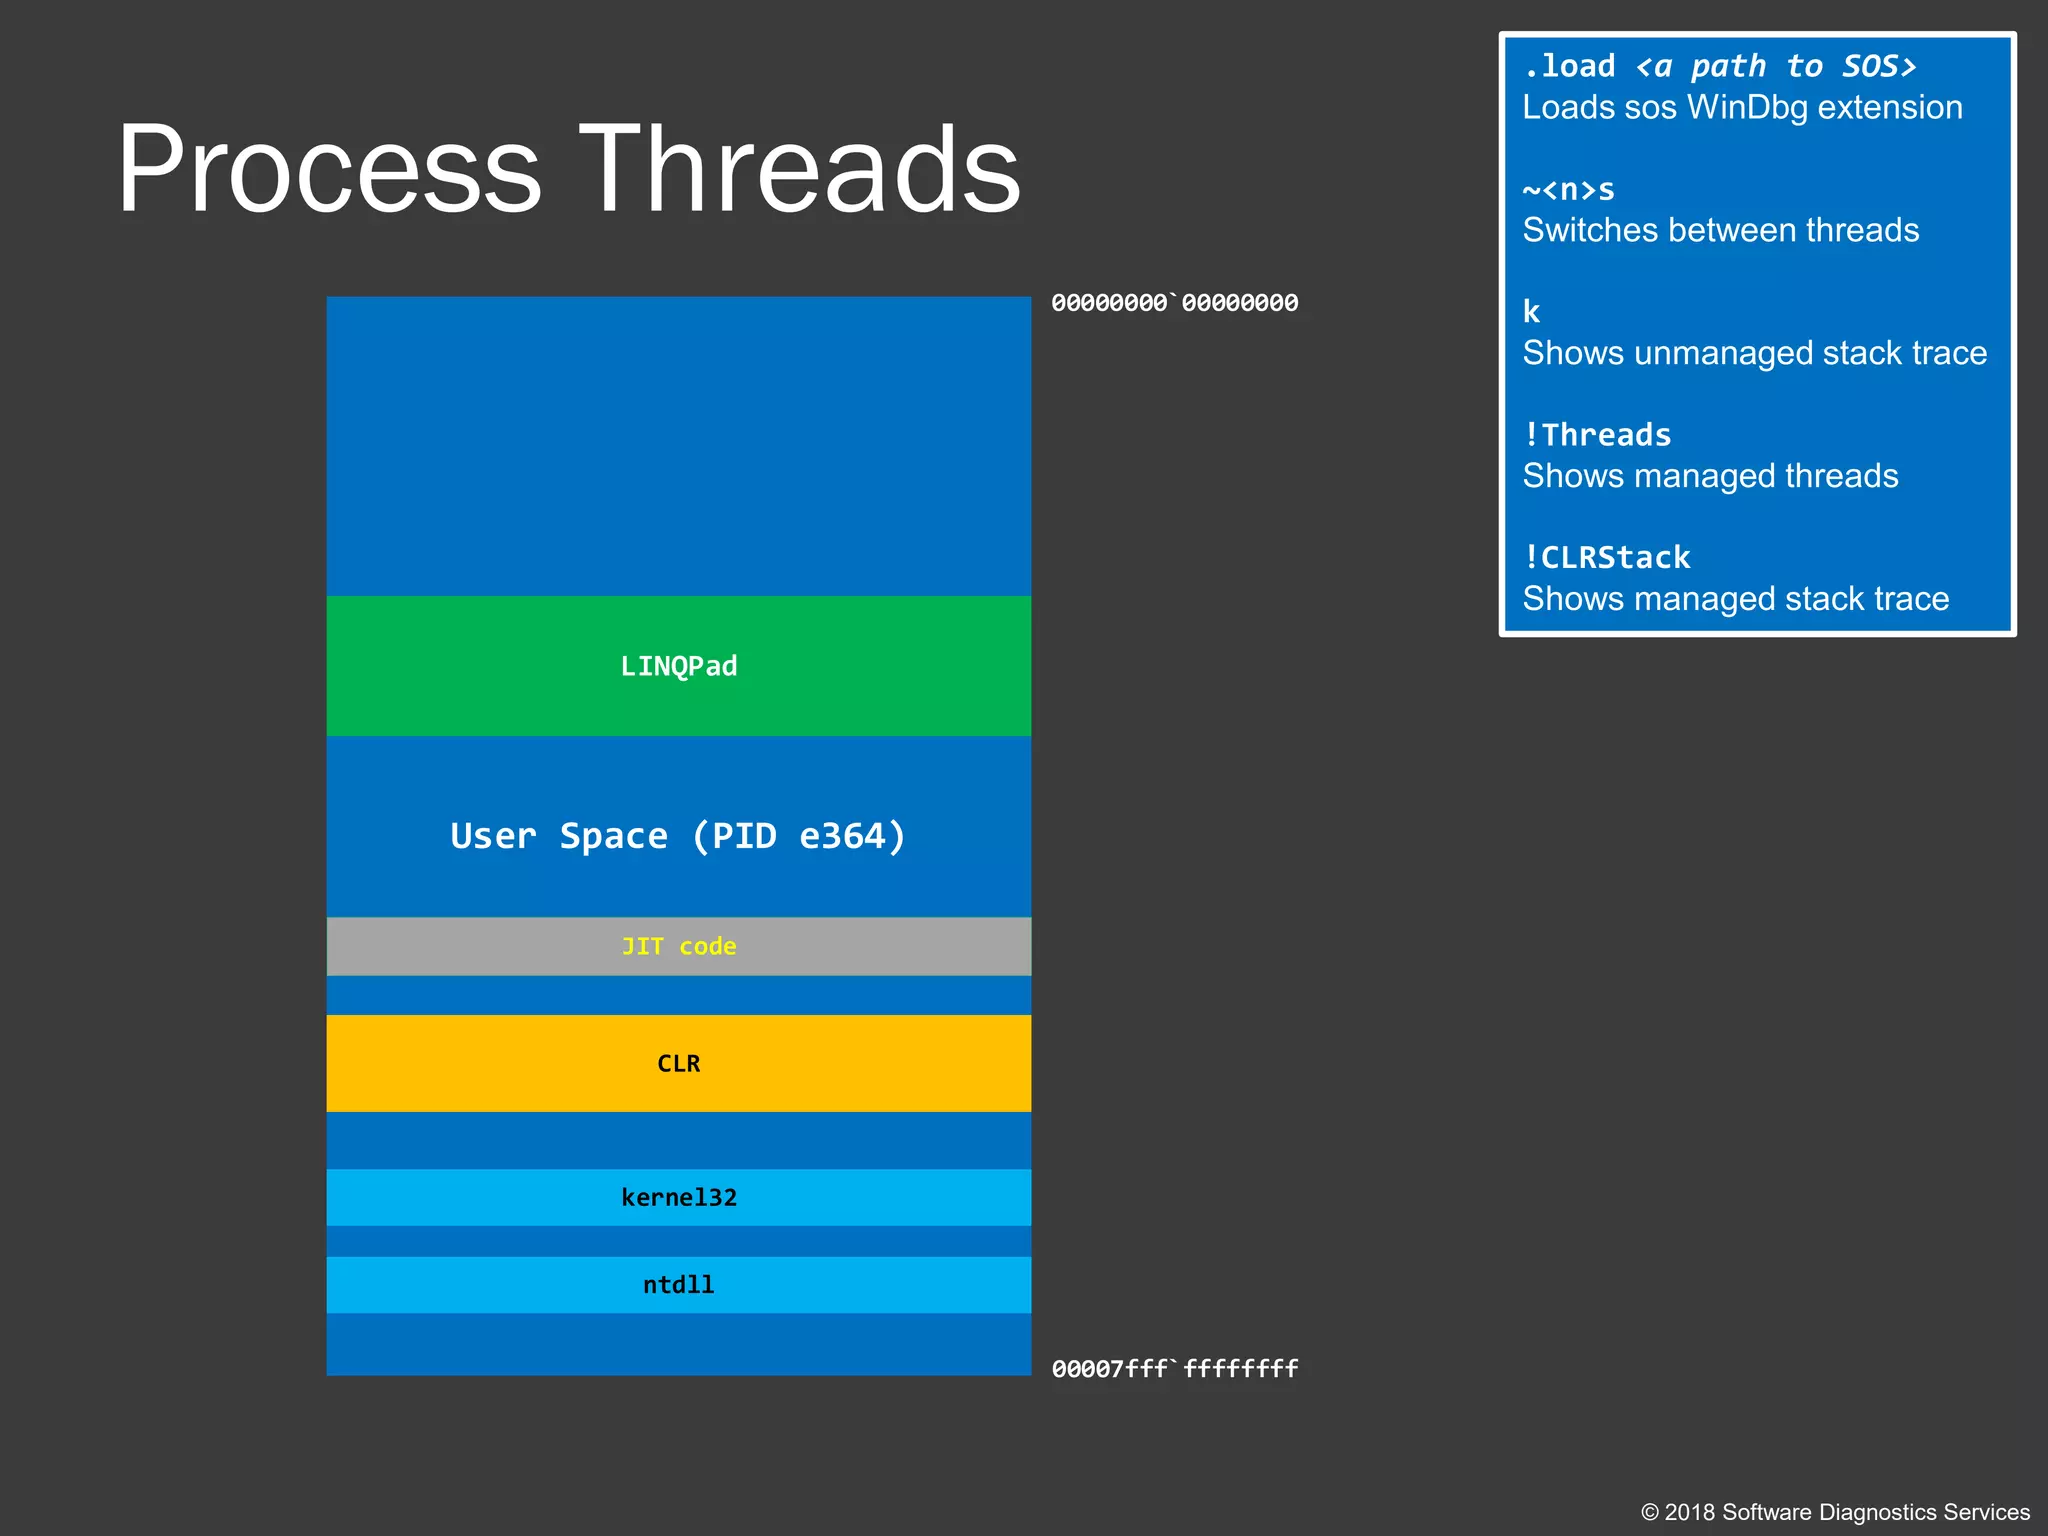
![Thread Raw Stack Data
© 2018 Software Diagnostics Services
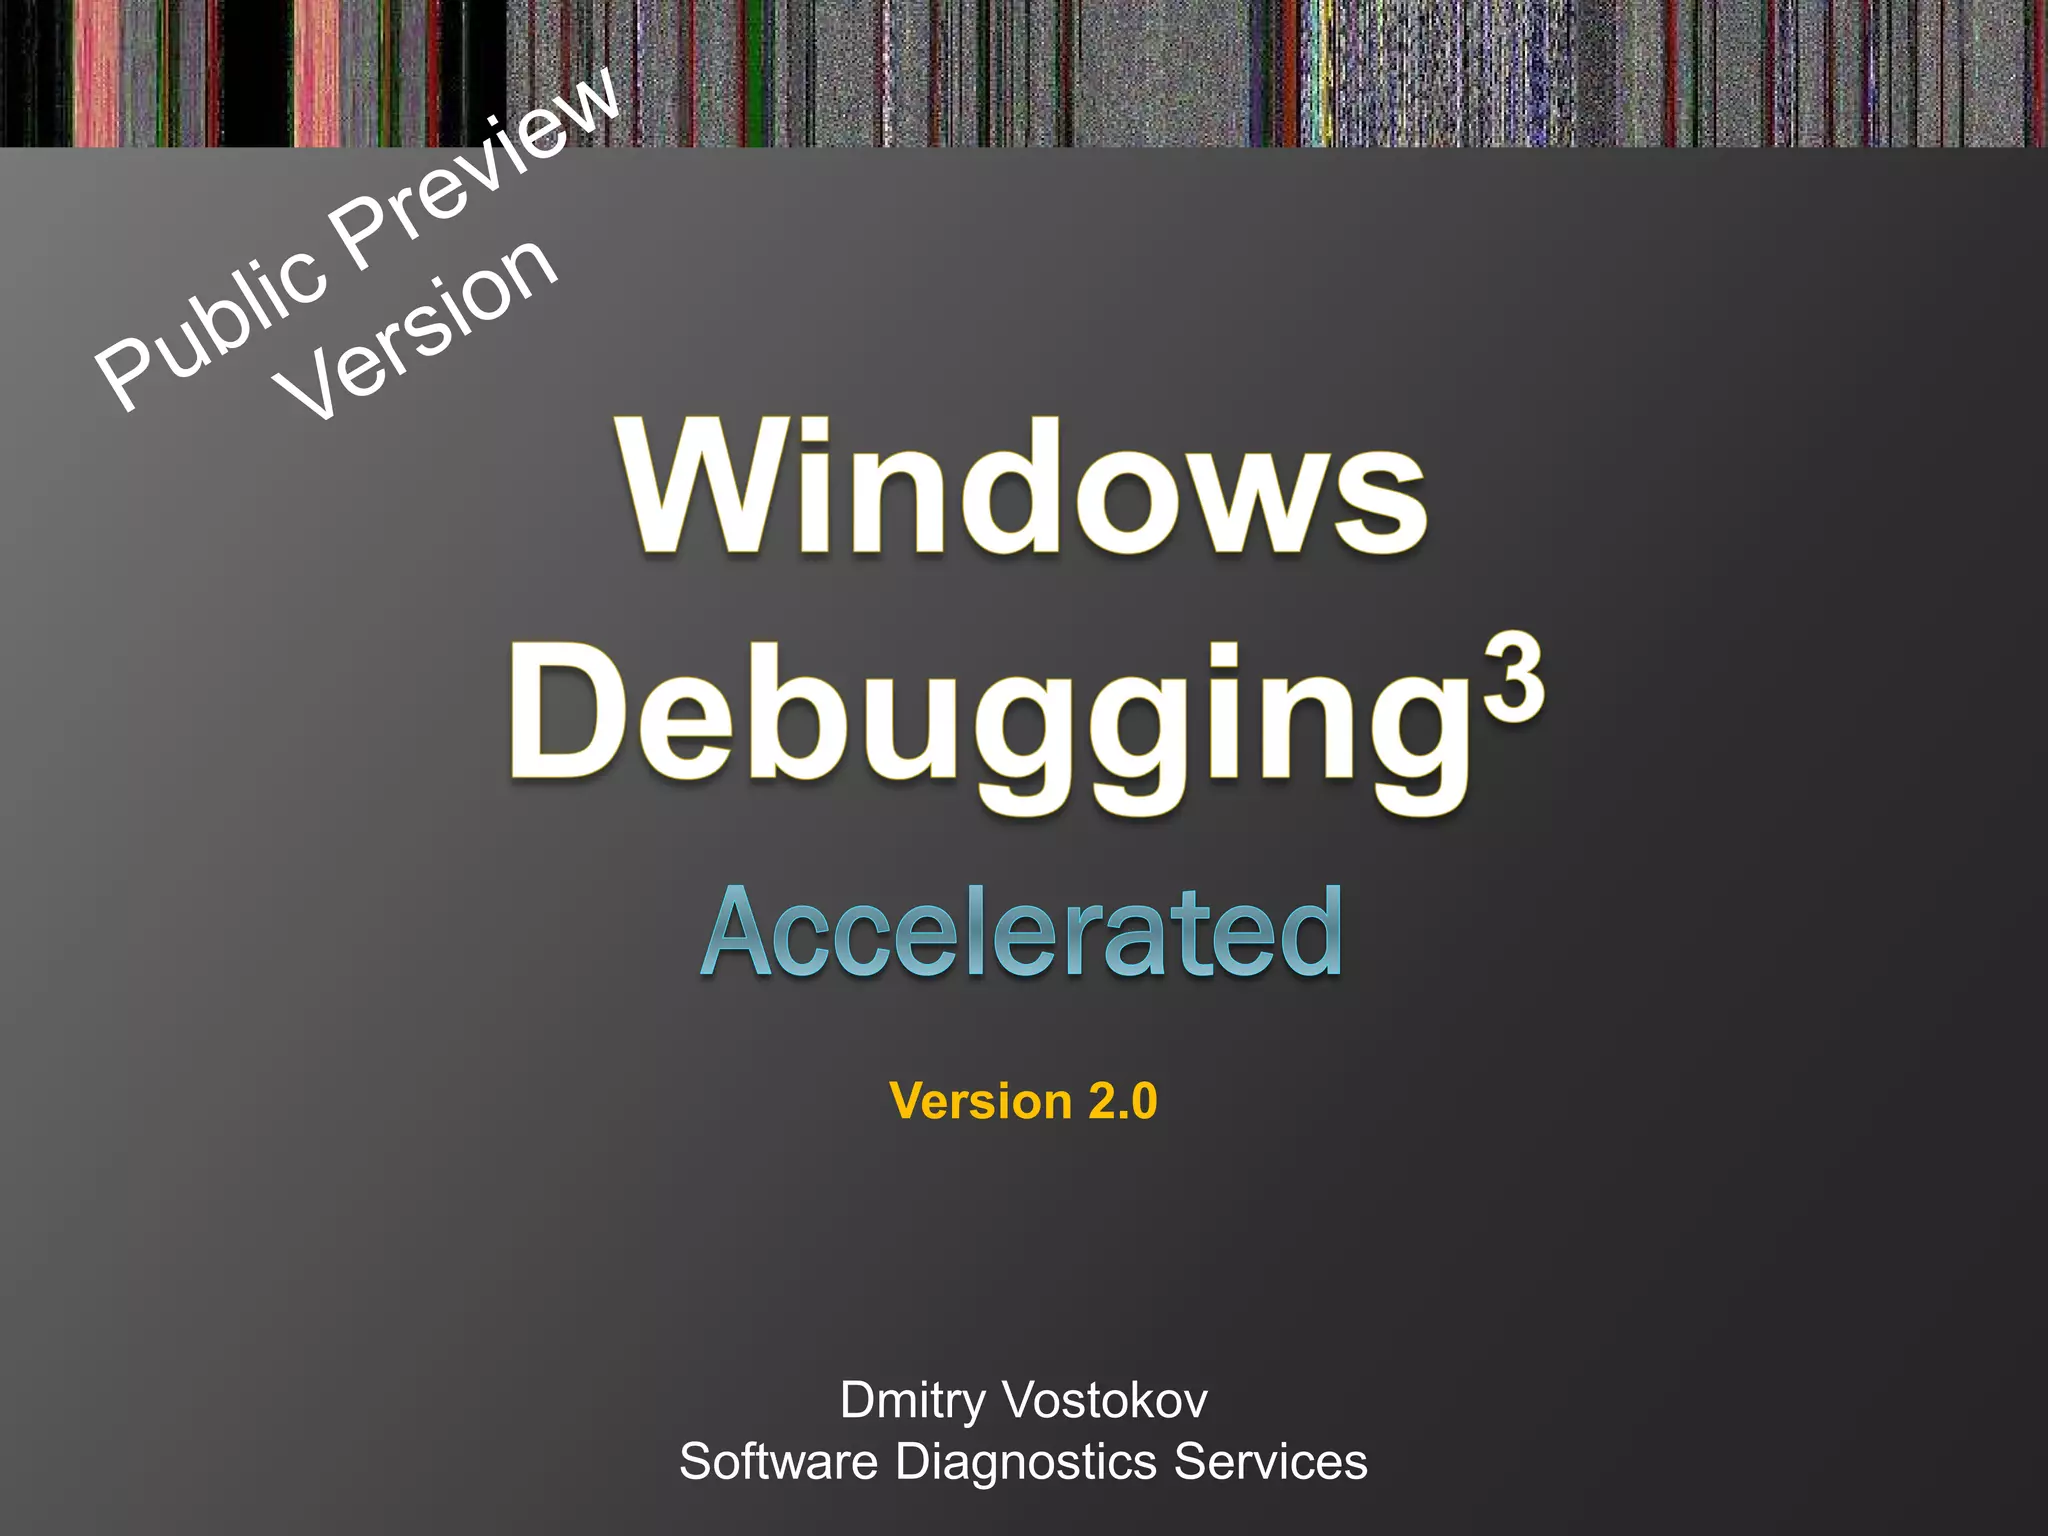
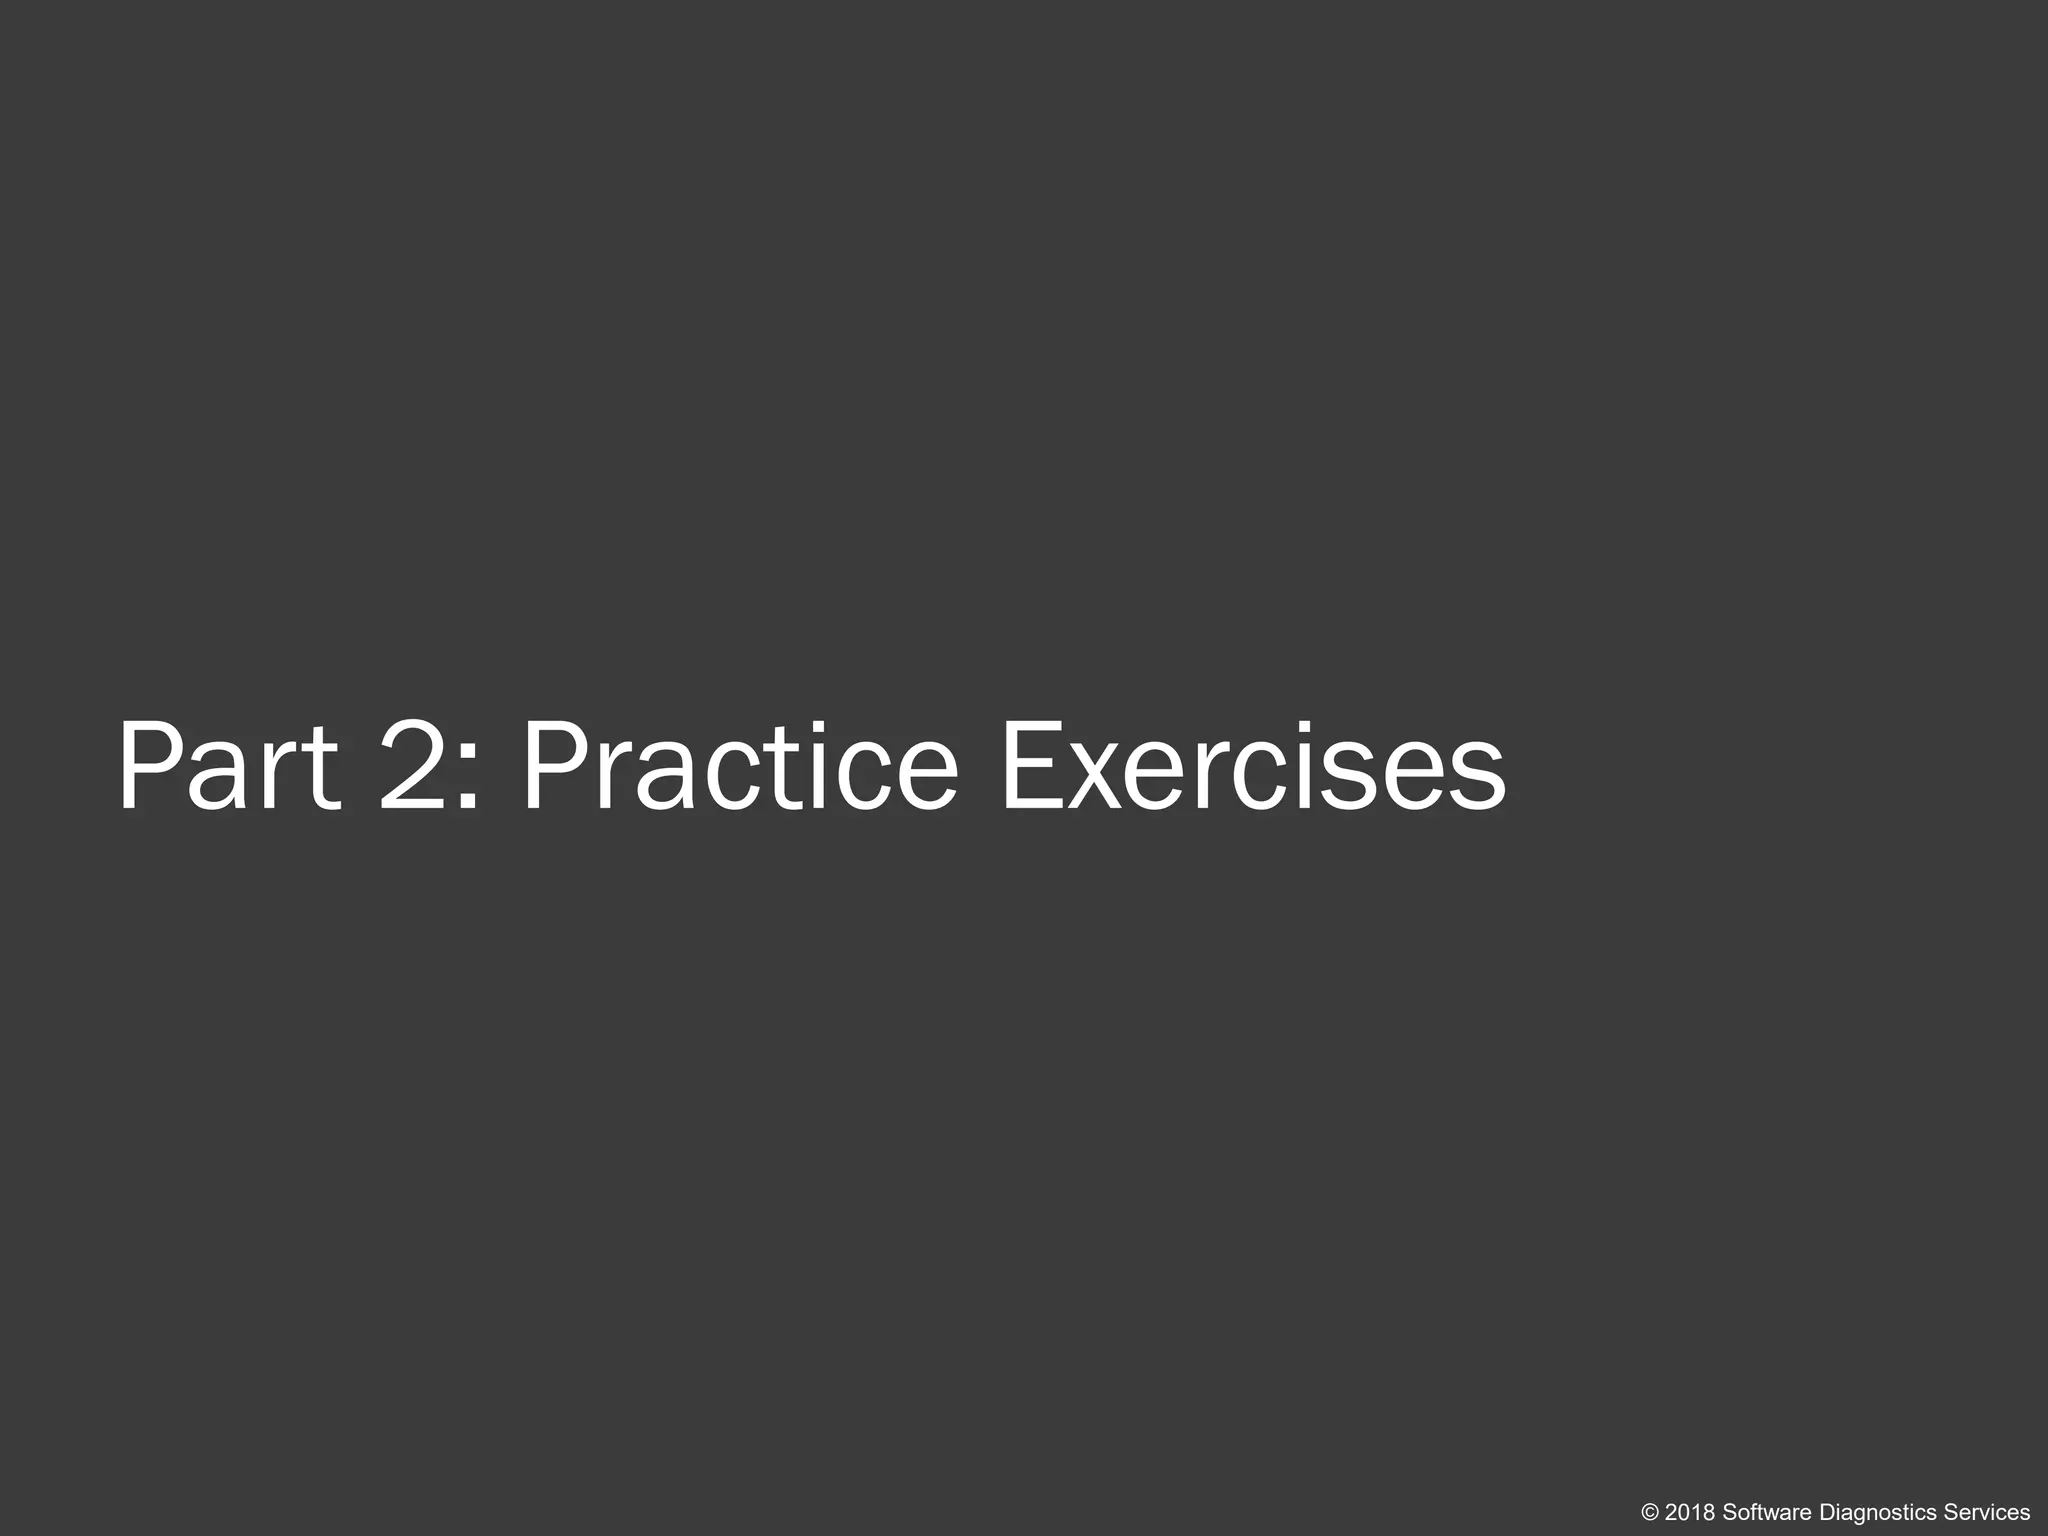
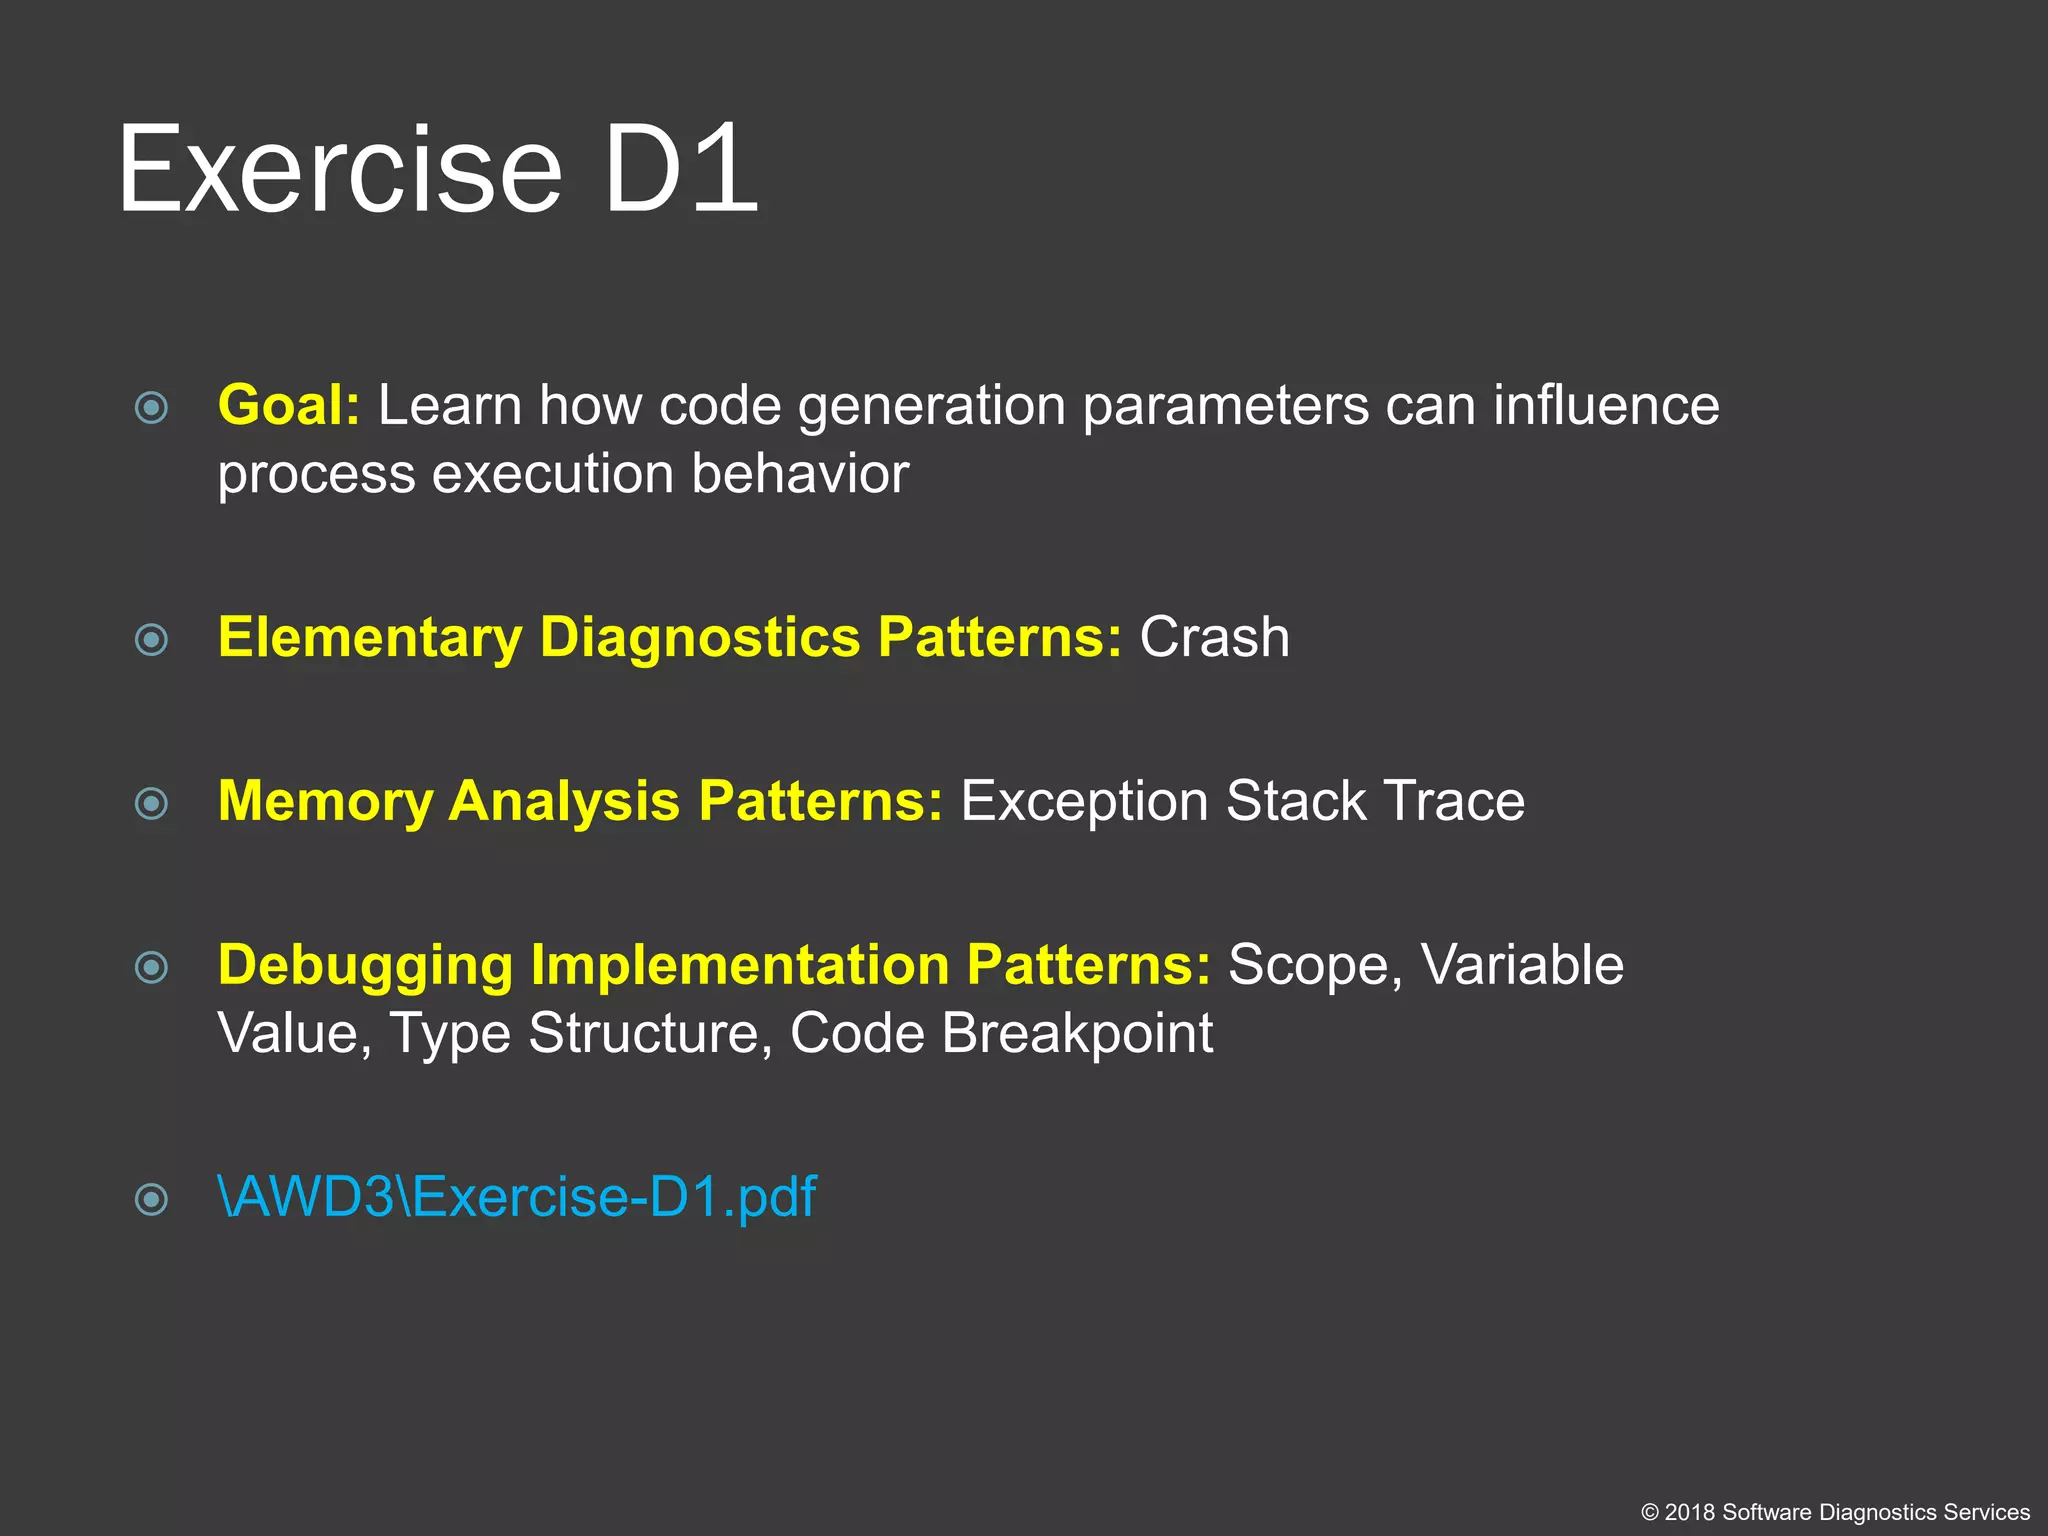
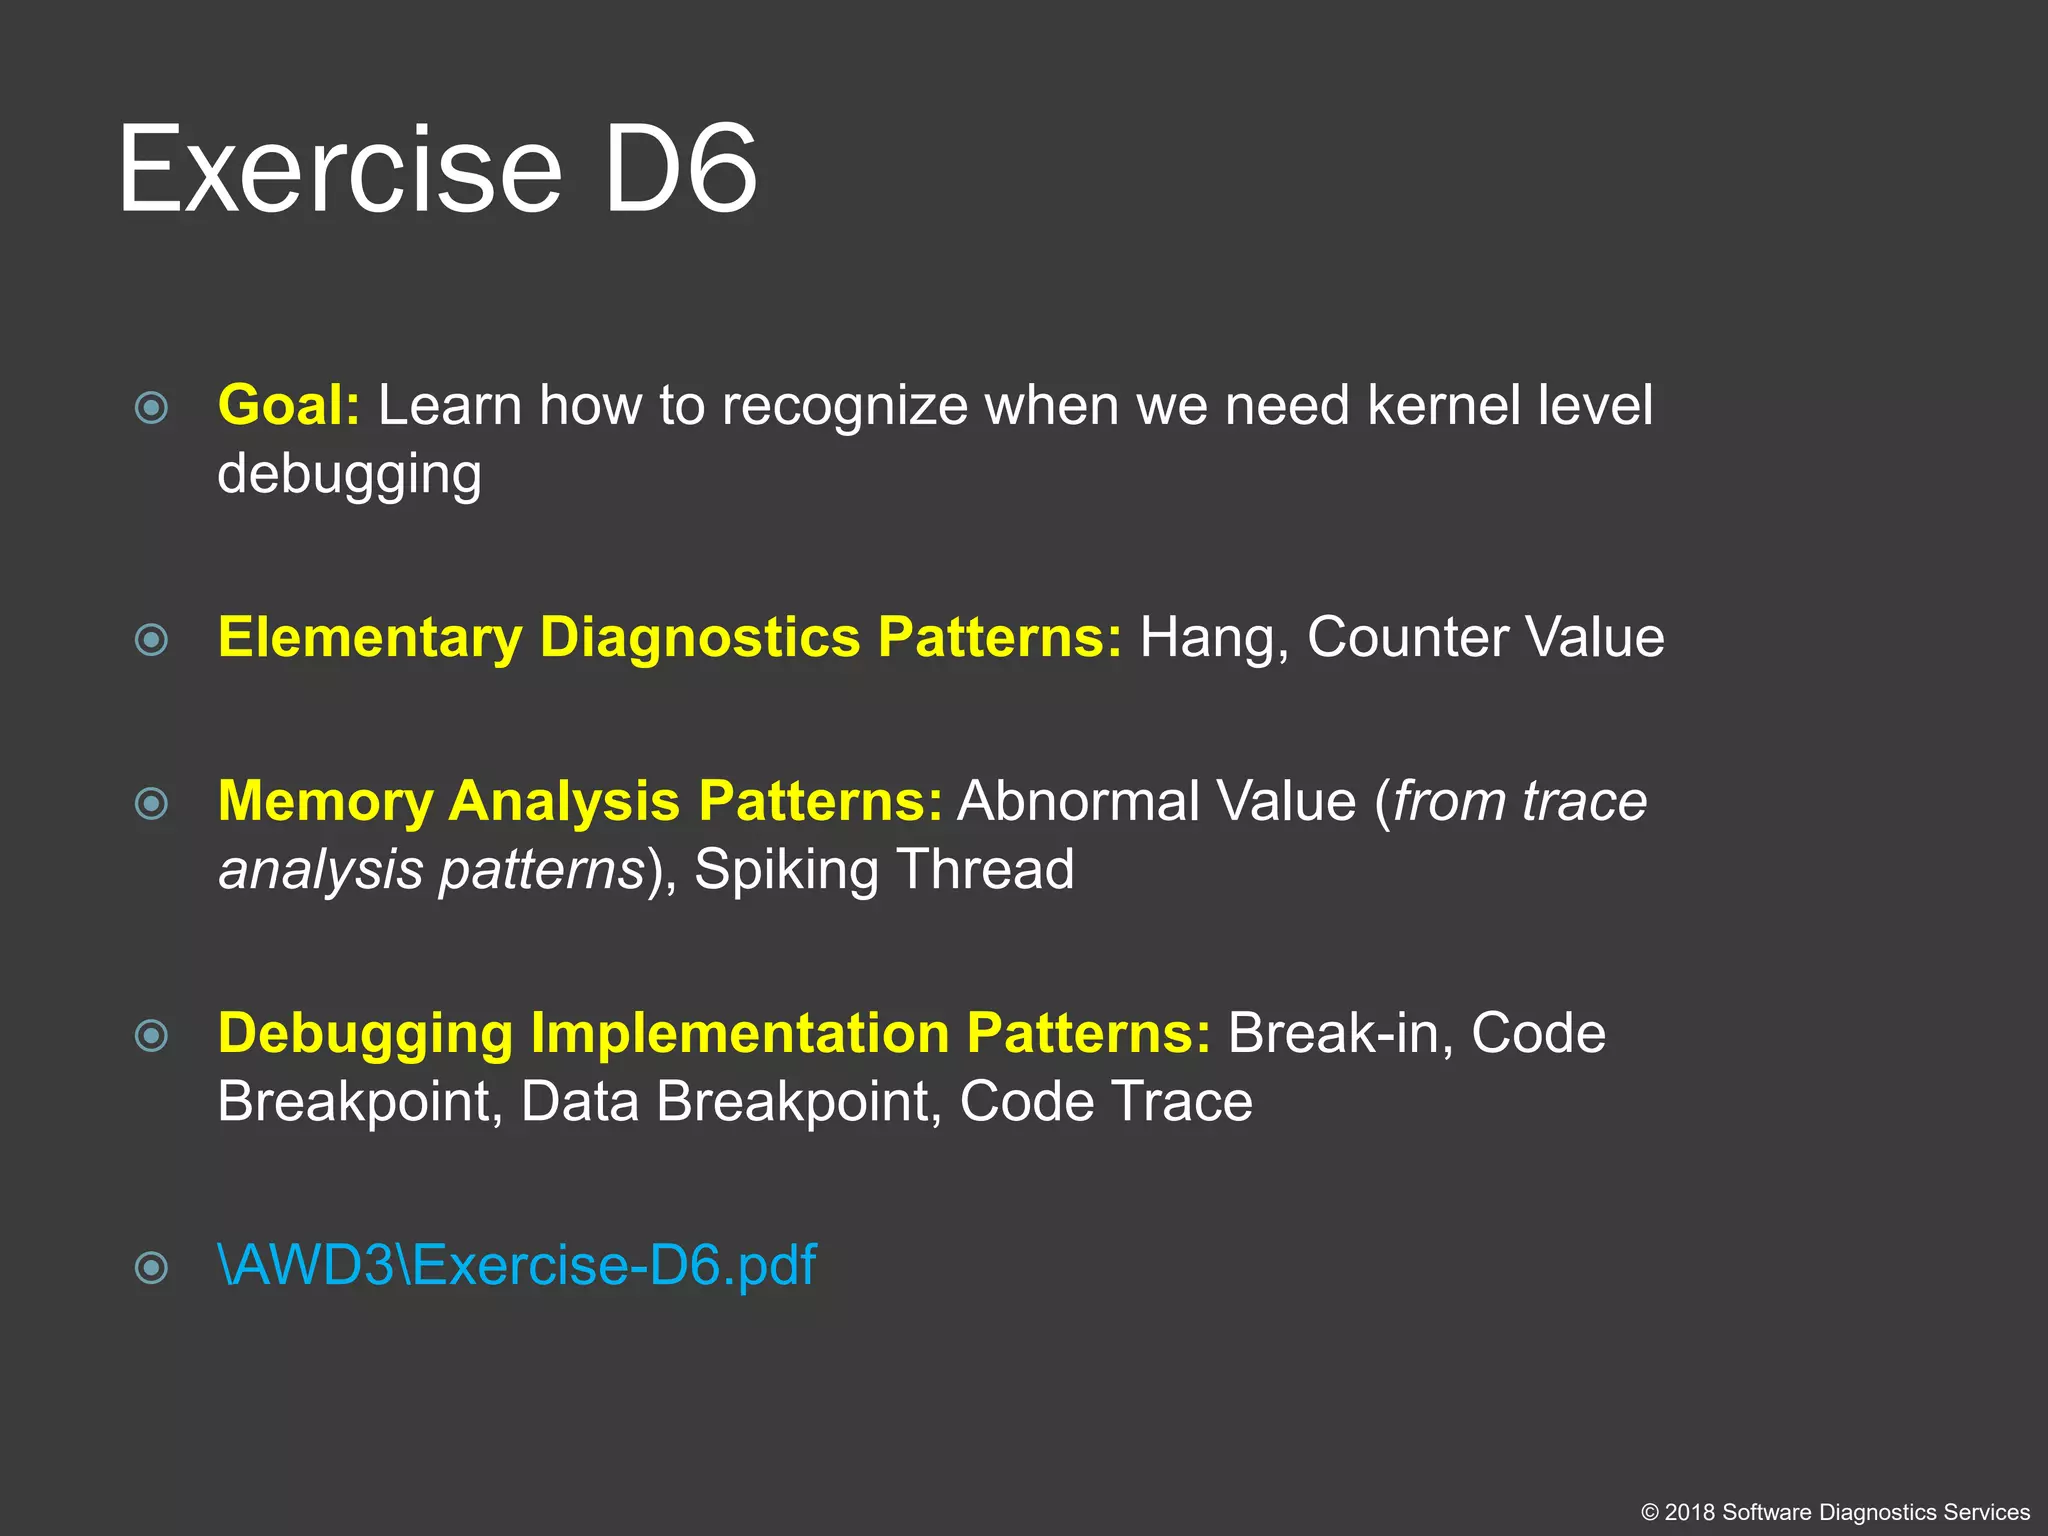
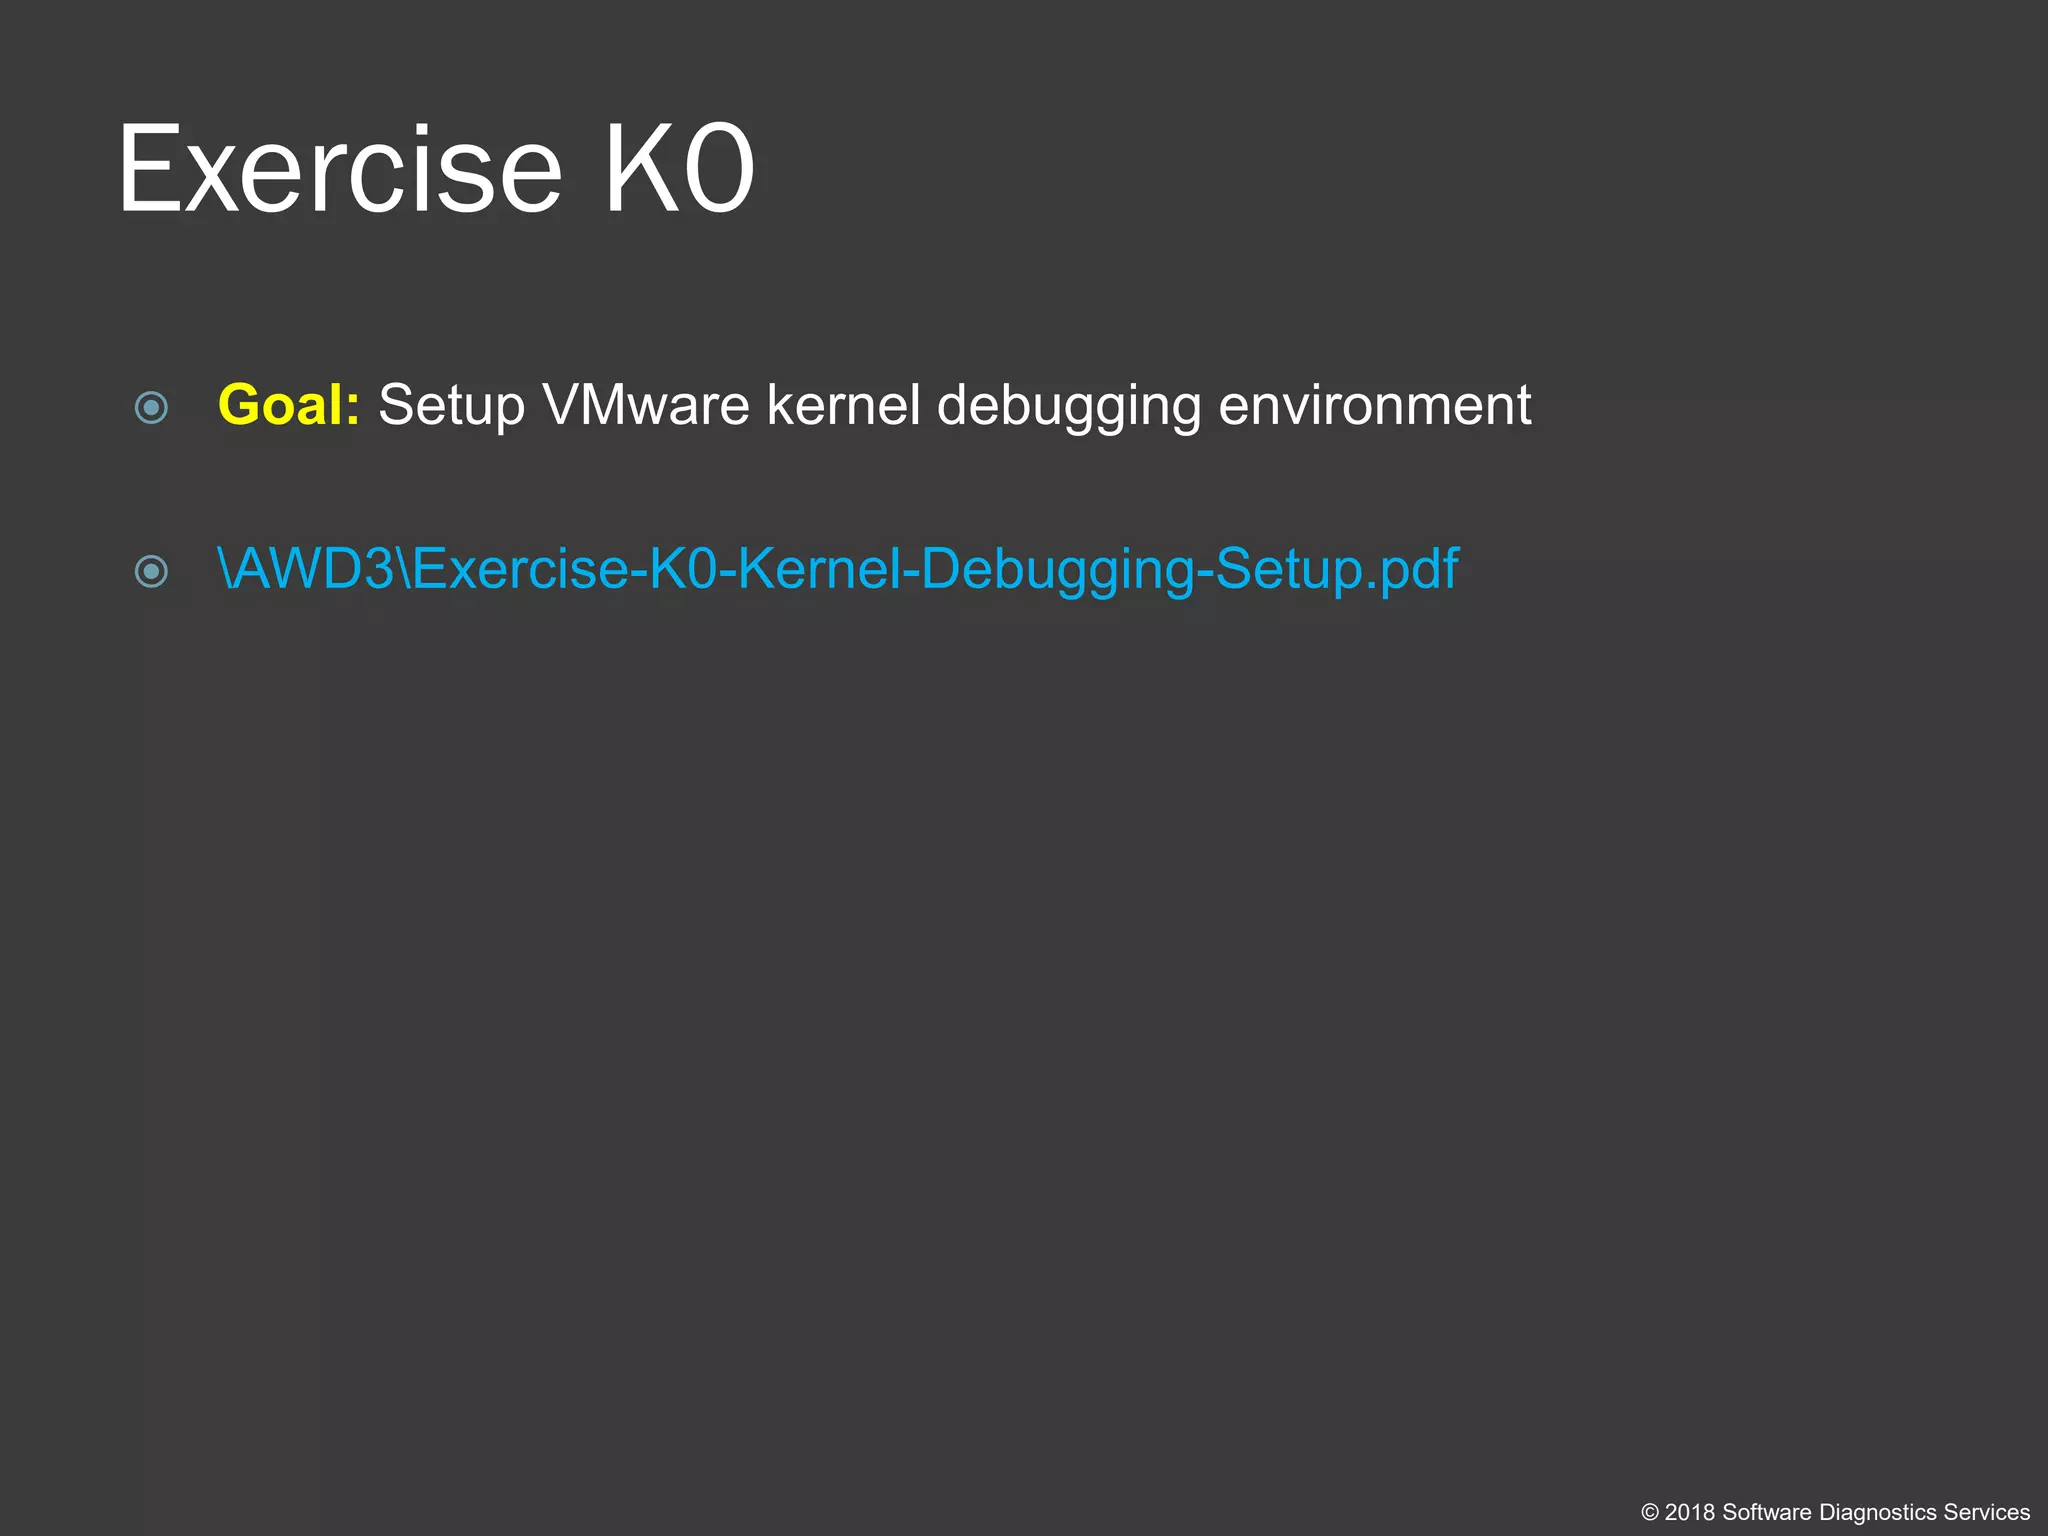
void main()
{
foo();
crash();
}
void foo()
{
char sz[256] = “Some String”;
bar();
}
void bar()
{
do();
}
void crash()
{
WER();
}
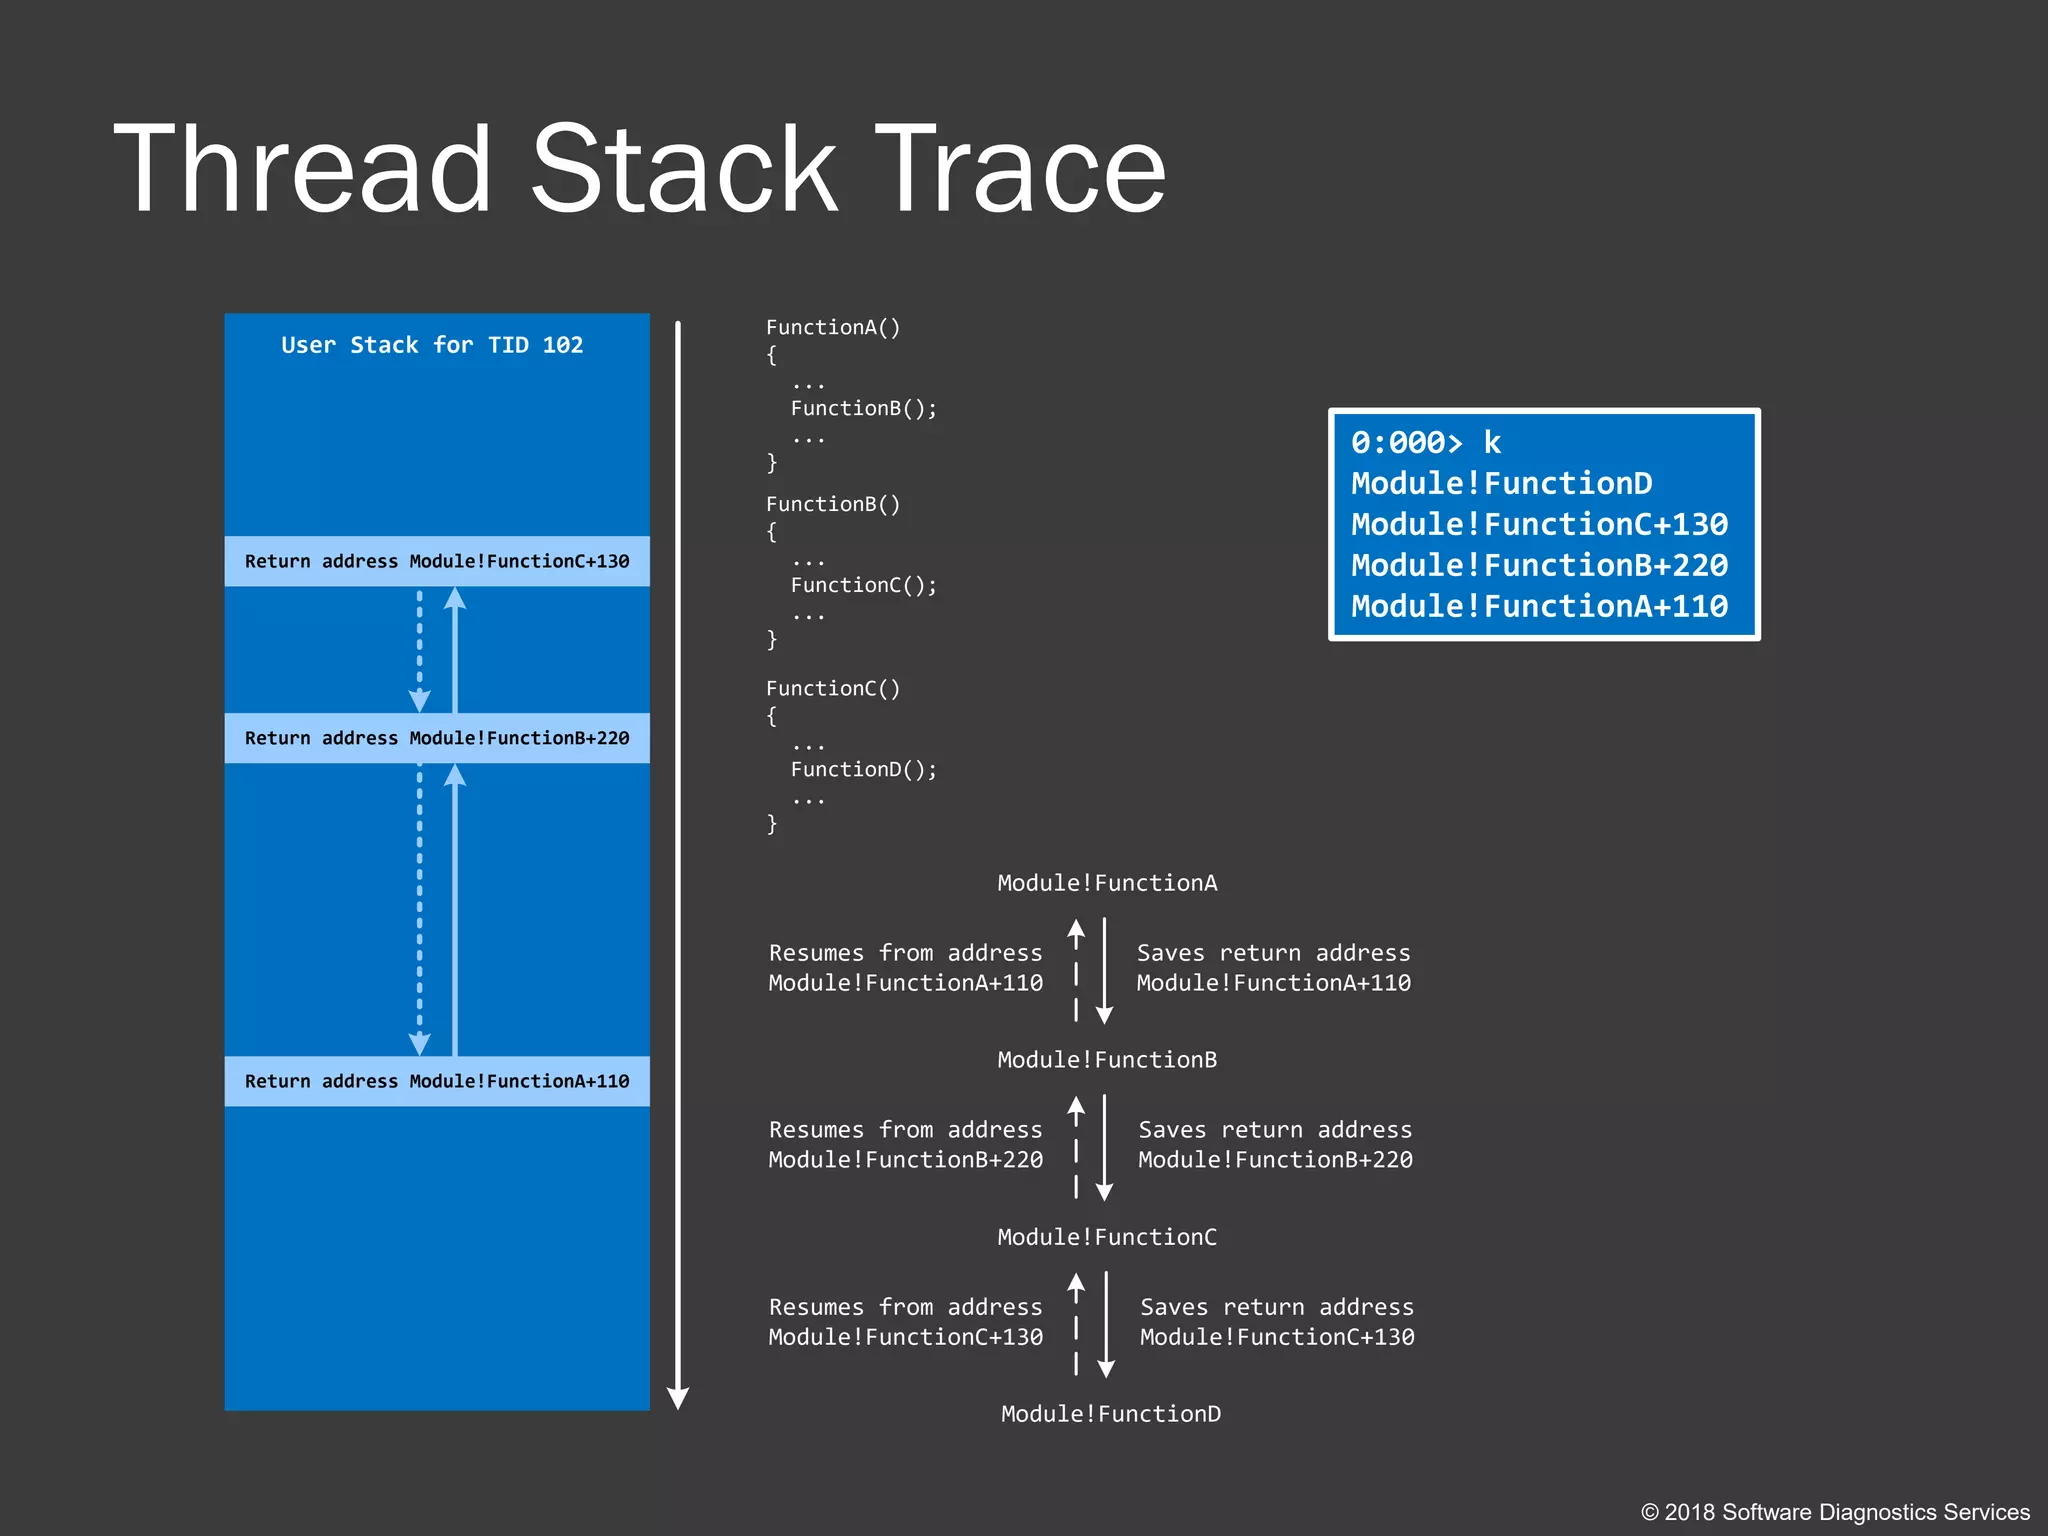
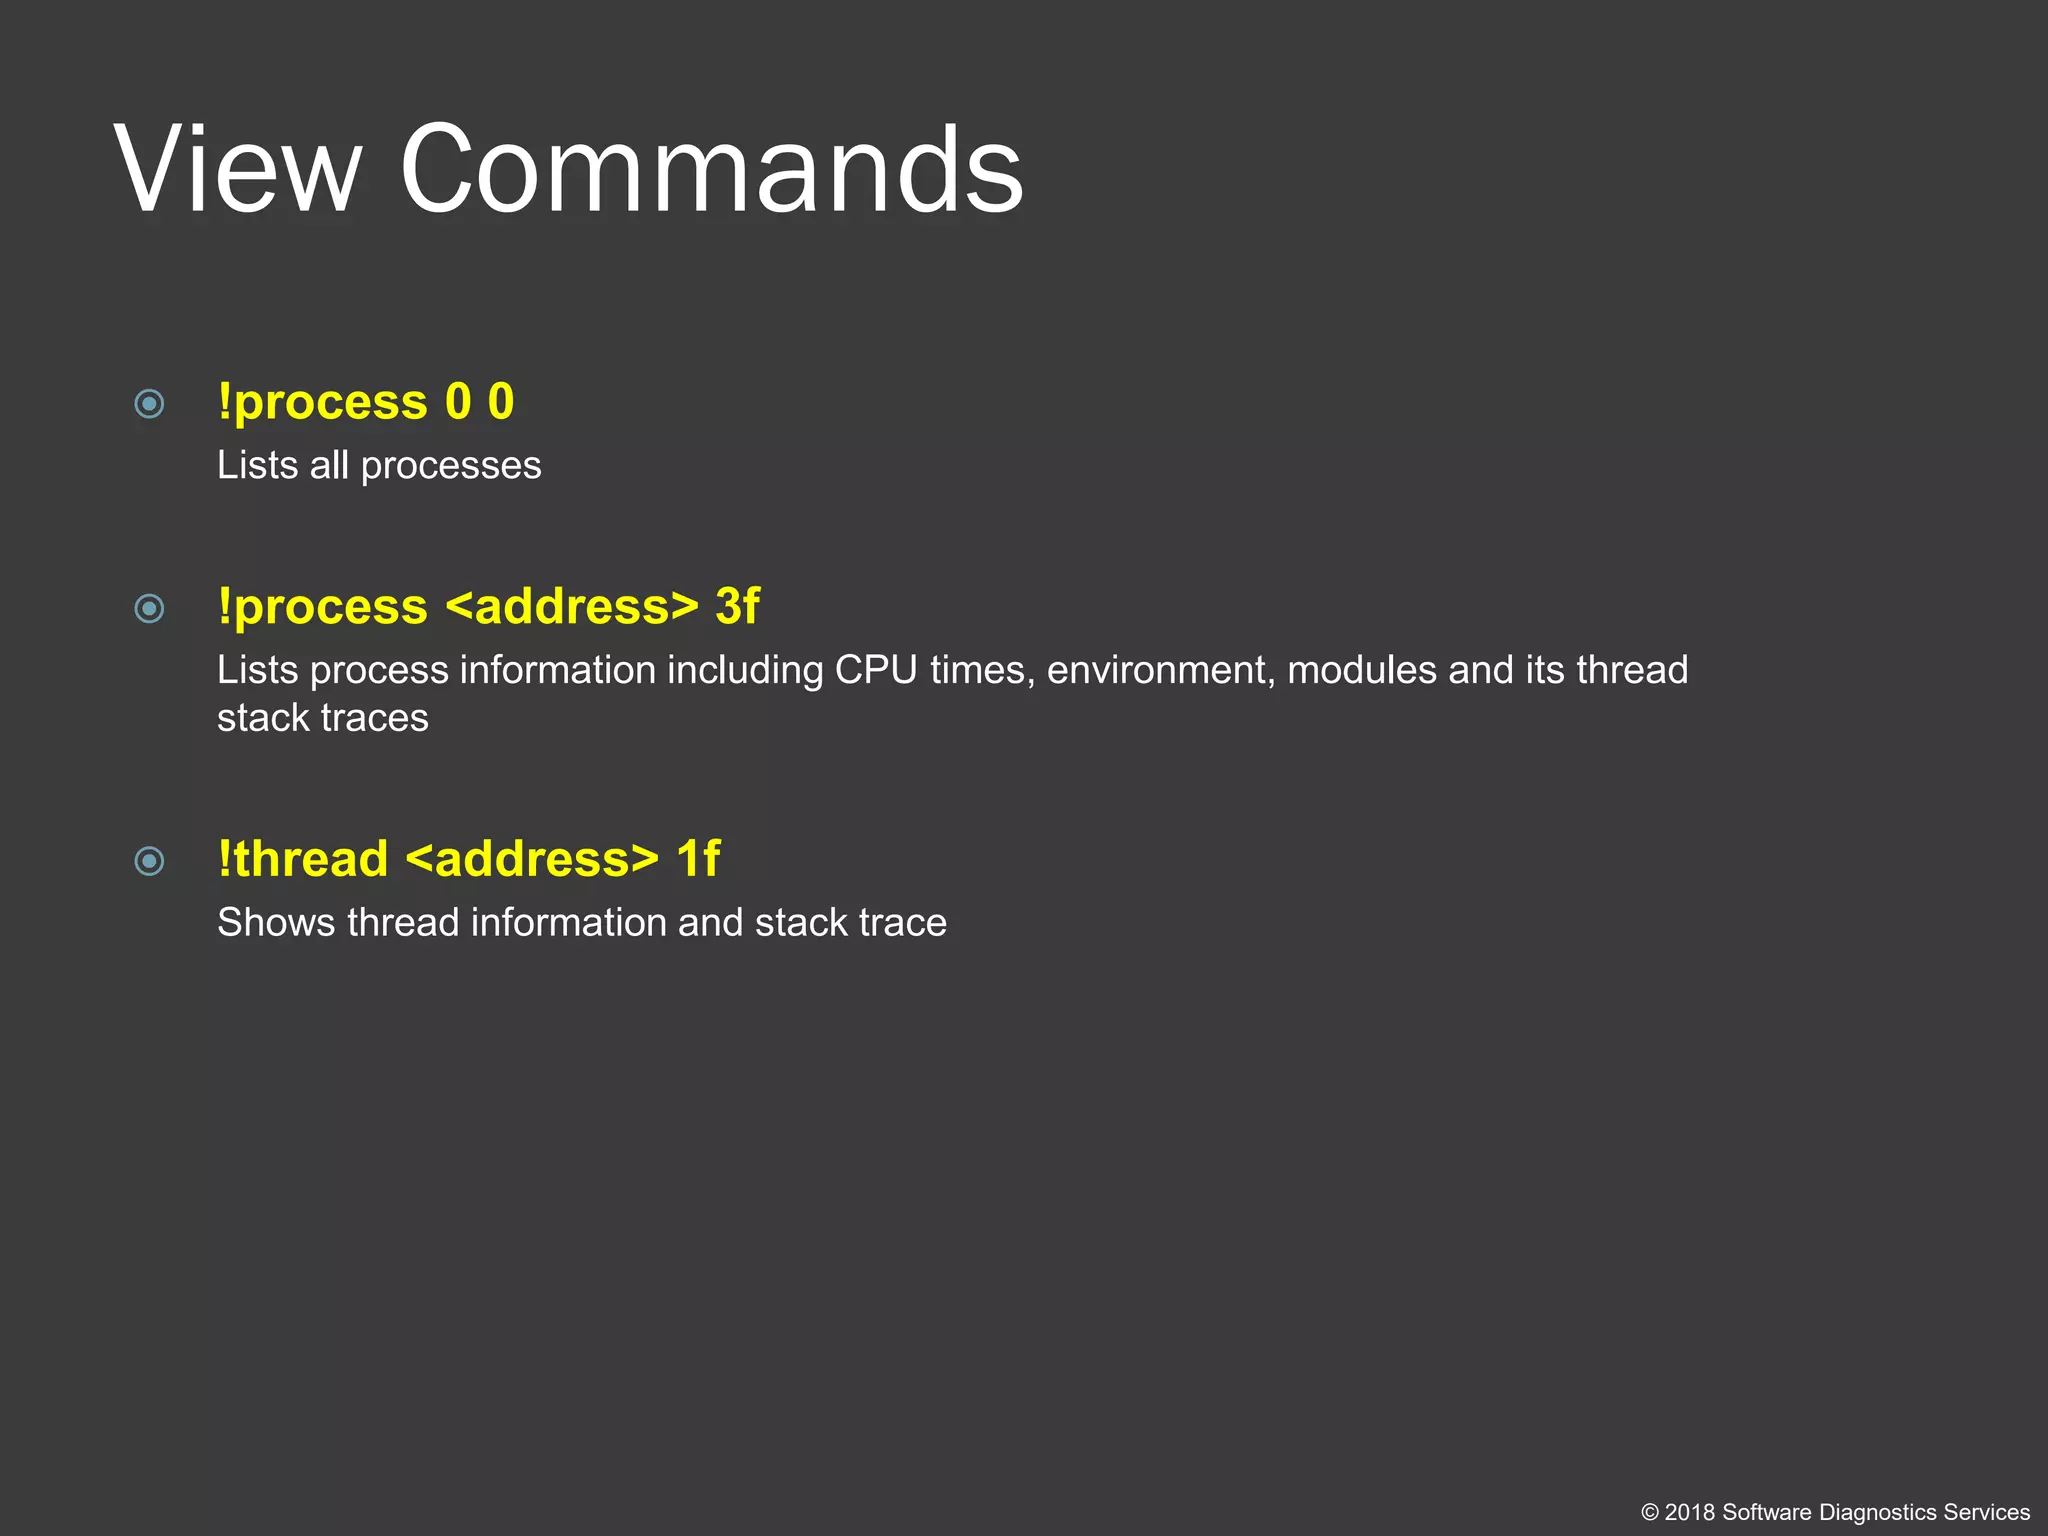
module!main+10
module!crash+30
Some String
module!bar+20
0:000> k
module!crash+30
module!main+10](https://image.slidesharecdn.com/accelerated-windows-debugging3-version2-public-180916100501/75/Accelerated-Windows-Debugging-3-training-public-slides-24-2048.jpg)
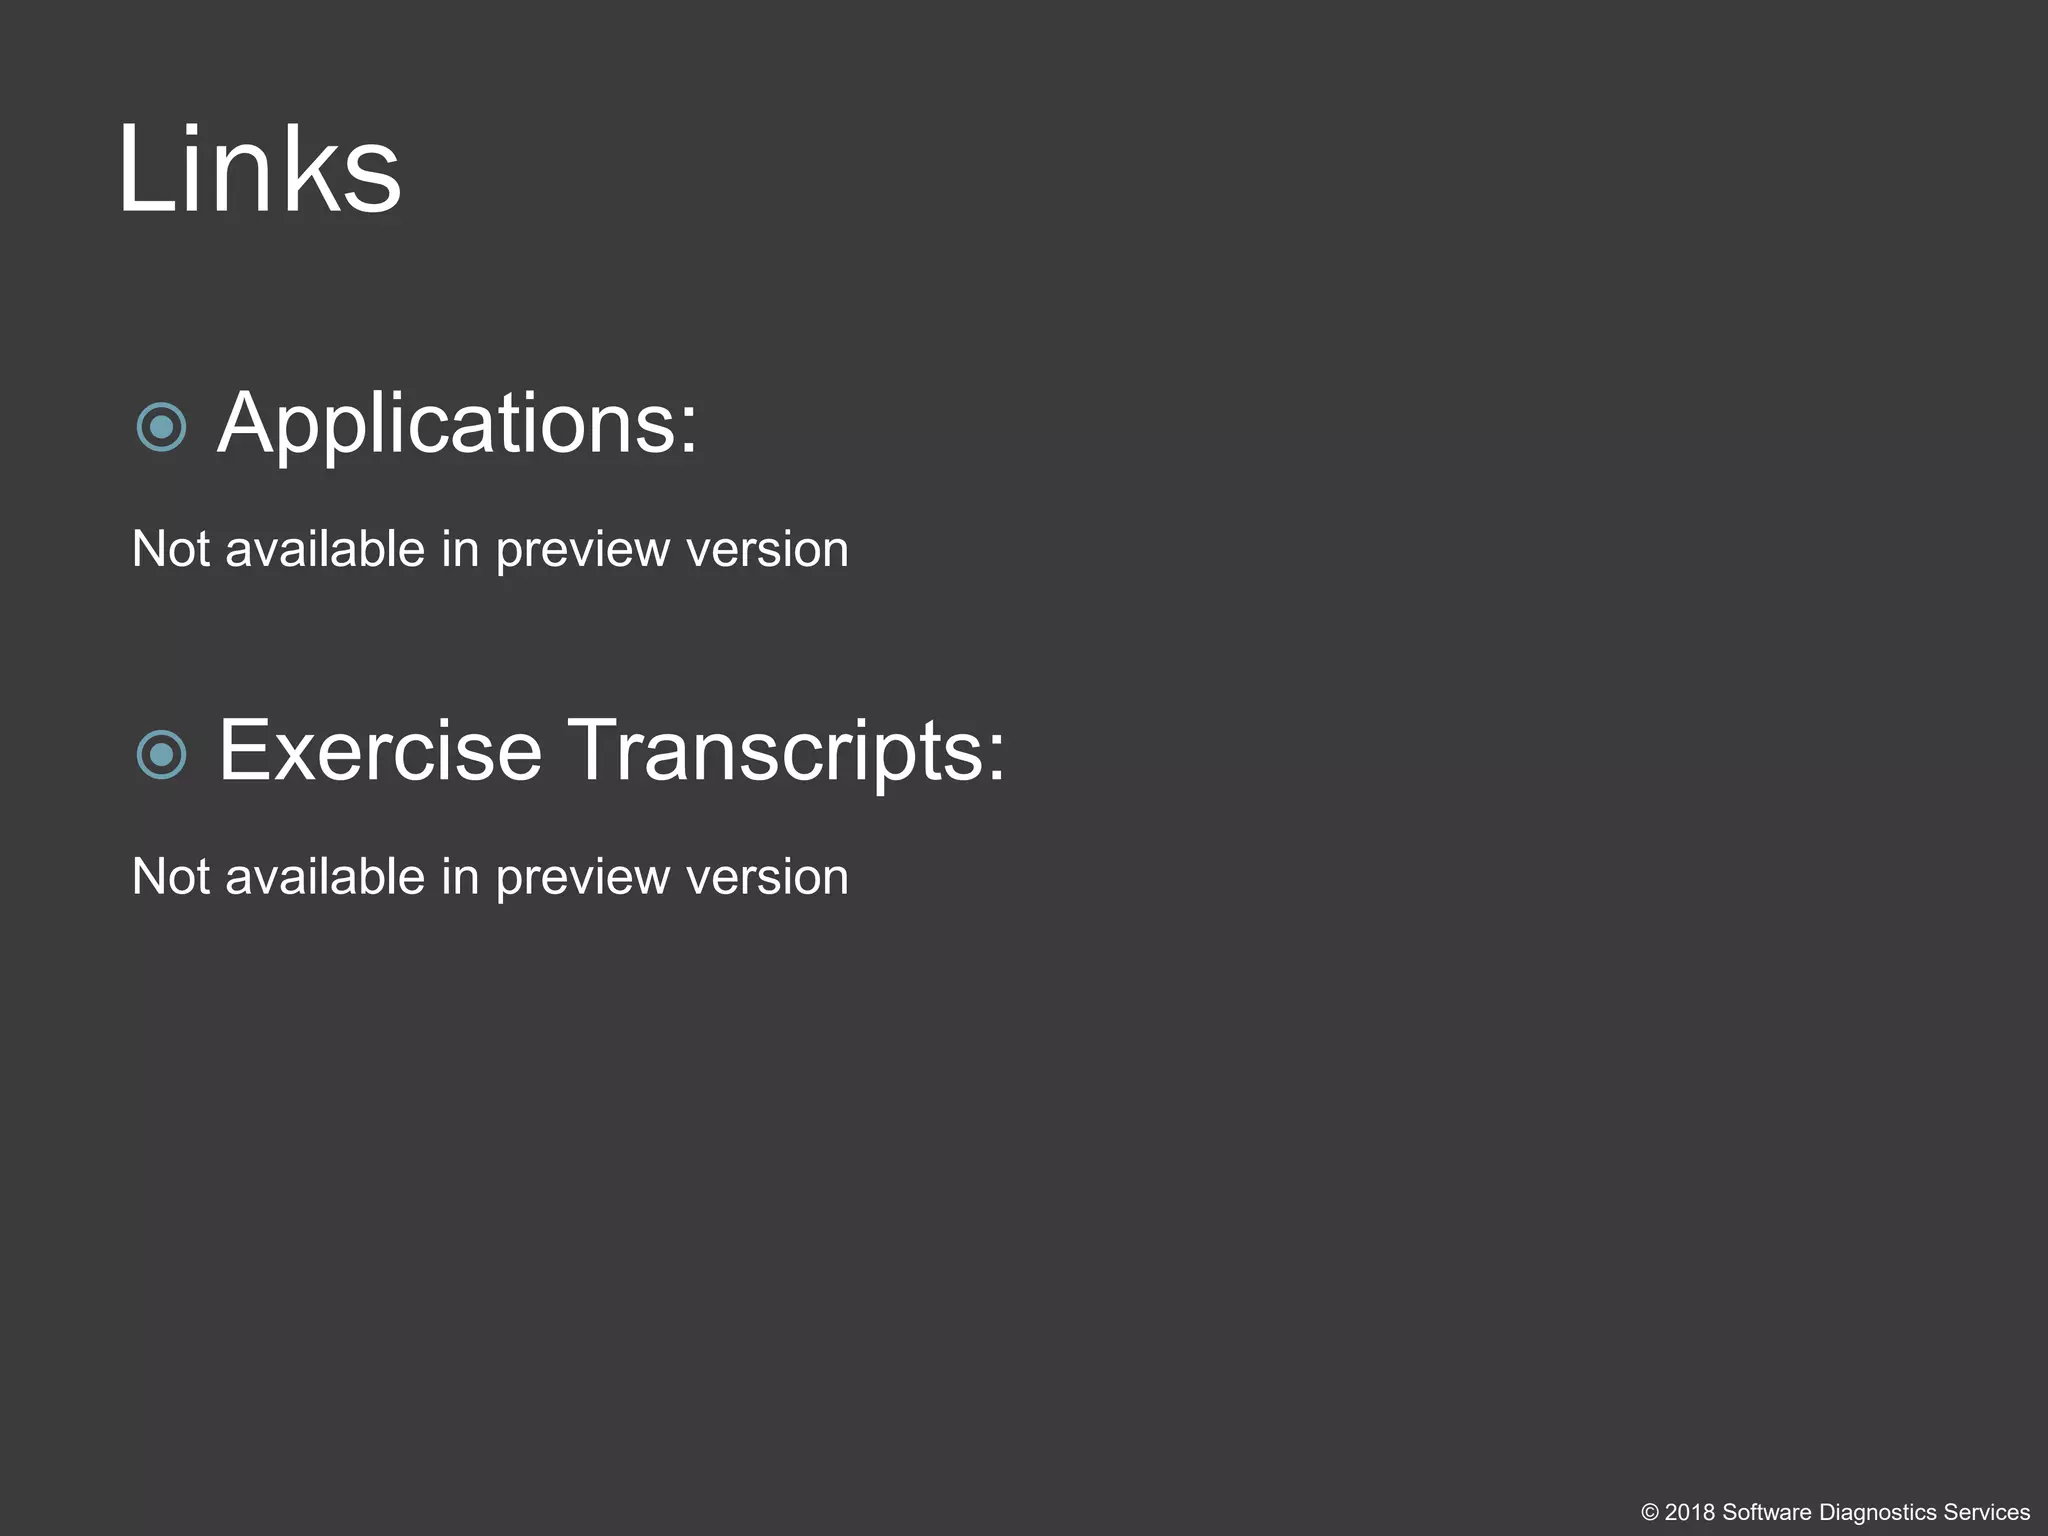
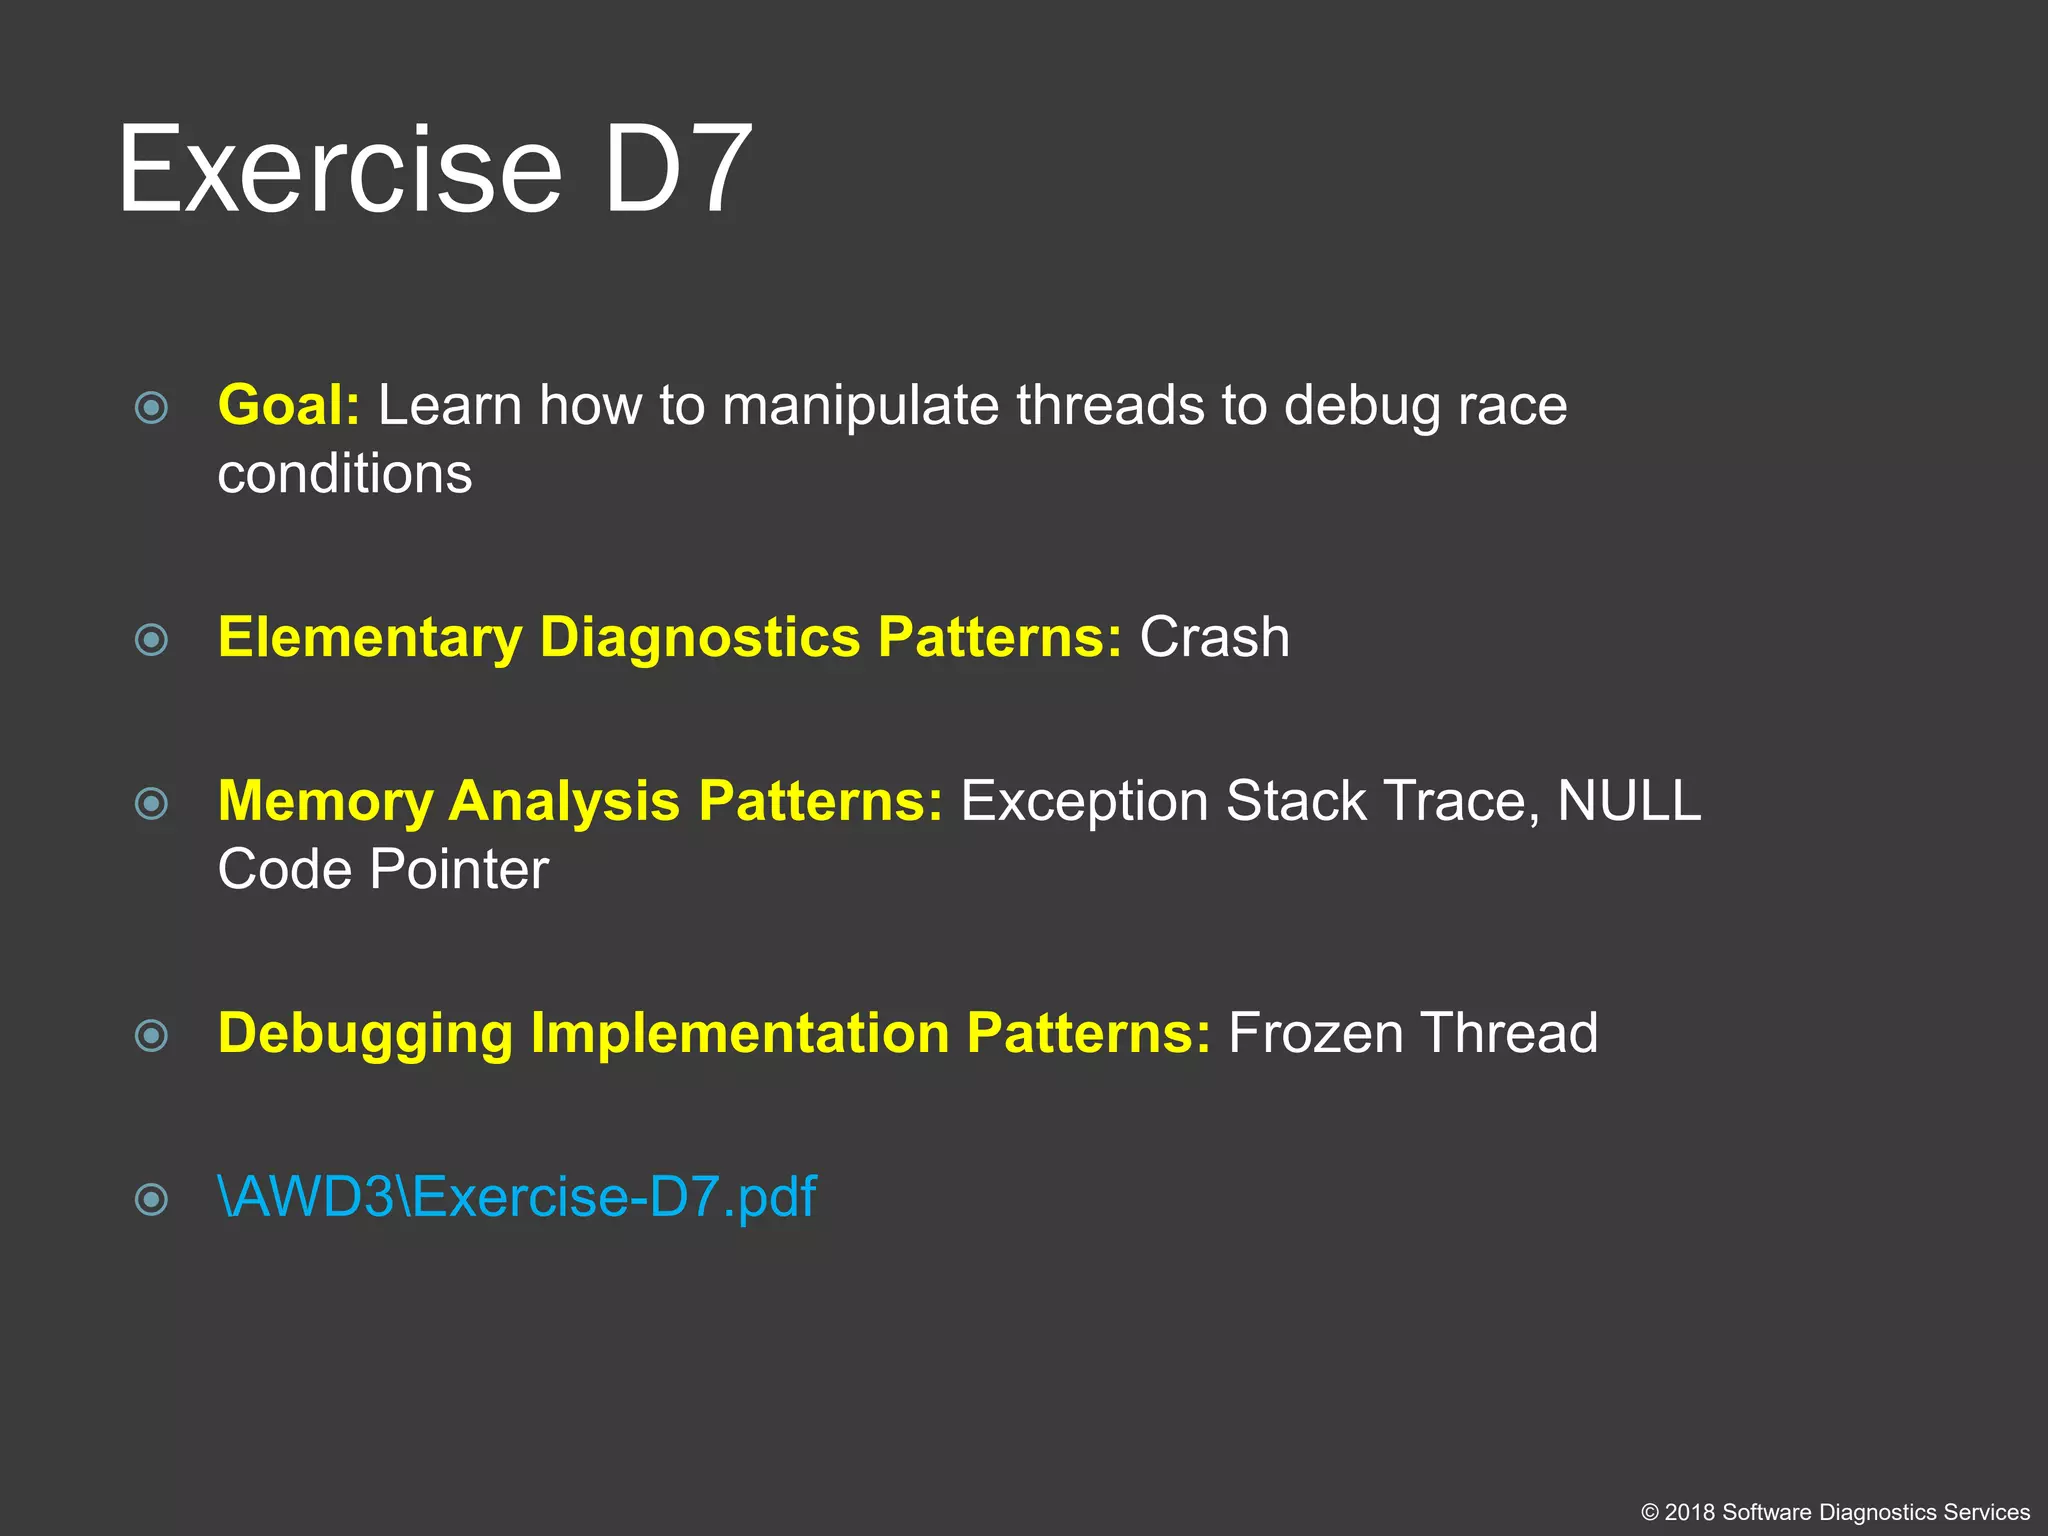
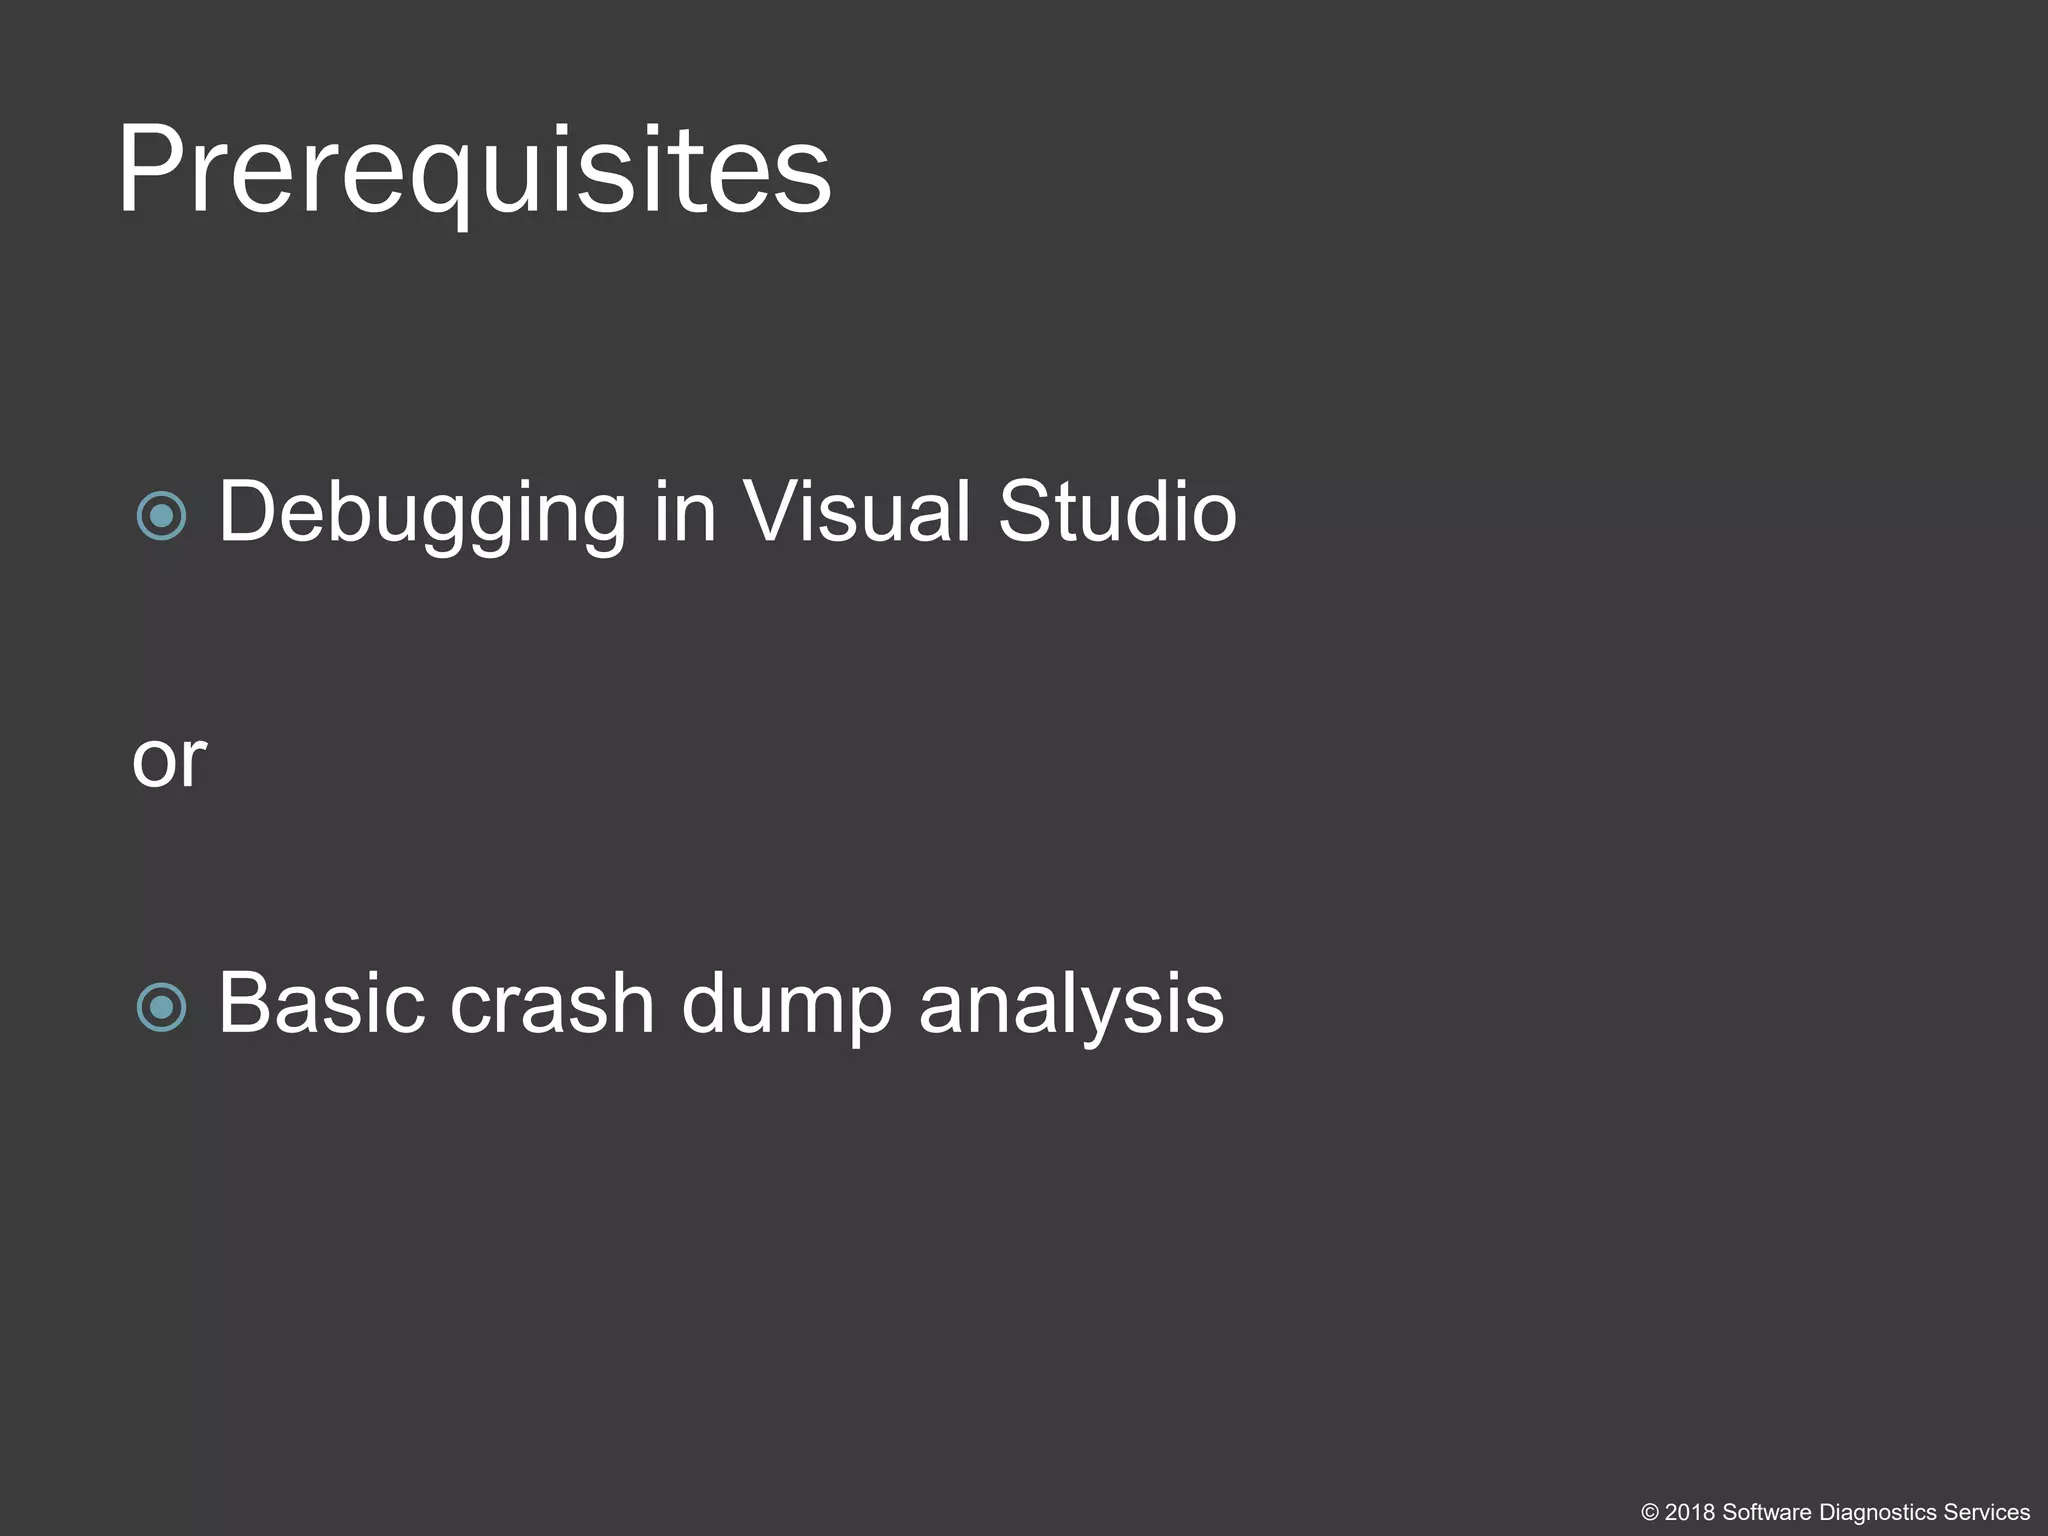
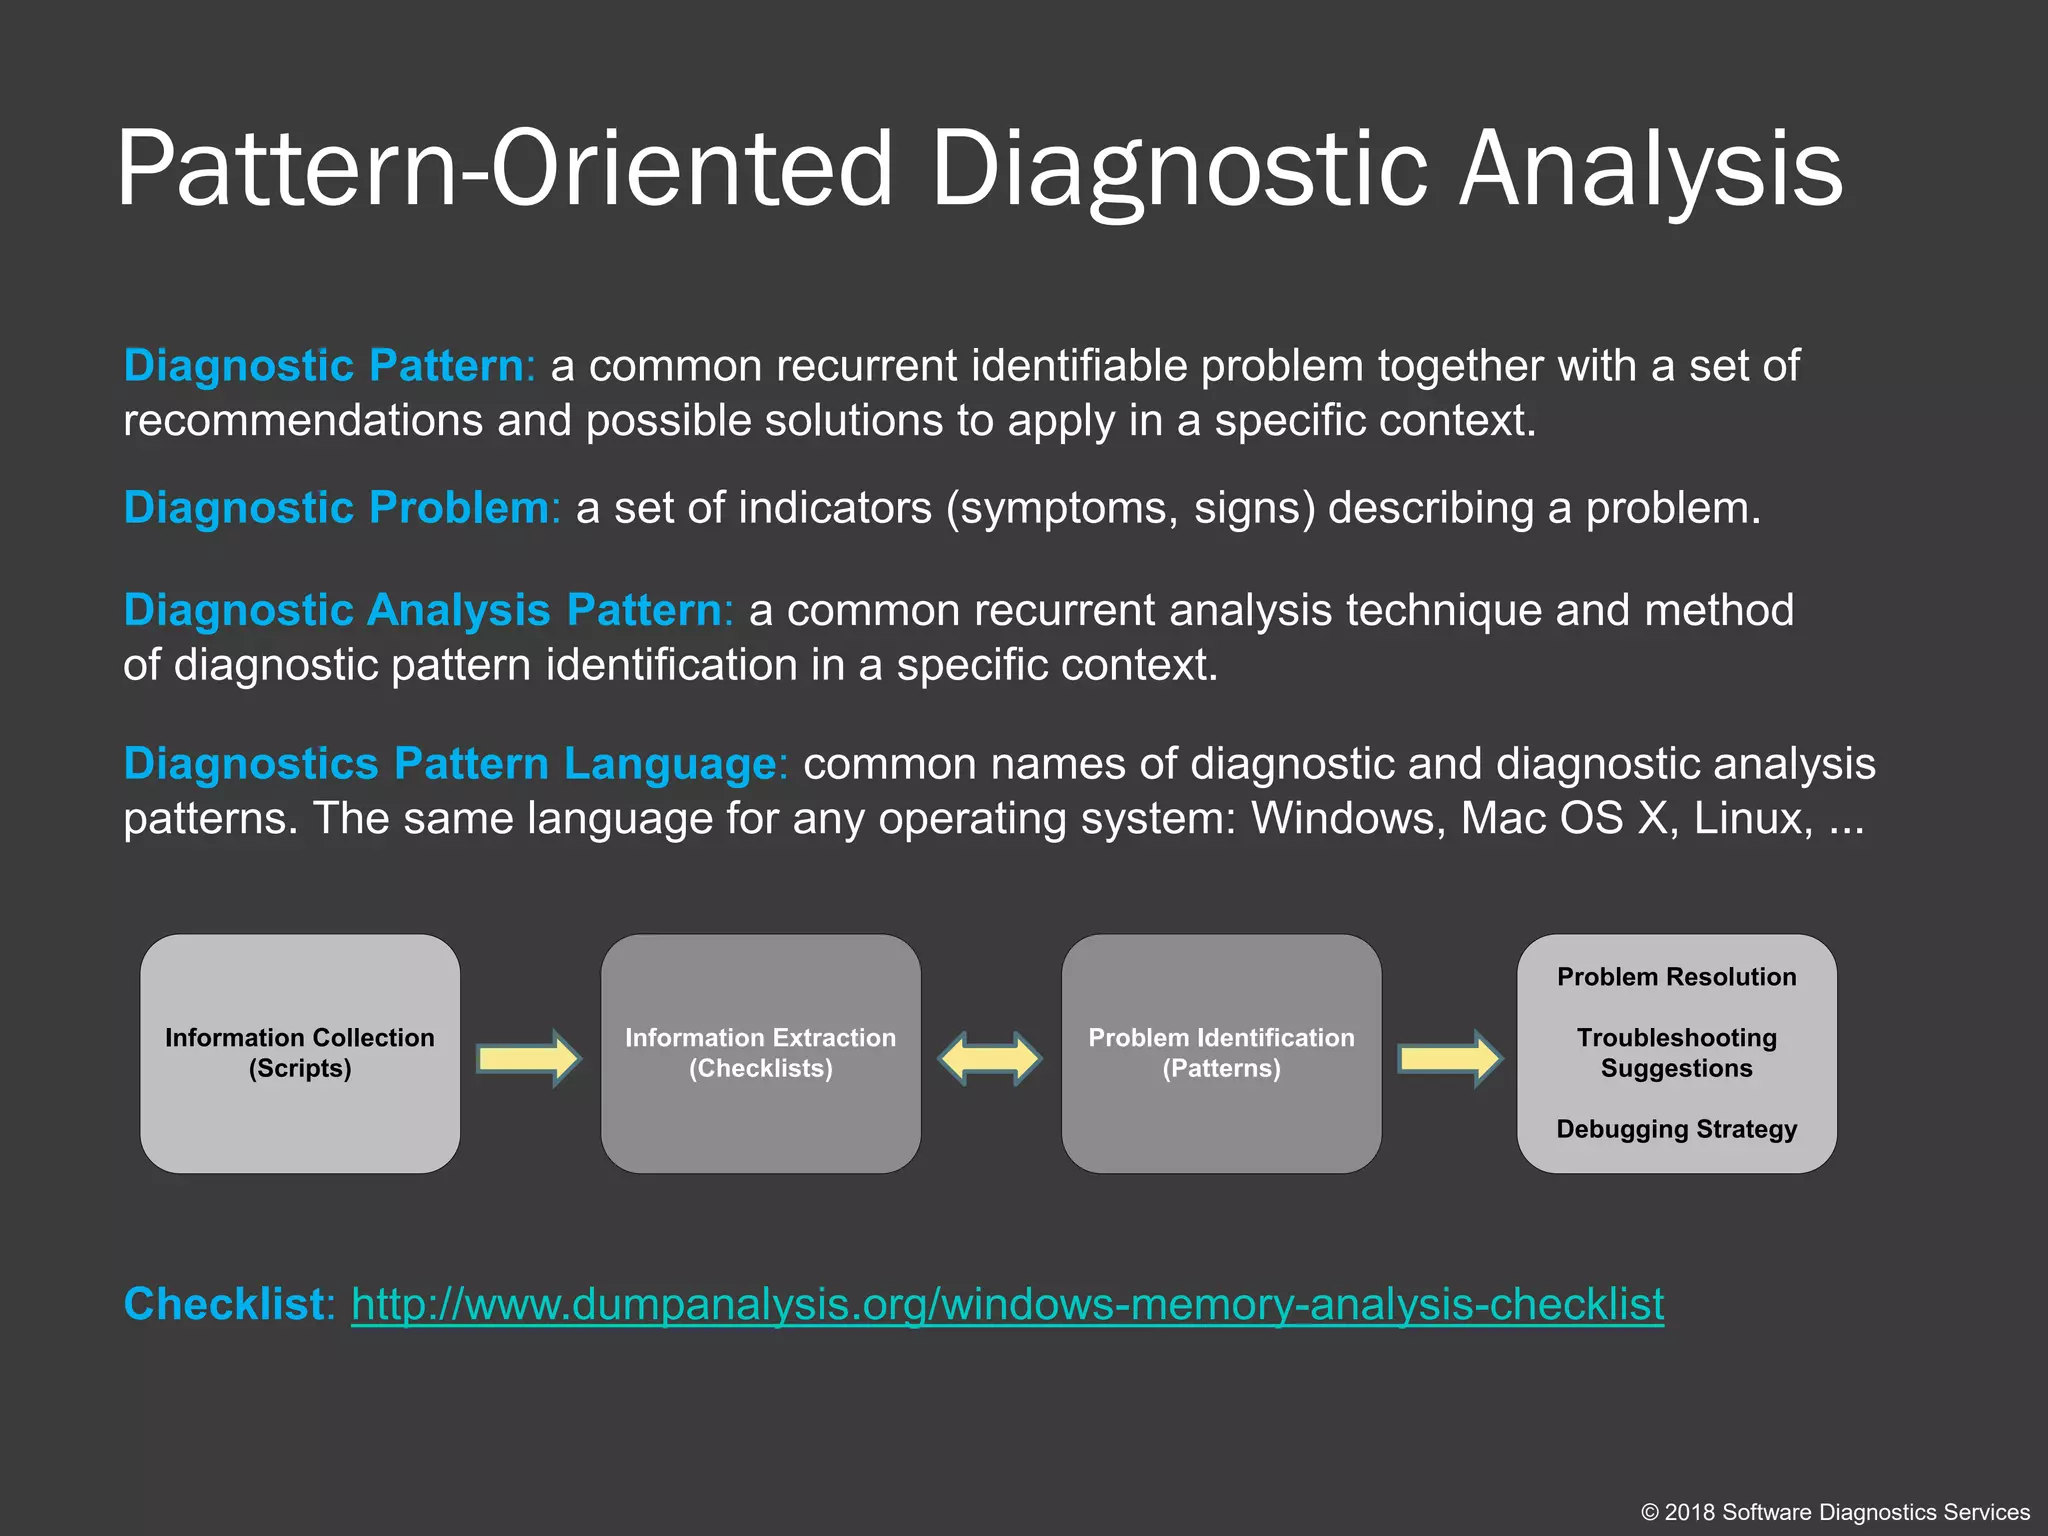
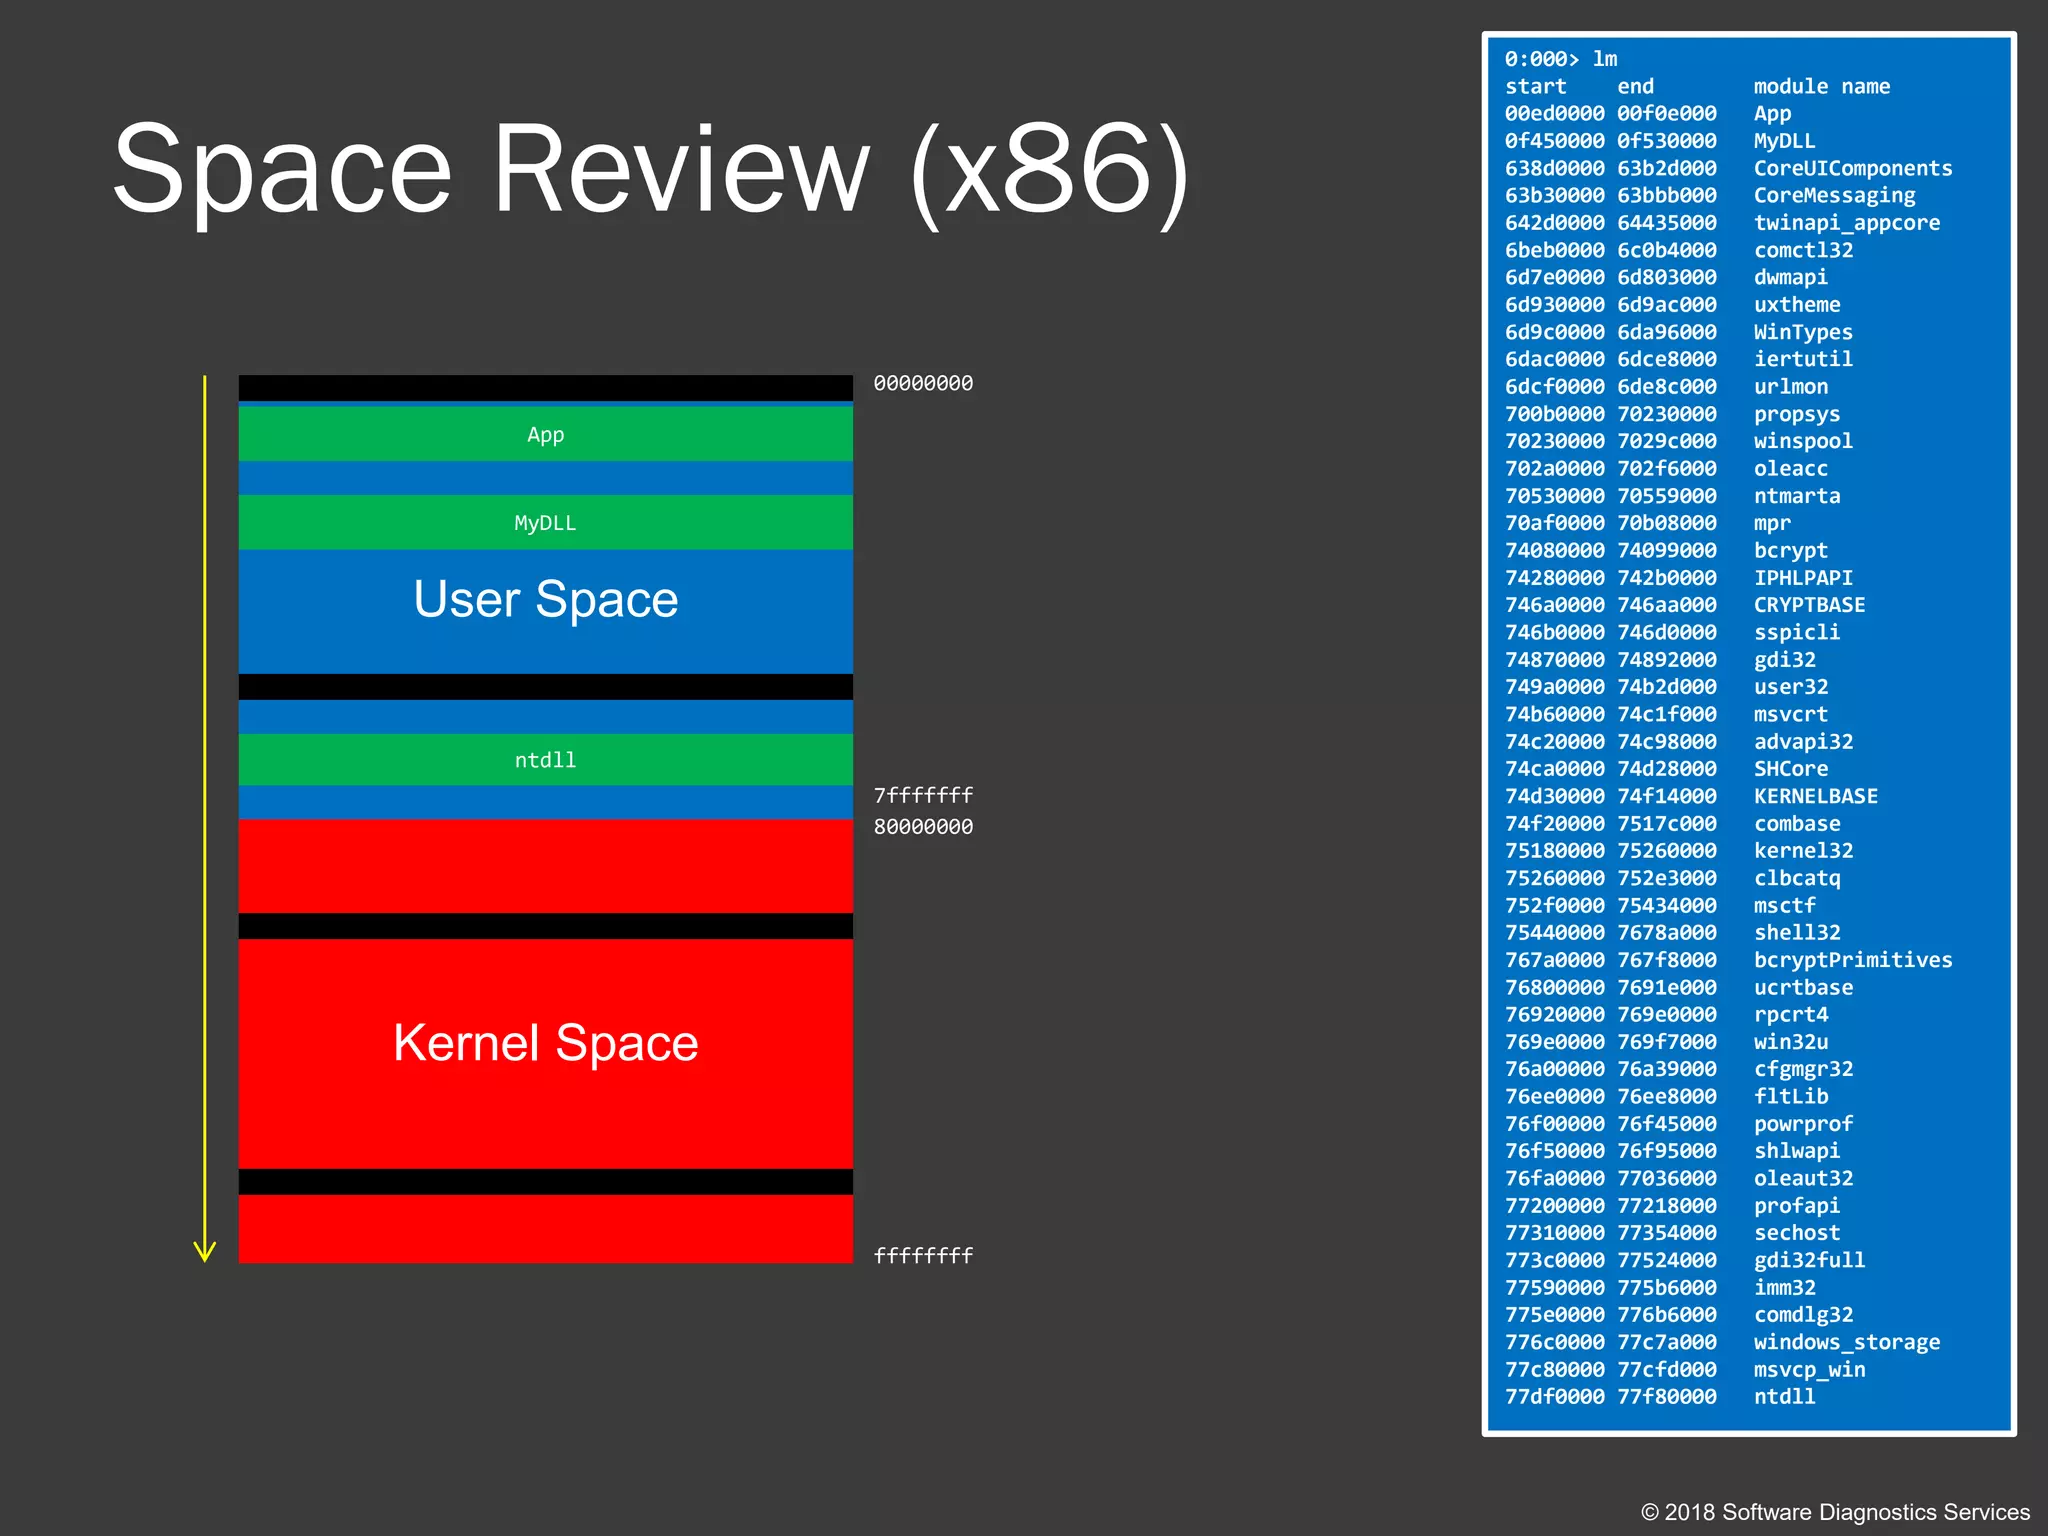
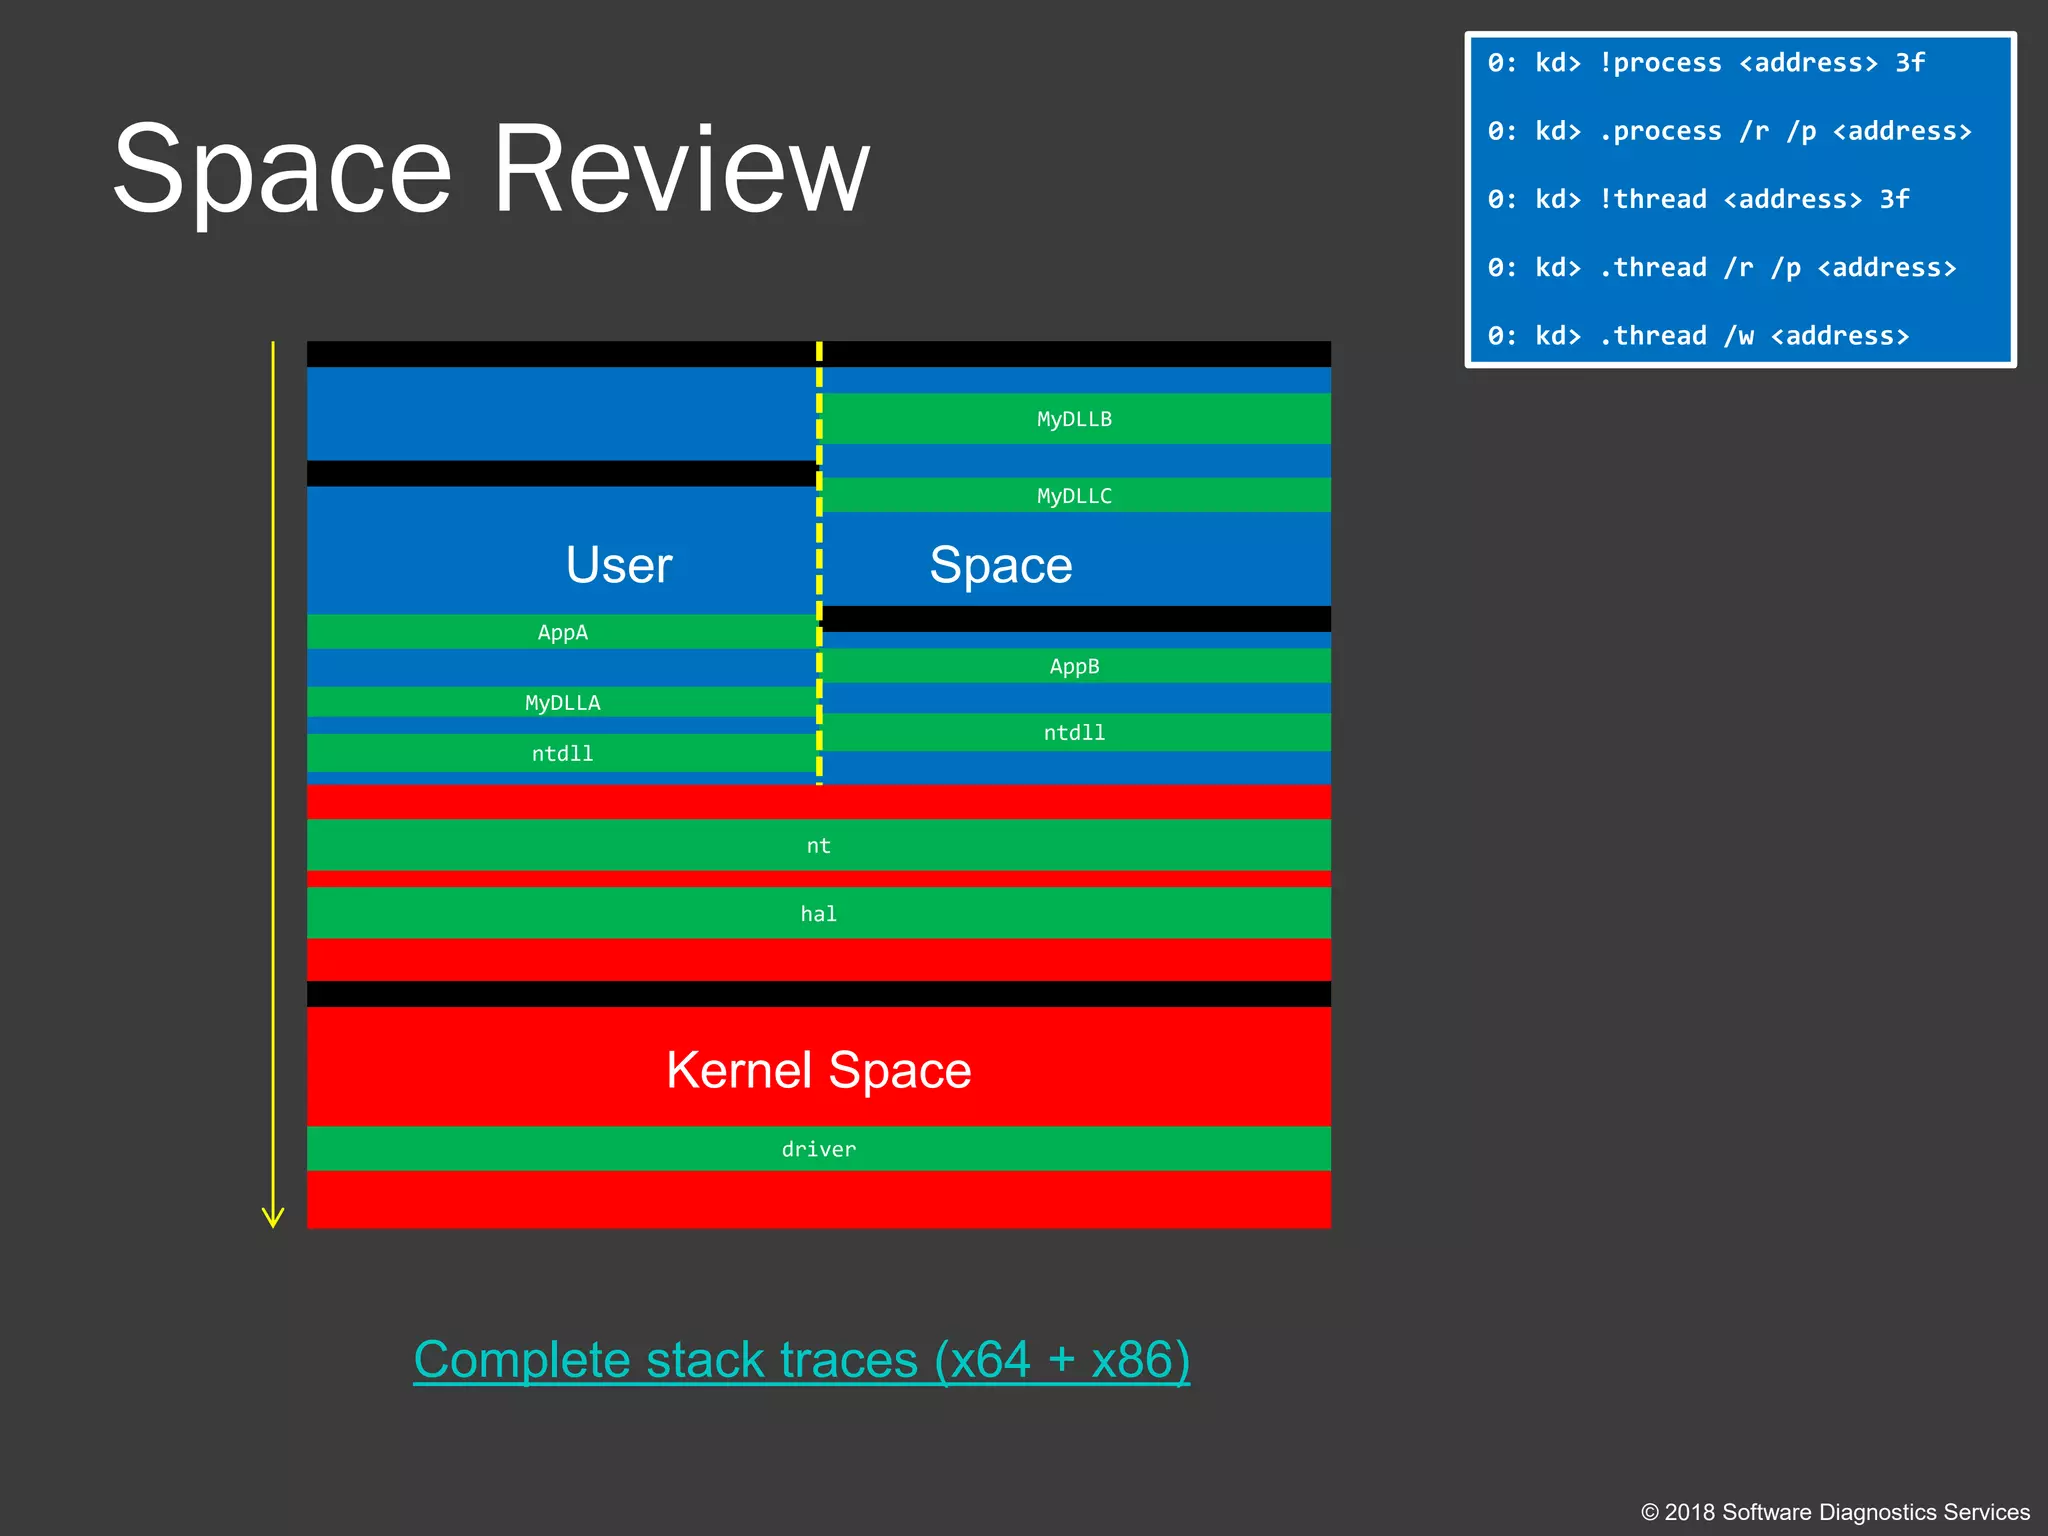
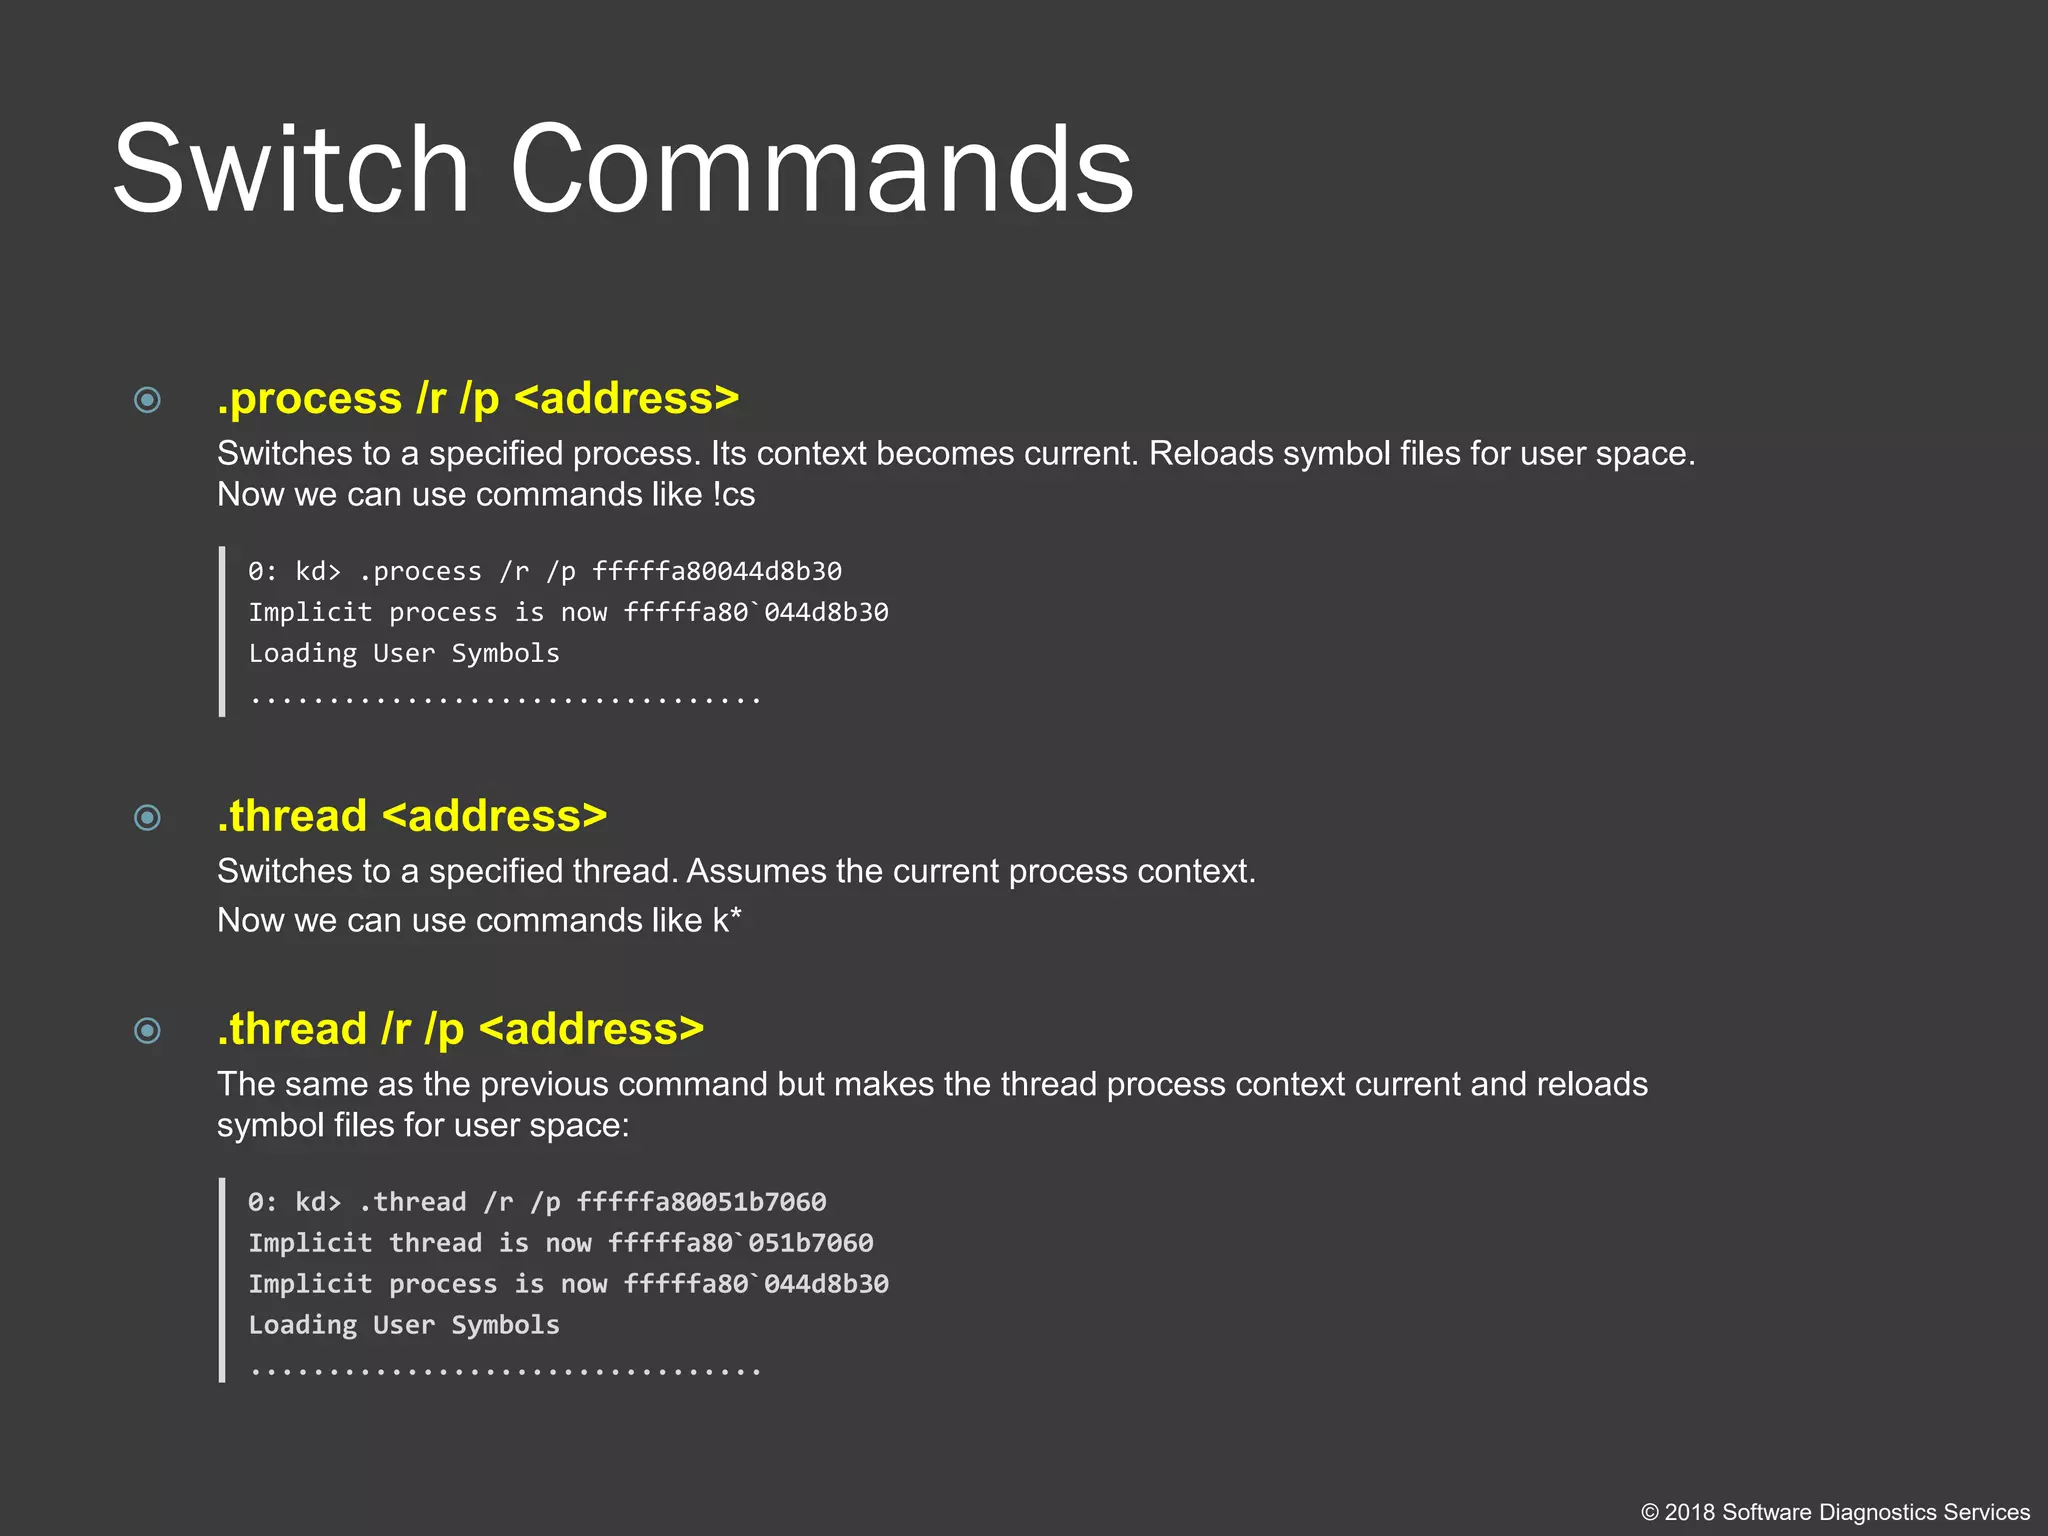
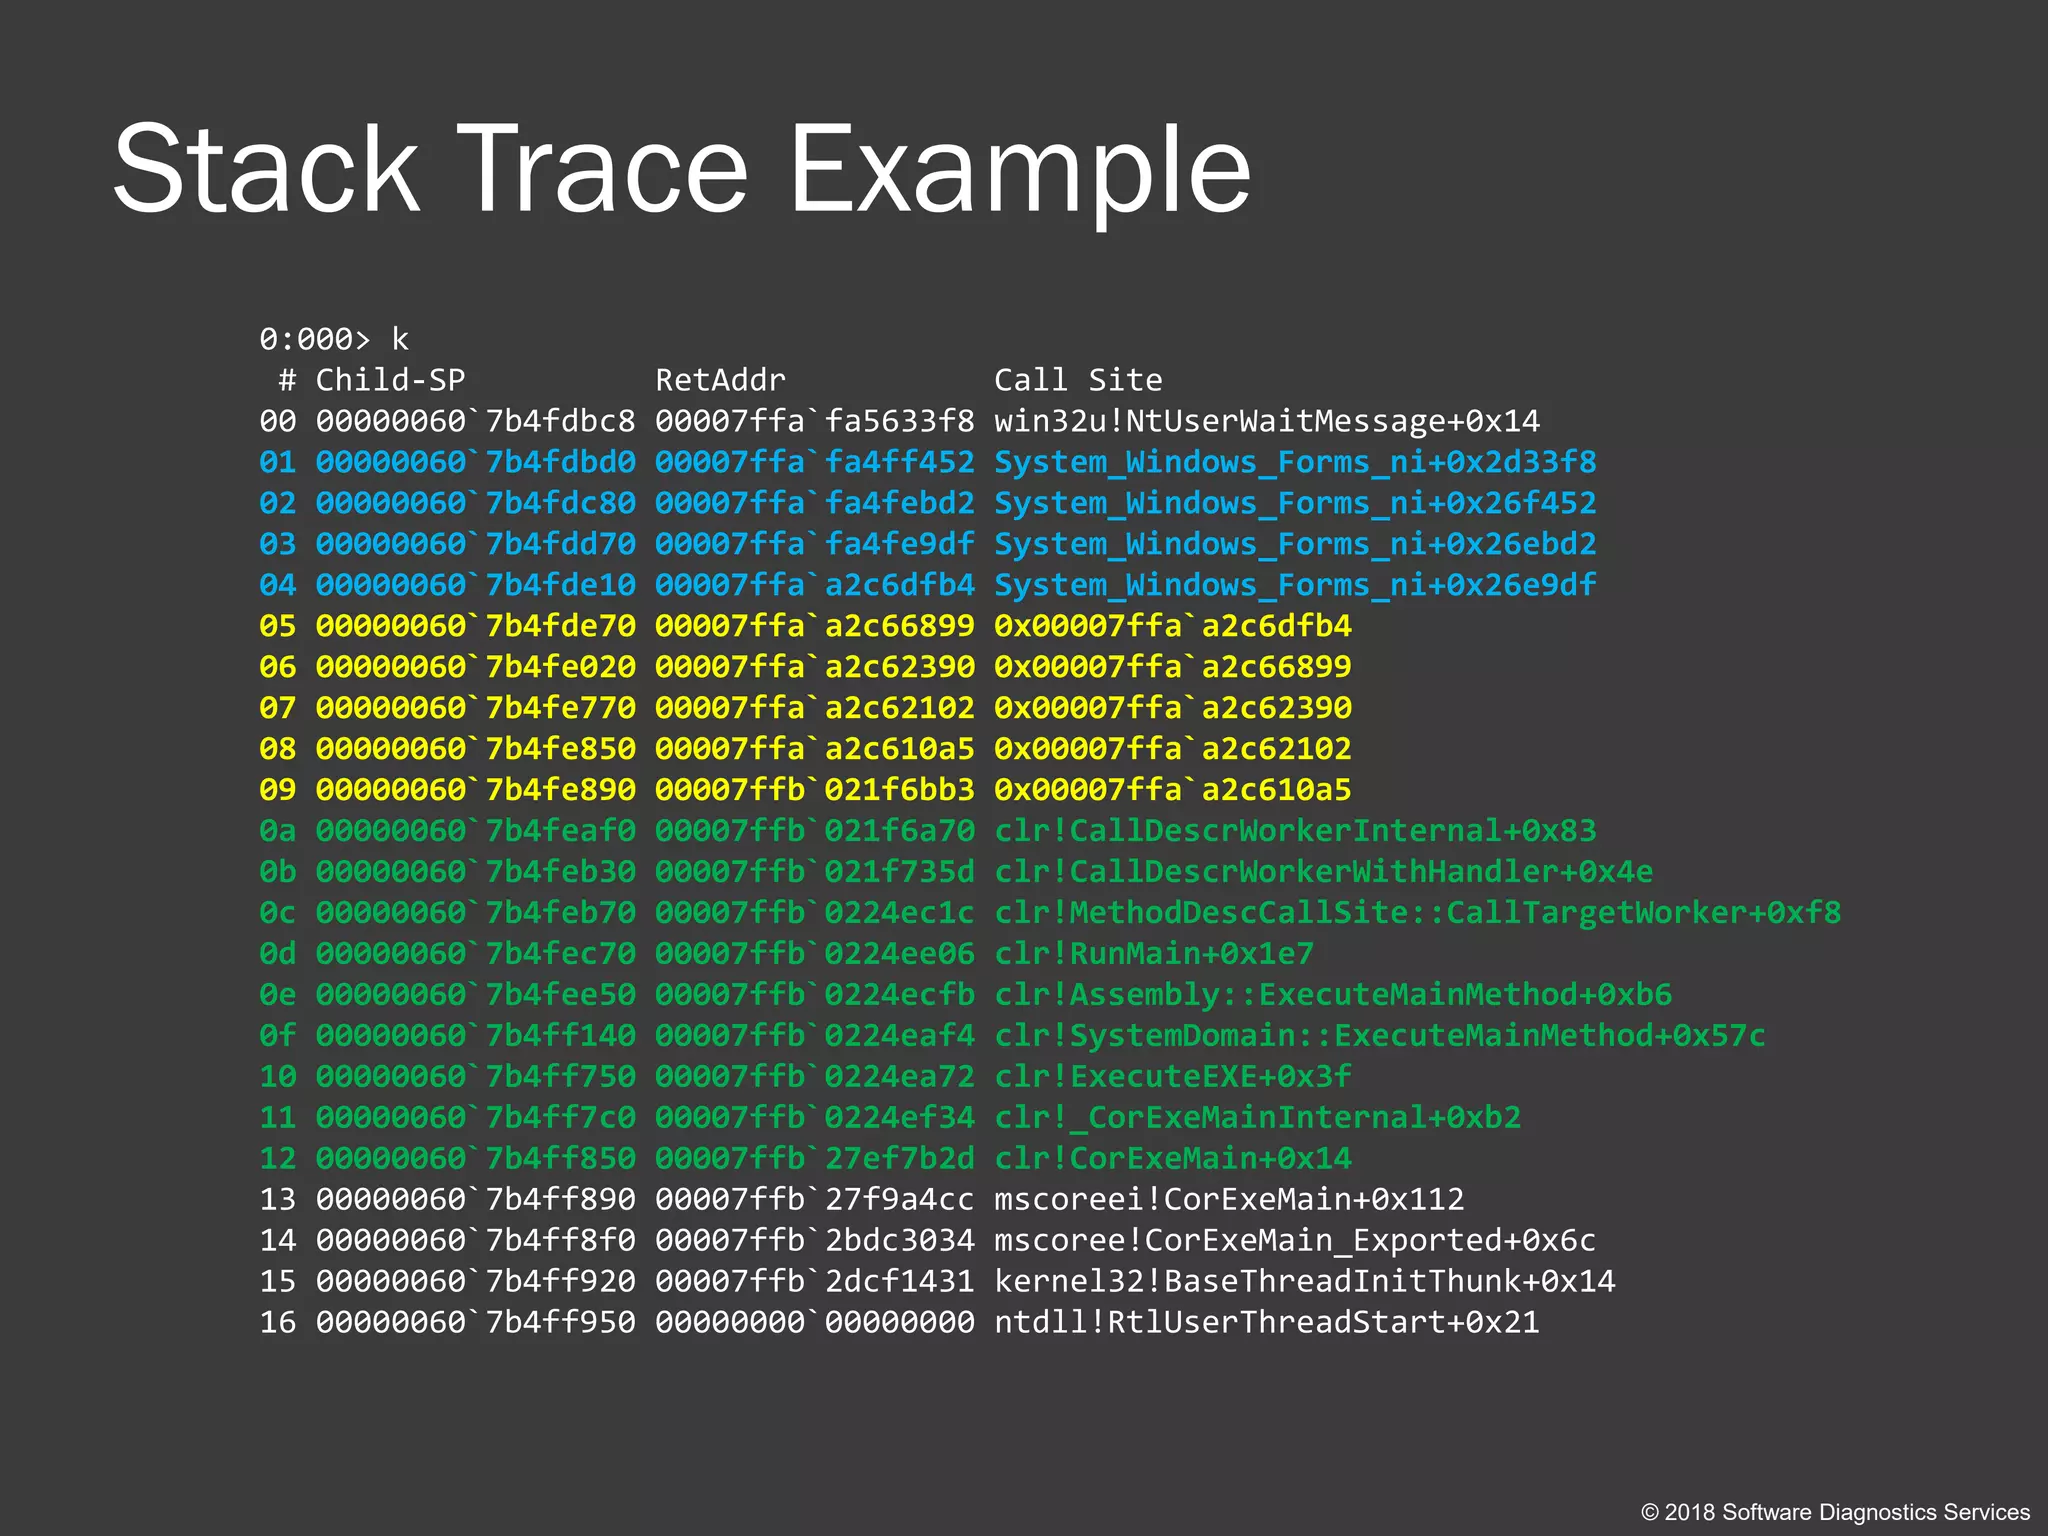
![Space Review (x86)
© 2018 Software Diagnostics Services
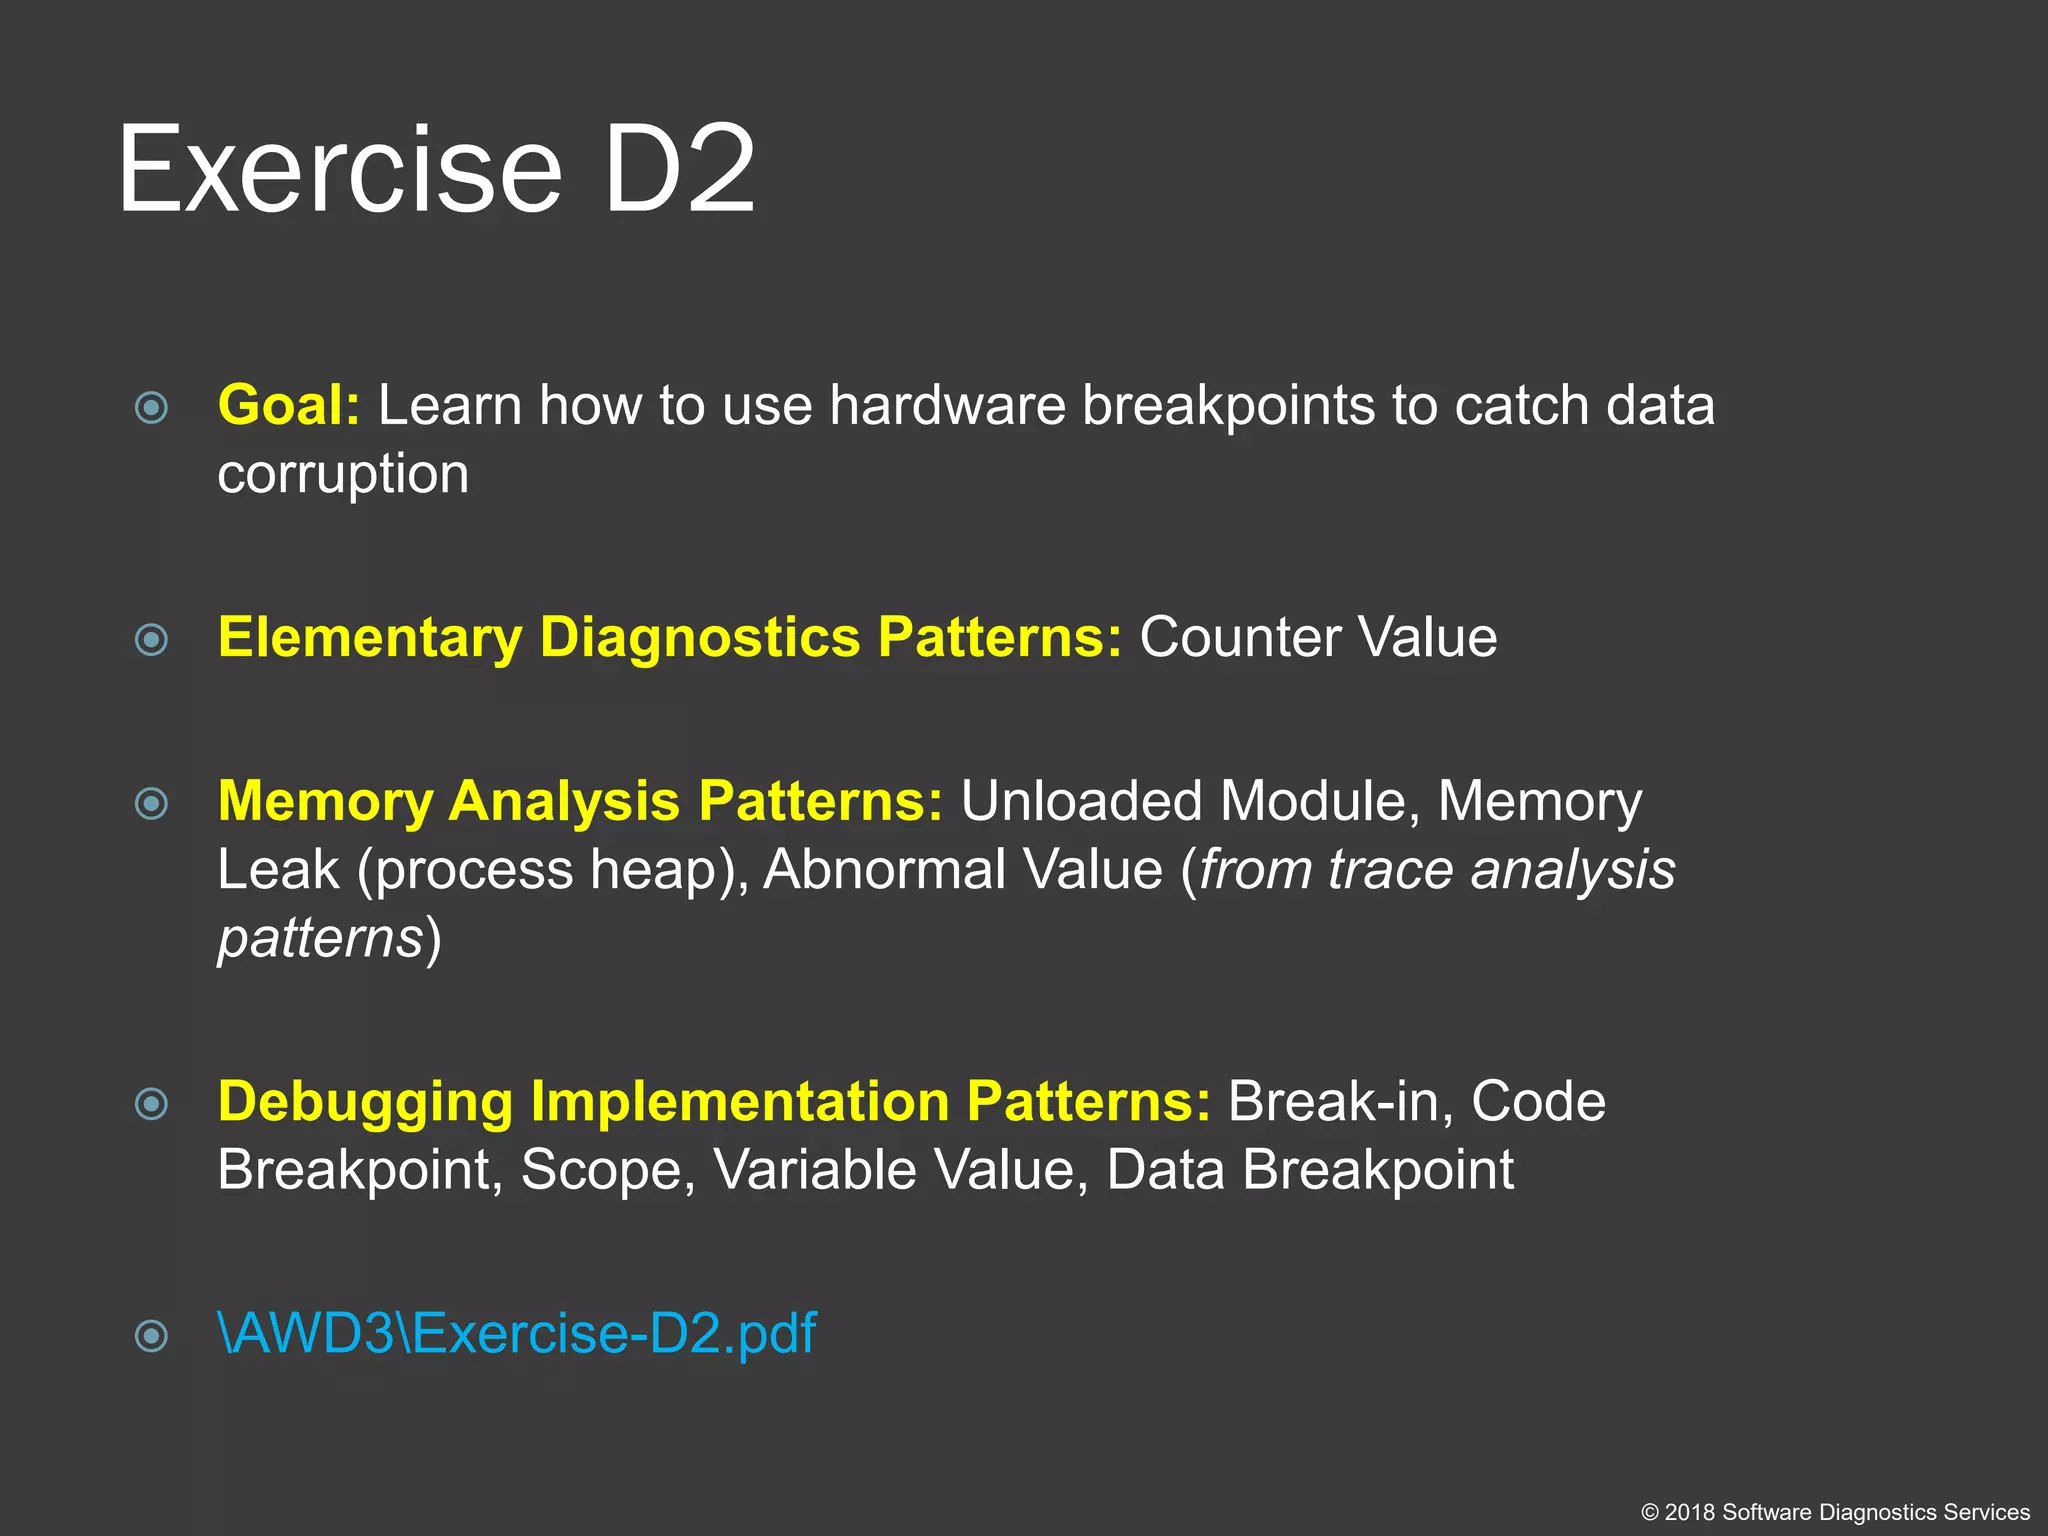
User Space
Kernel Space
0: kd> lmk
start end module name
80200000 8020a000 BATTC
8020a000 8020c900 compbatt
8020d000 80215000 msisadrv
80215000 8021e000 WMILIB
8021e000 8022b000 WDFLDR
8022b000 80266000 CLFS
80266000 8026e000 BOOTVID
[...]
81800000 81ba1000 nt
81ba1000 81bd5000 hal
[...]
87eb3000 87ed6000 ndiswan
87ed6000 87ee1000 ndistapi
87ee1000 87ef8000 rasl2tp
87ef8000 87f03000 TDI
[...]
937b4000 93800000 srv
9446d000 94480000 dump_LSI_SCSI
96ca1000 96cc9000 fastfat
00000000
7fffffff
80000000
ffffffff
hal
driver
nt
App
ntdll
MyDLL](https://image.slidesharecdn.com/accelerated-windows-debugging3-version2-public-180916100501/75/Accelerated-Windows-Debugging-3-training-public-slides-43-2048.jpg)
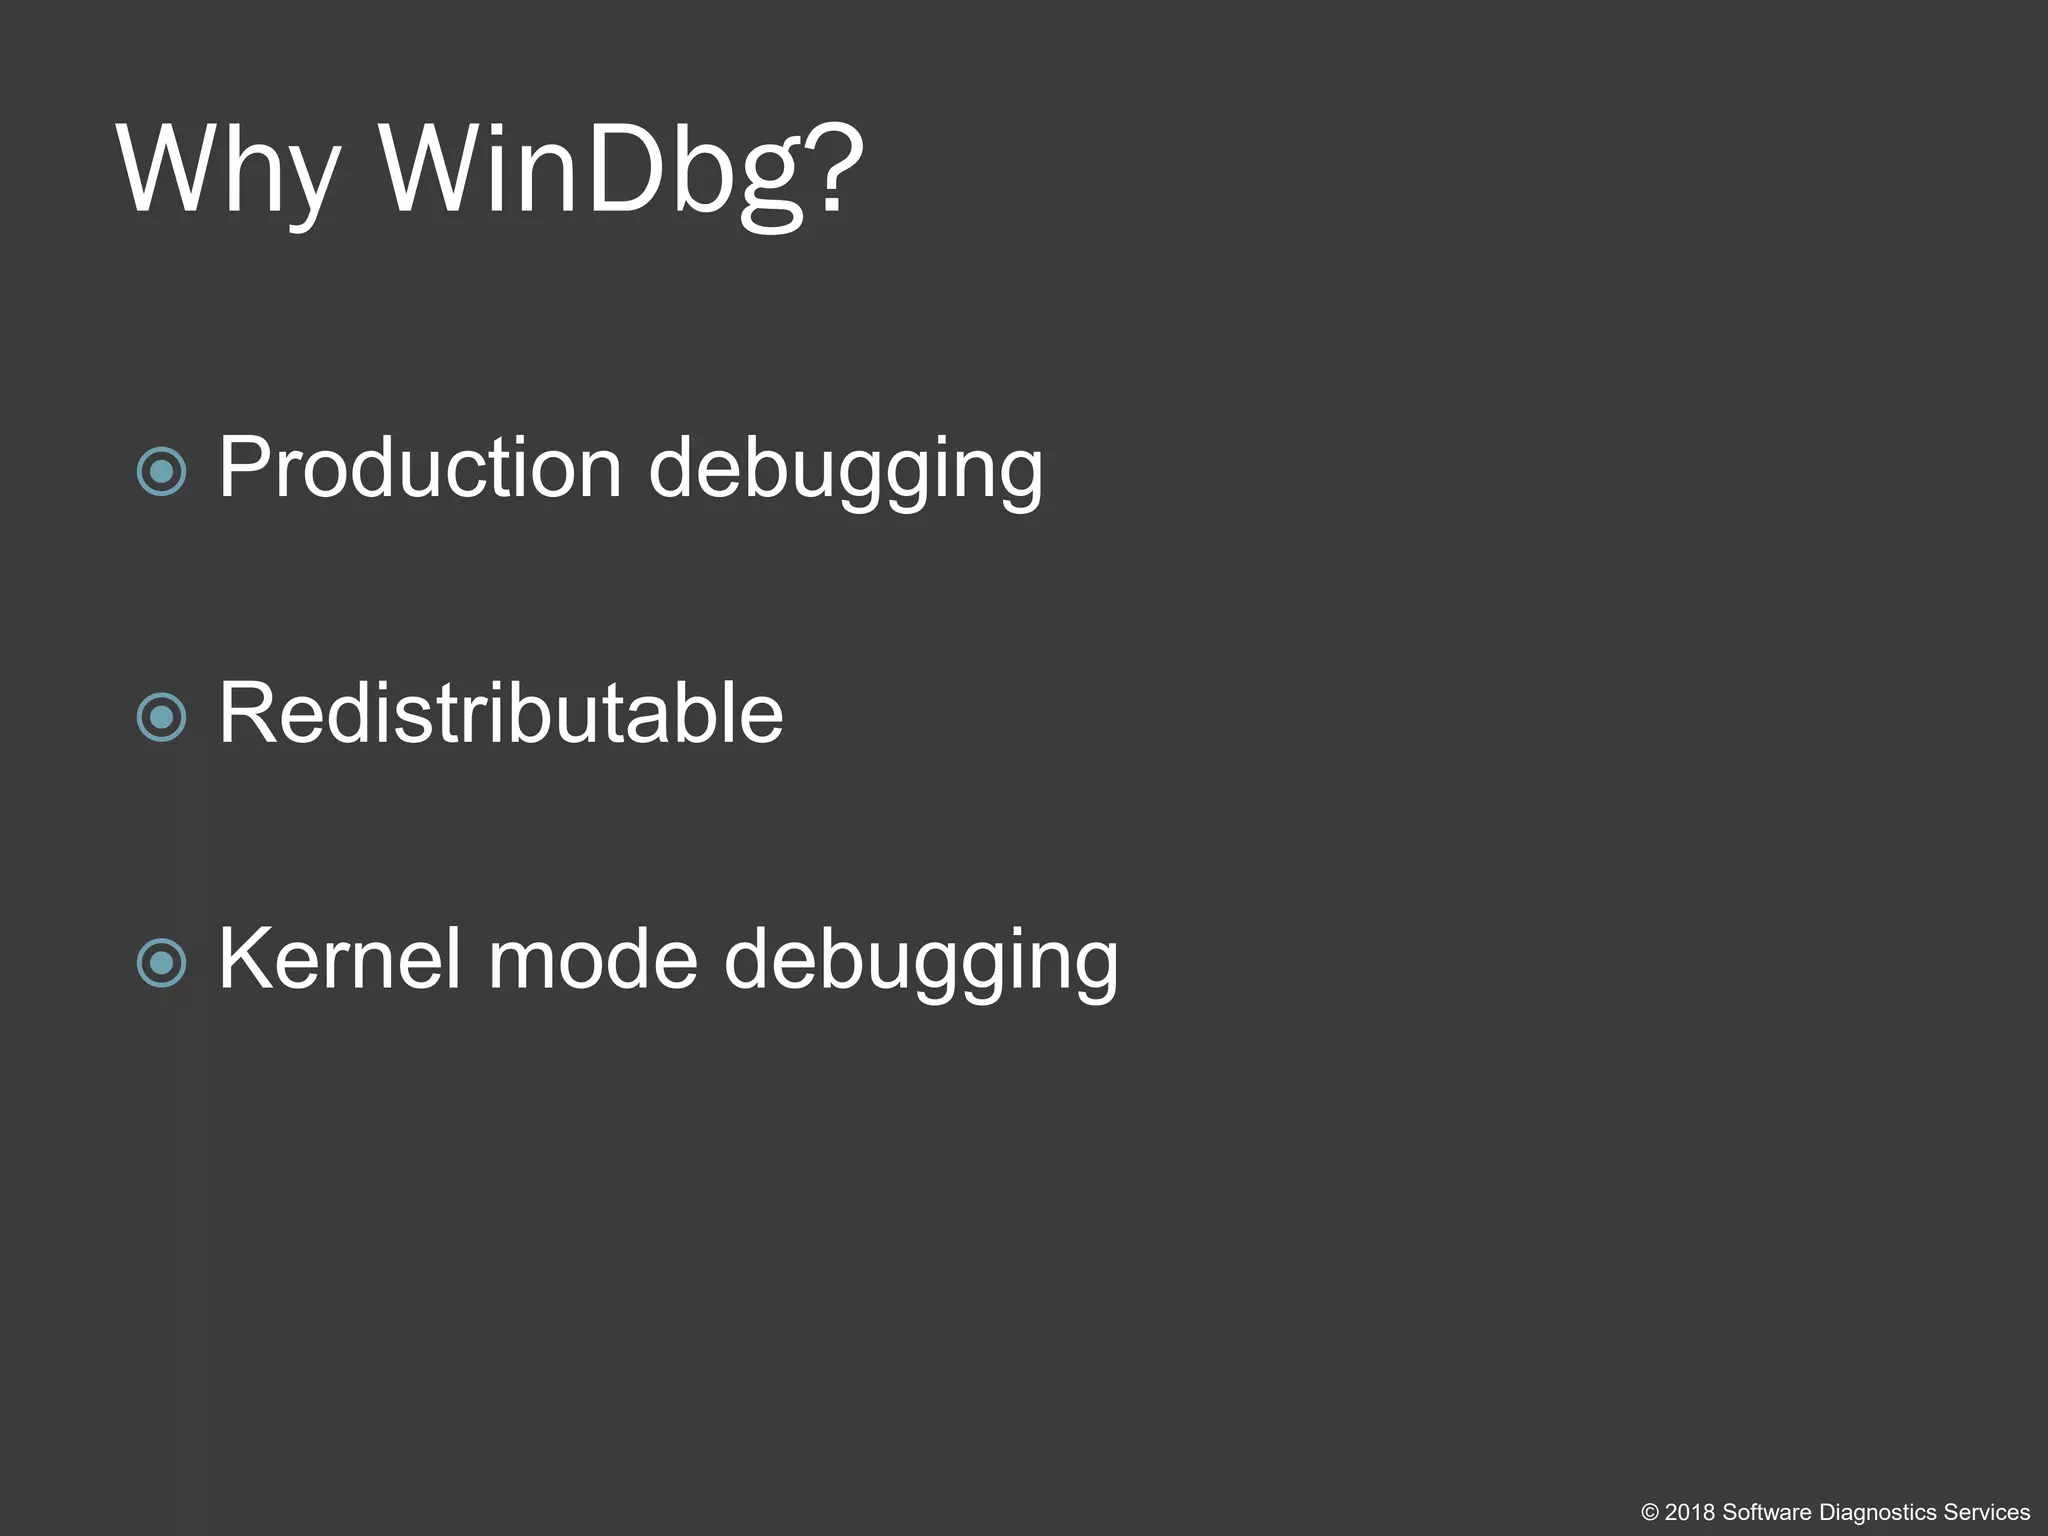
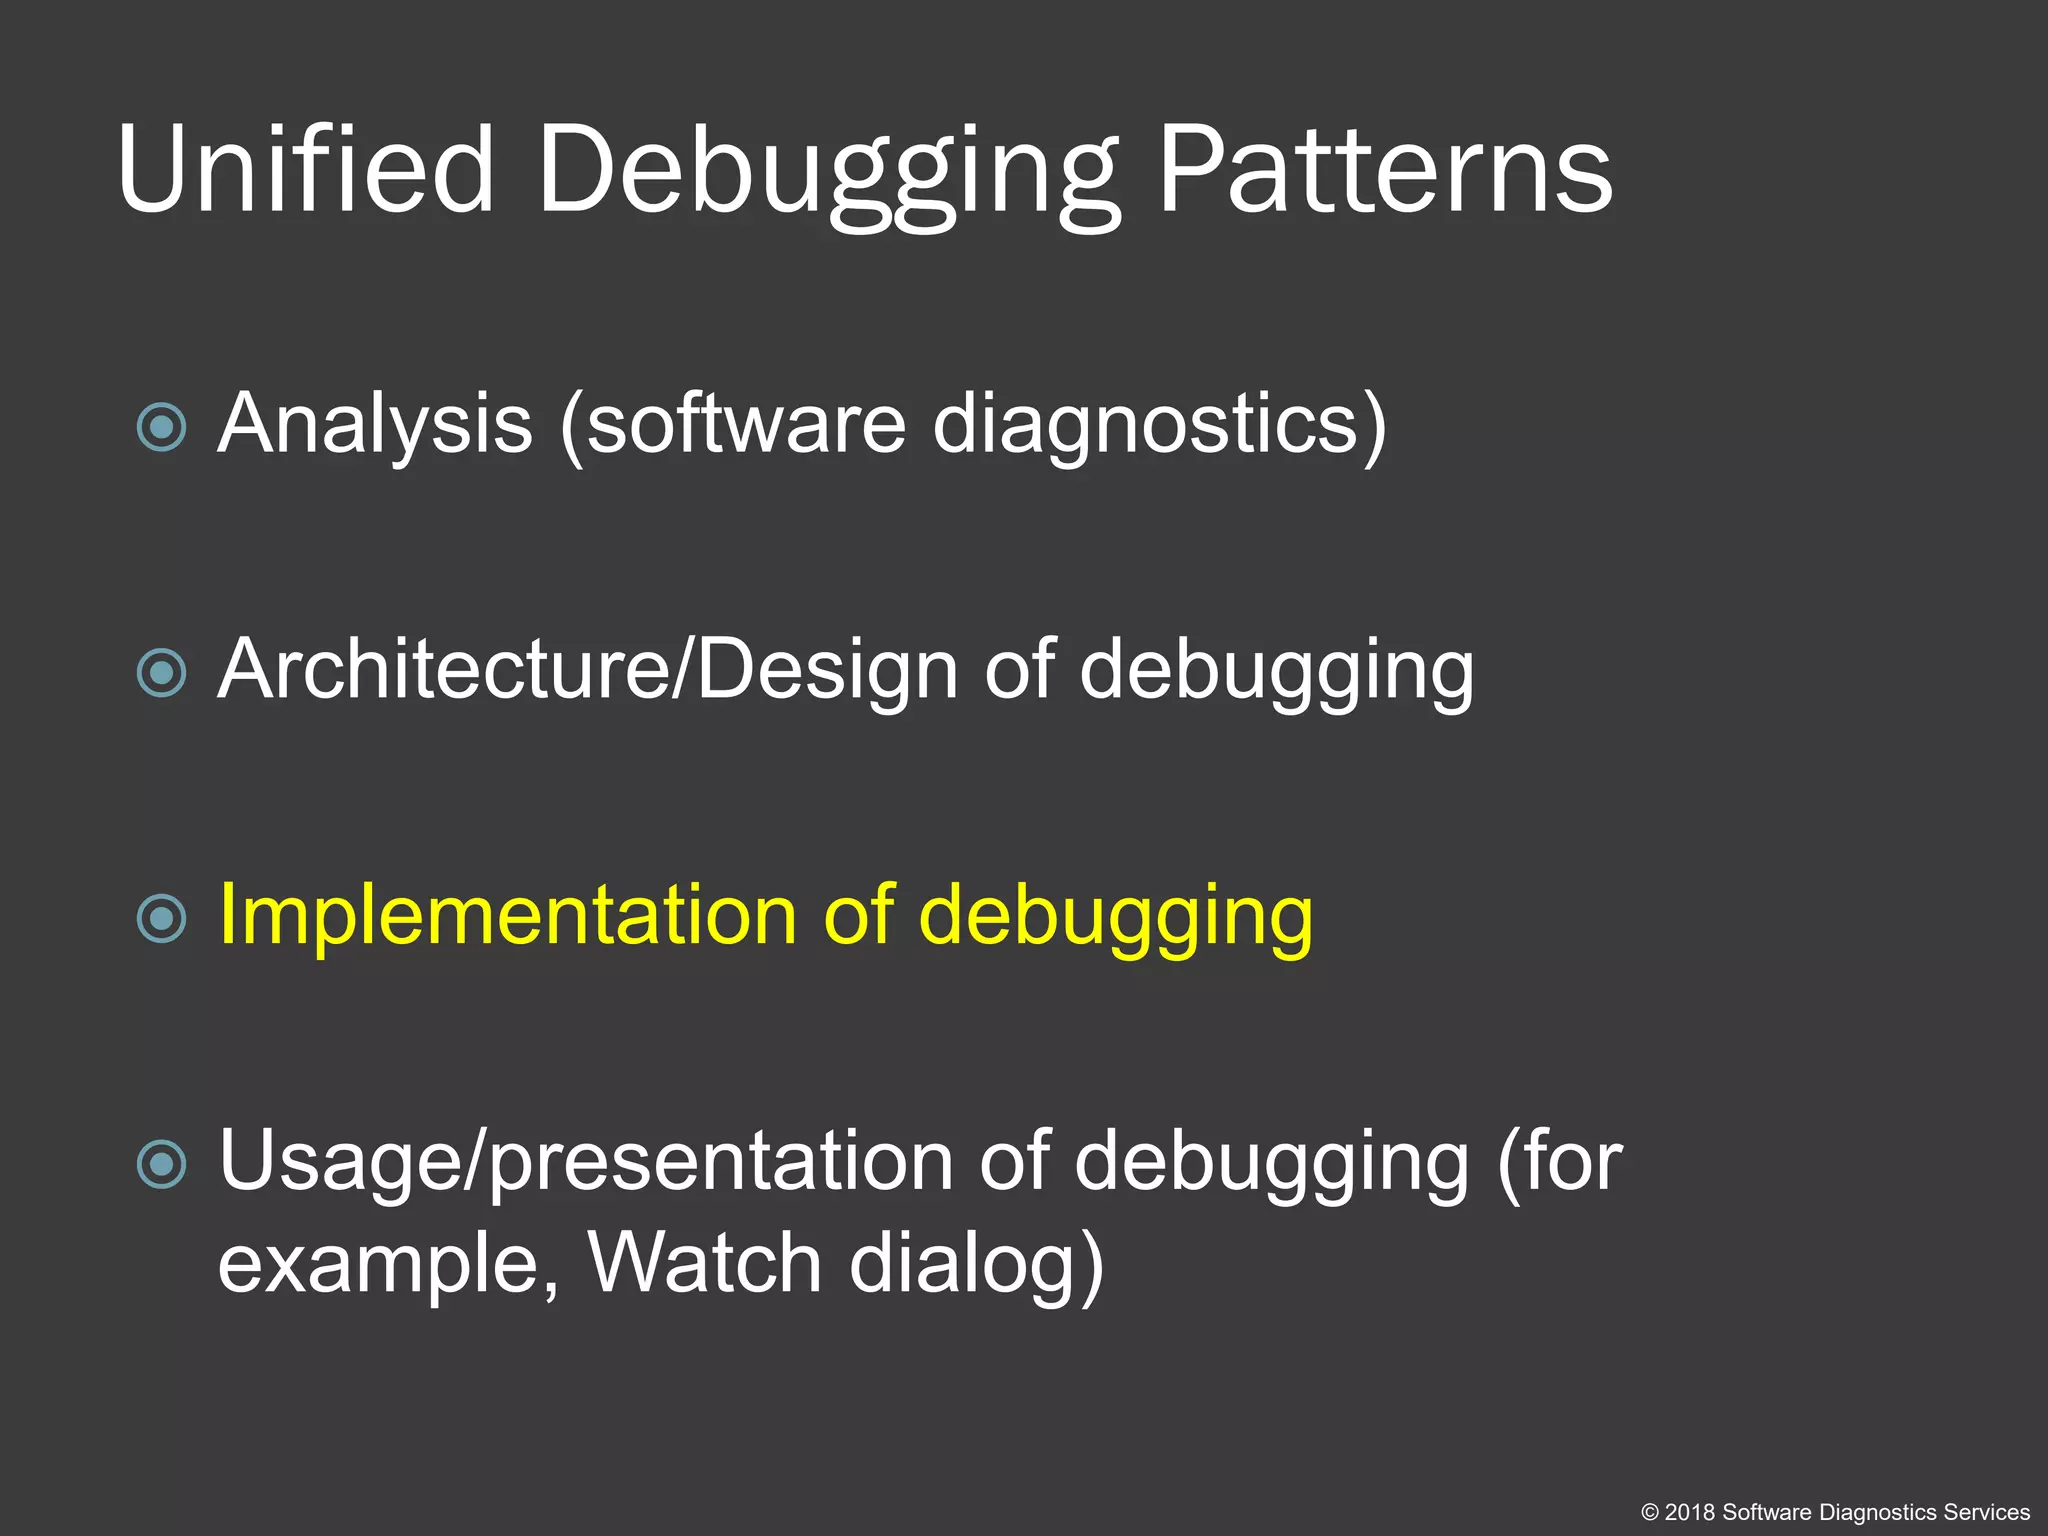
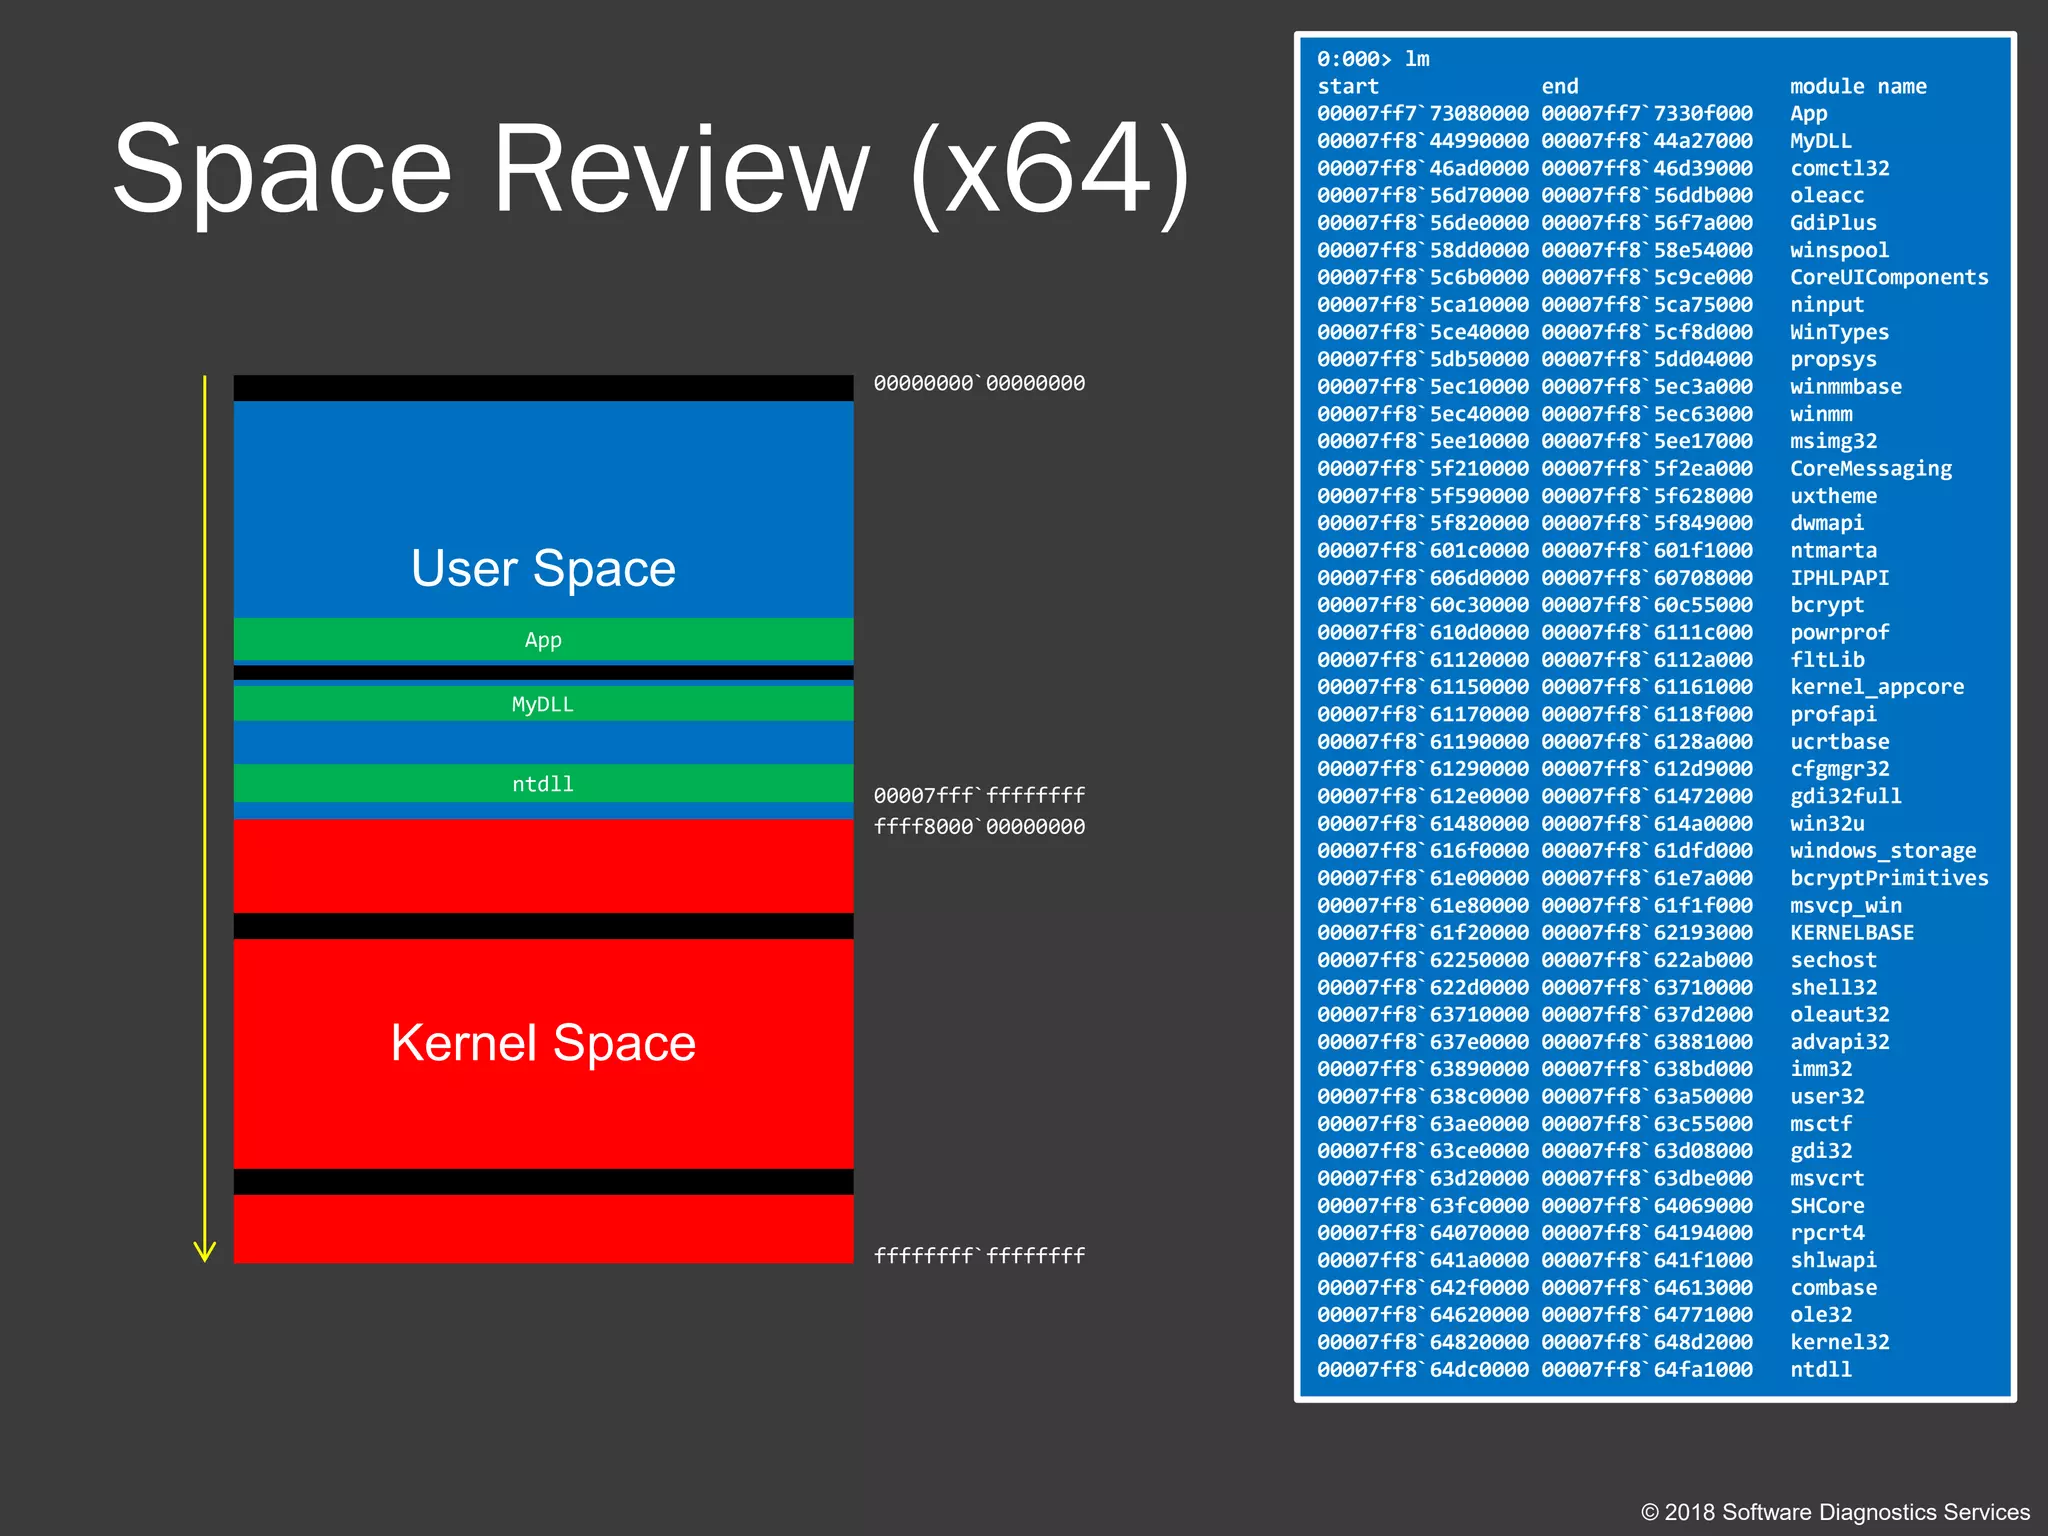
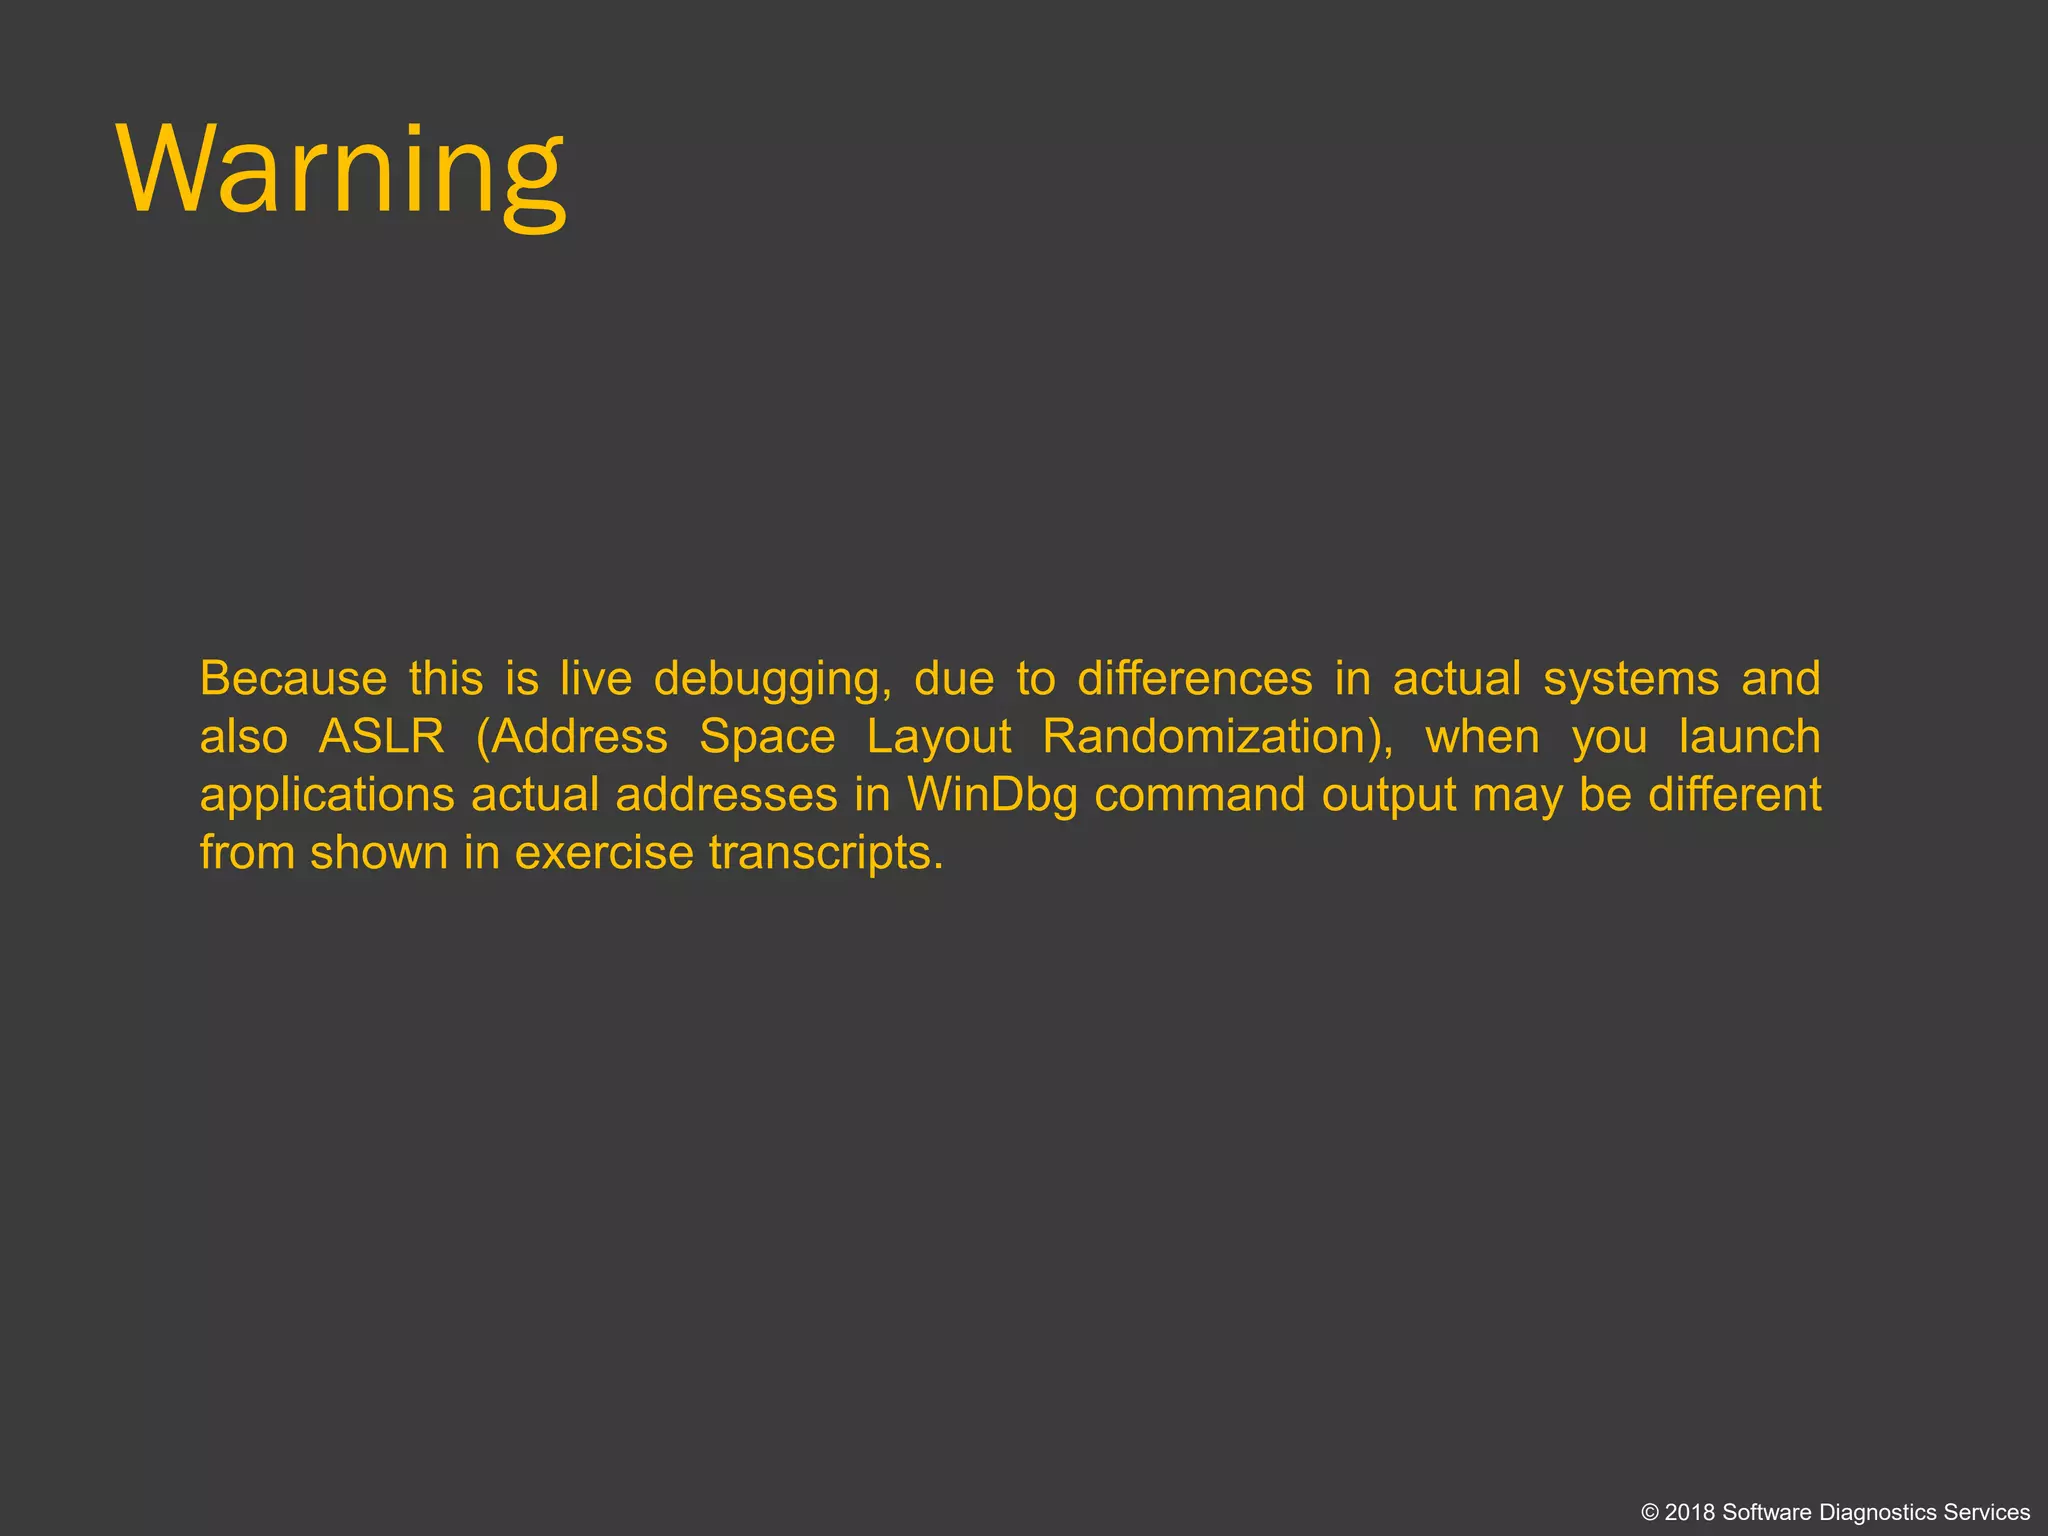
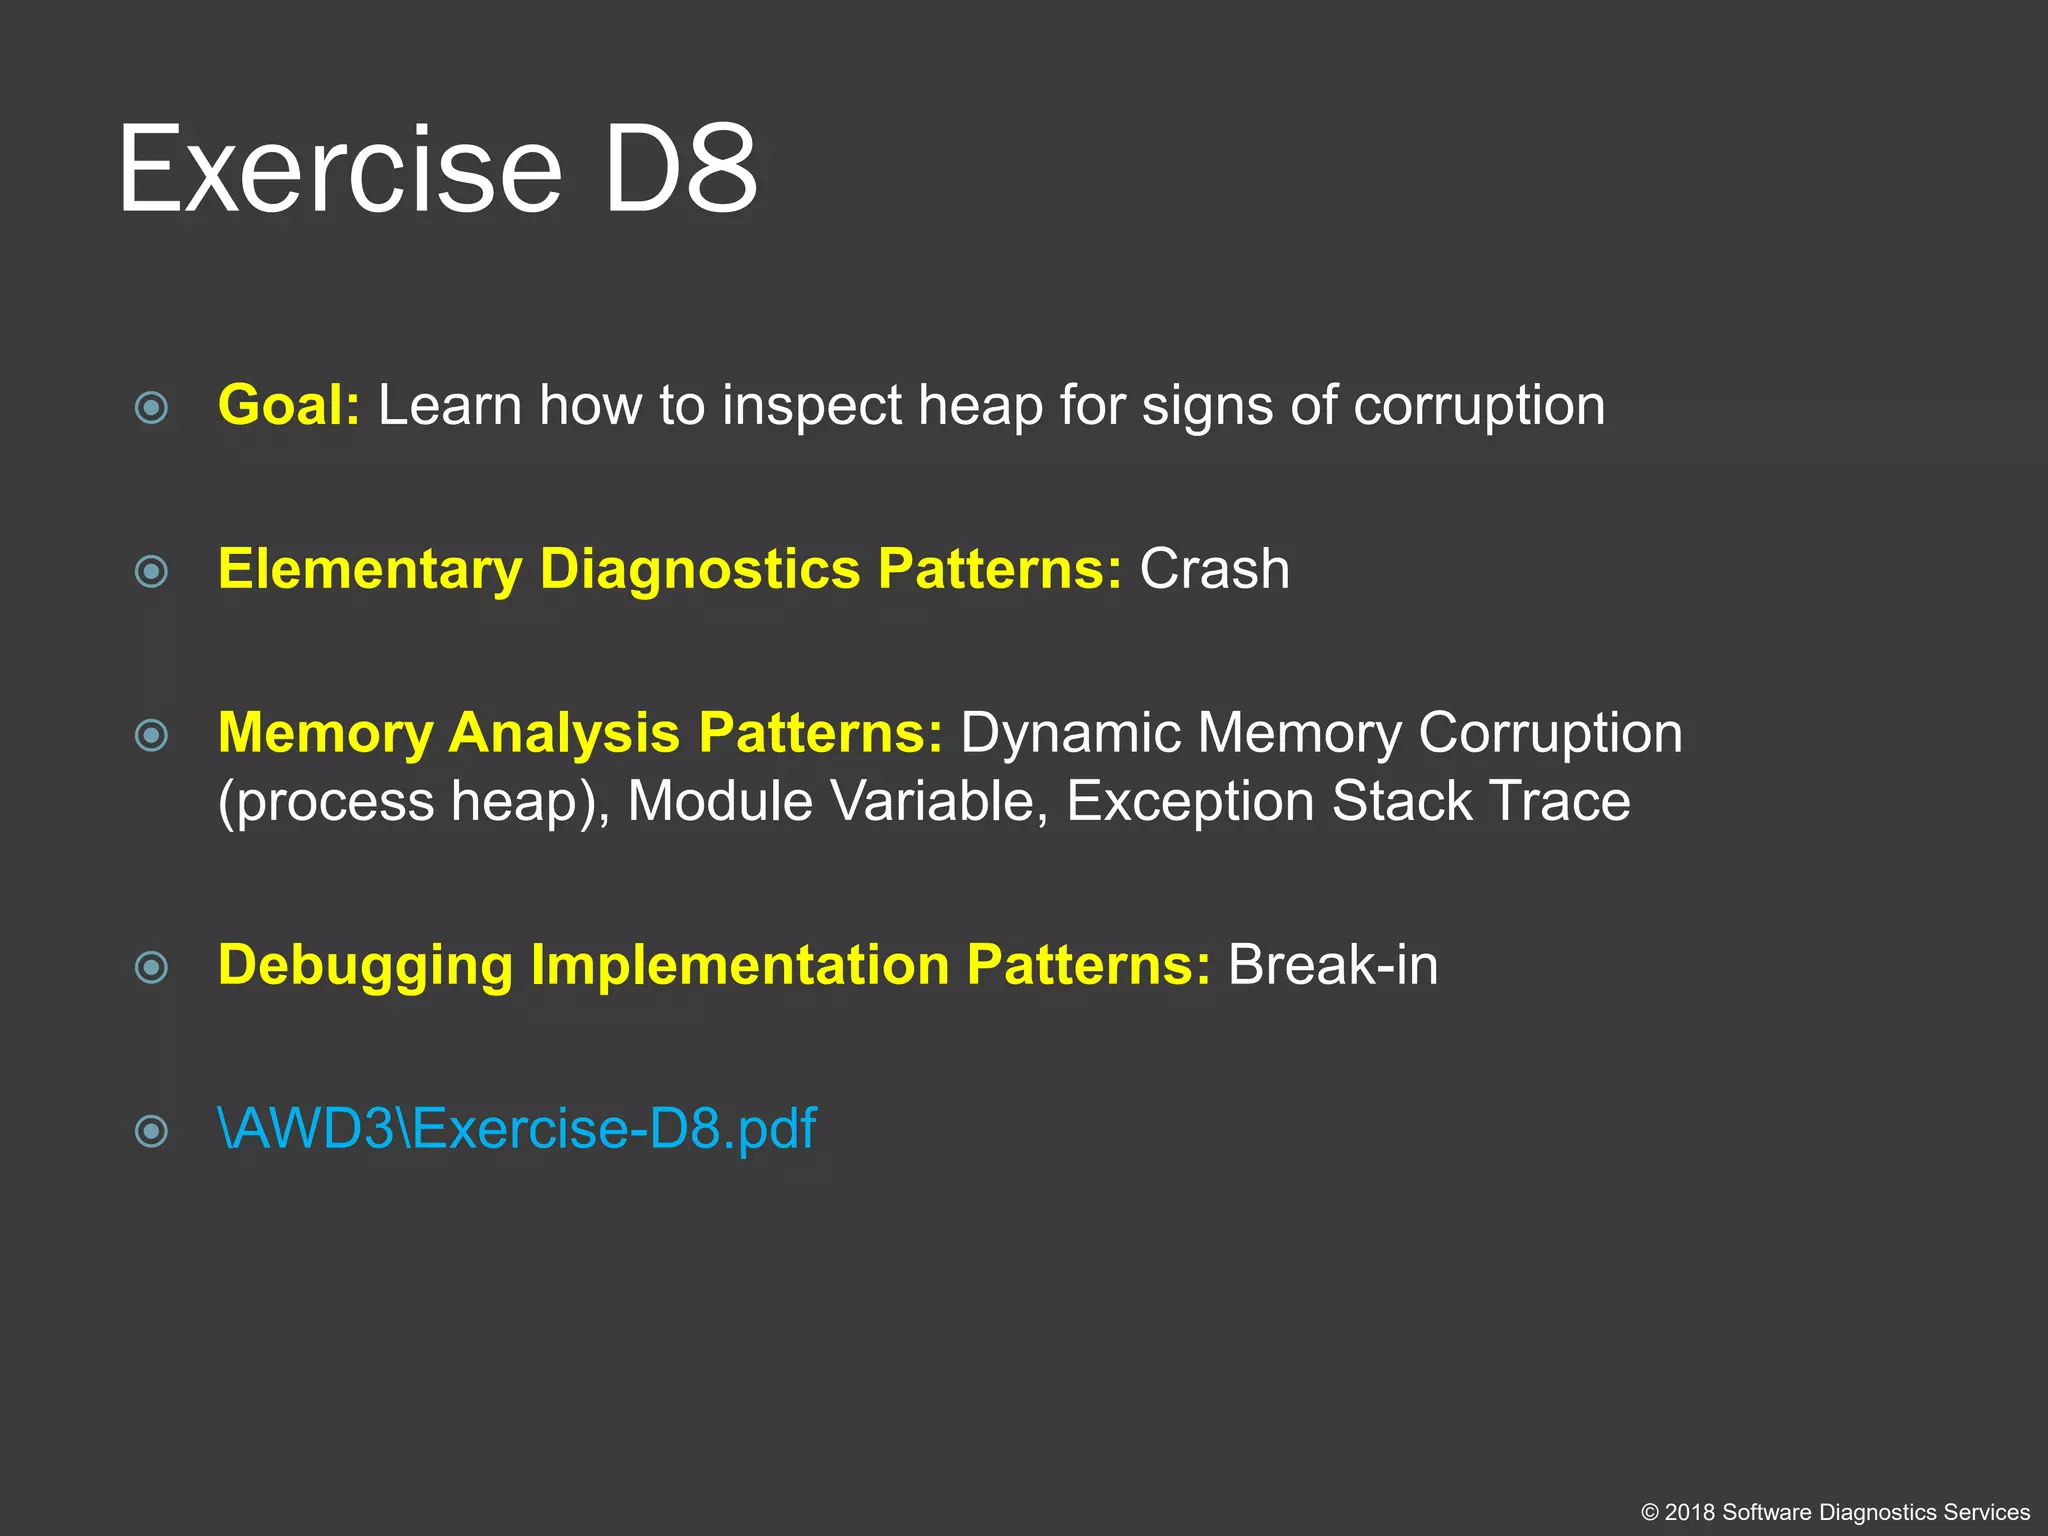
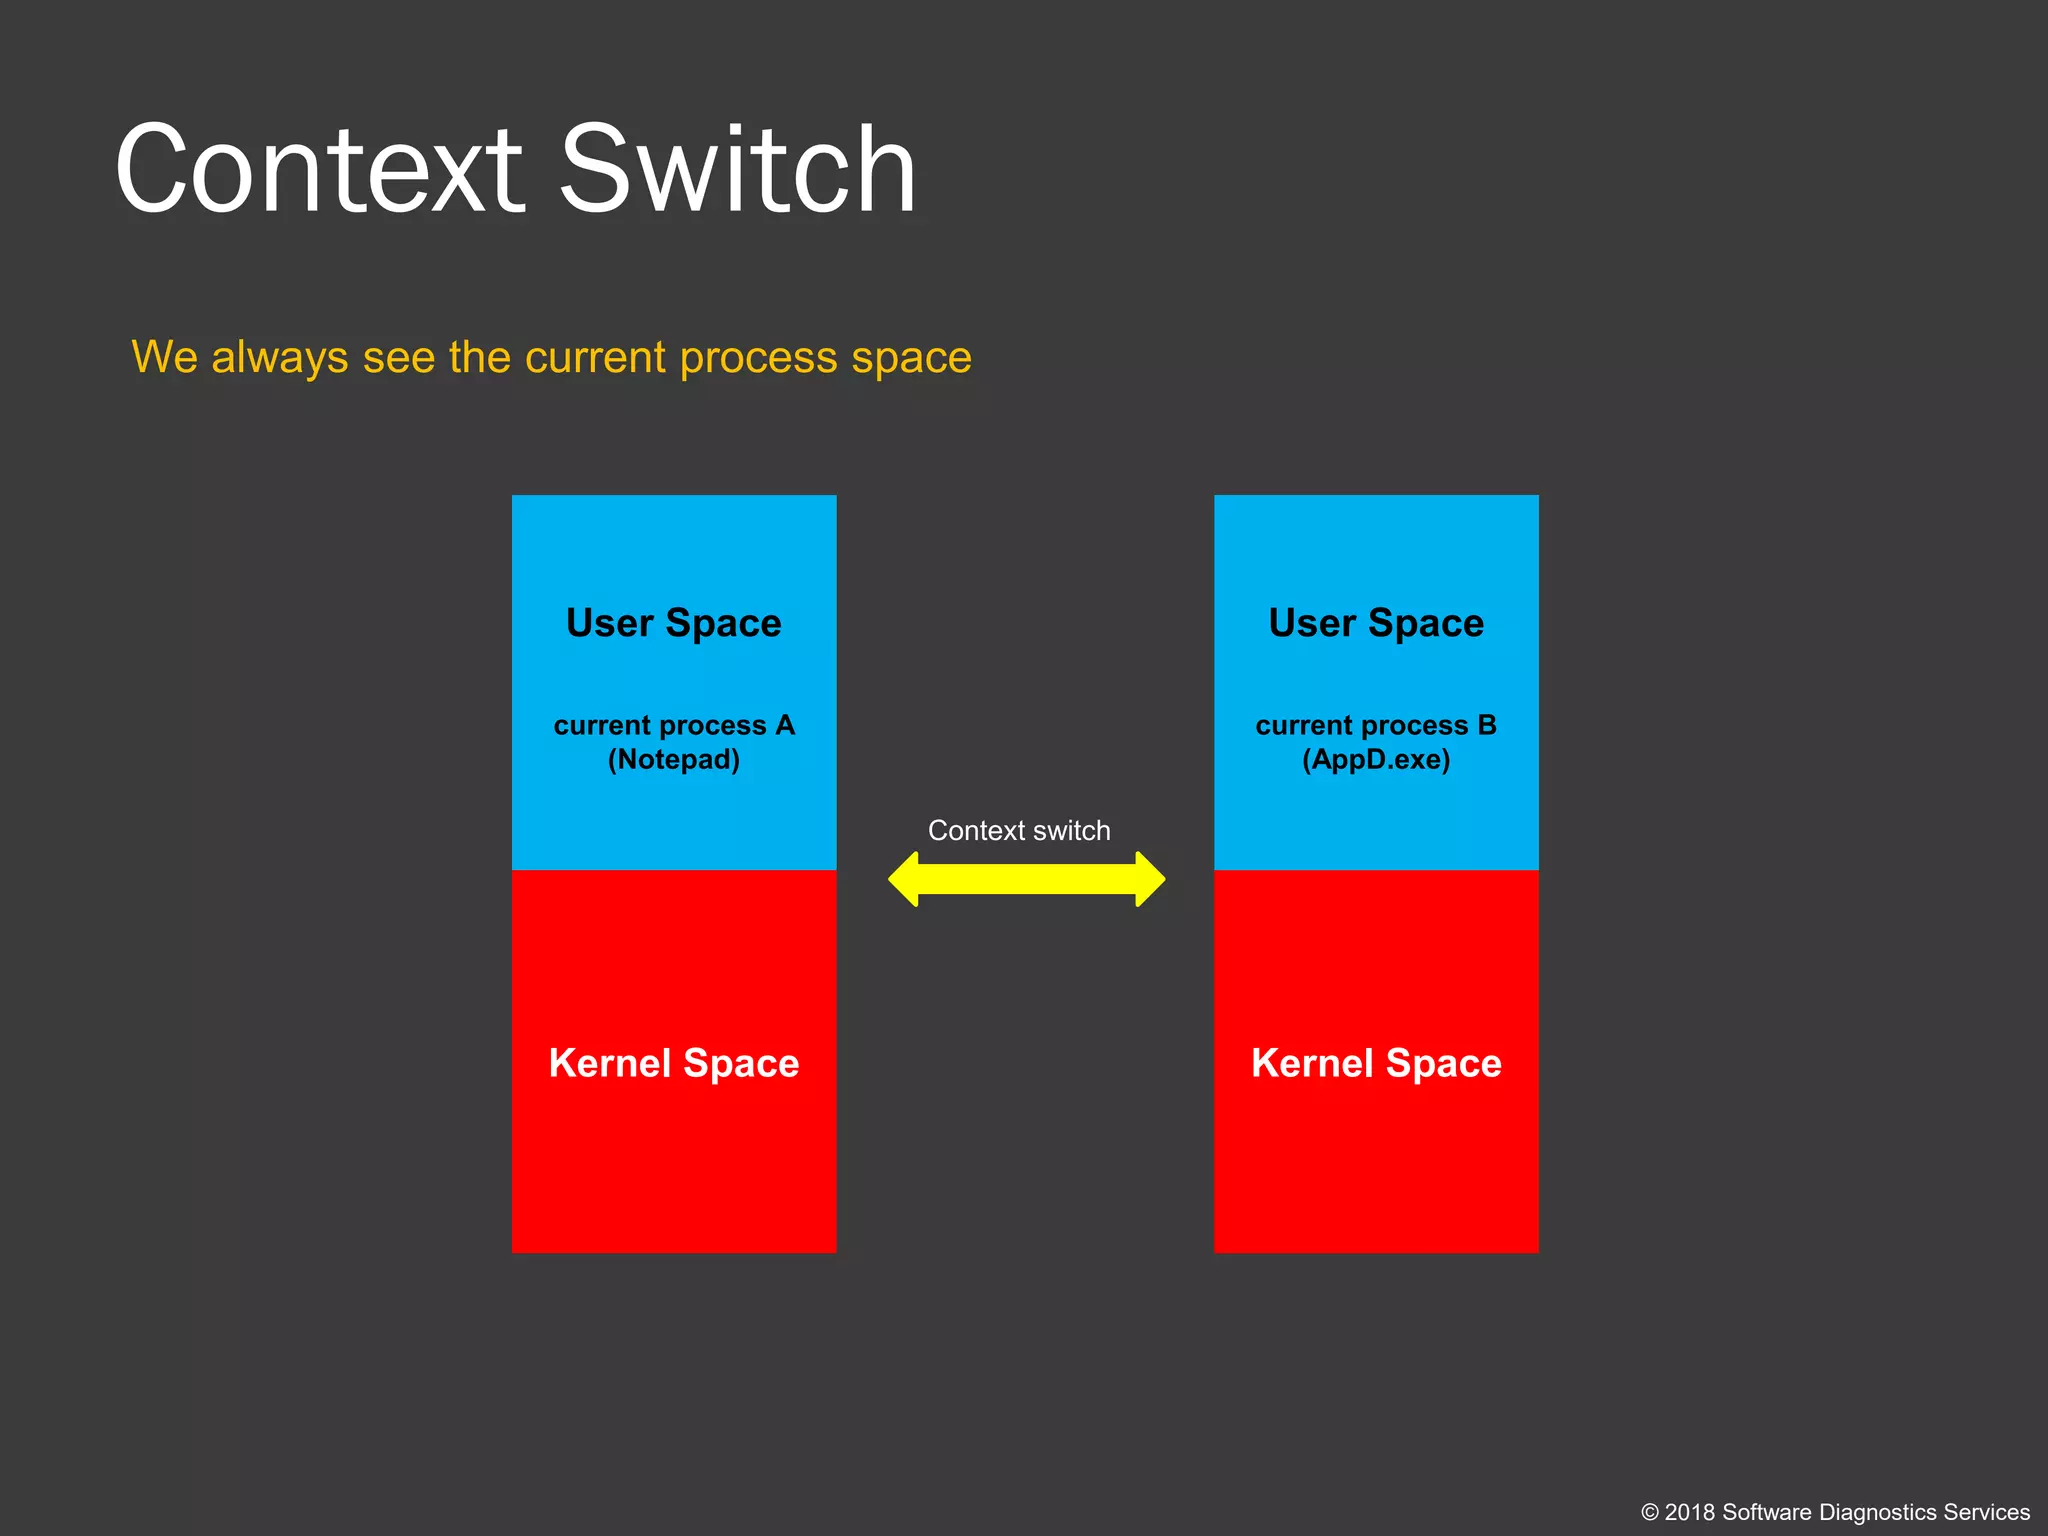
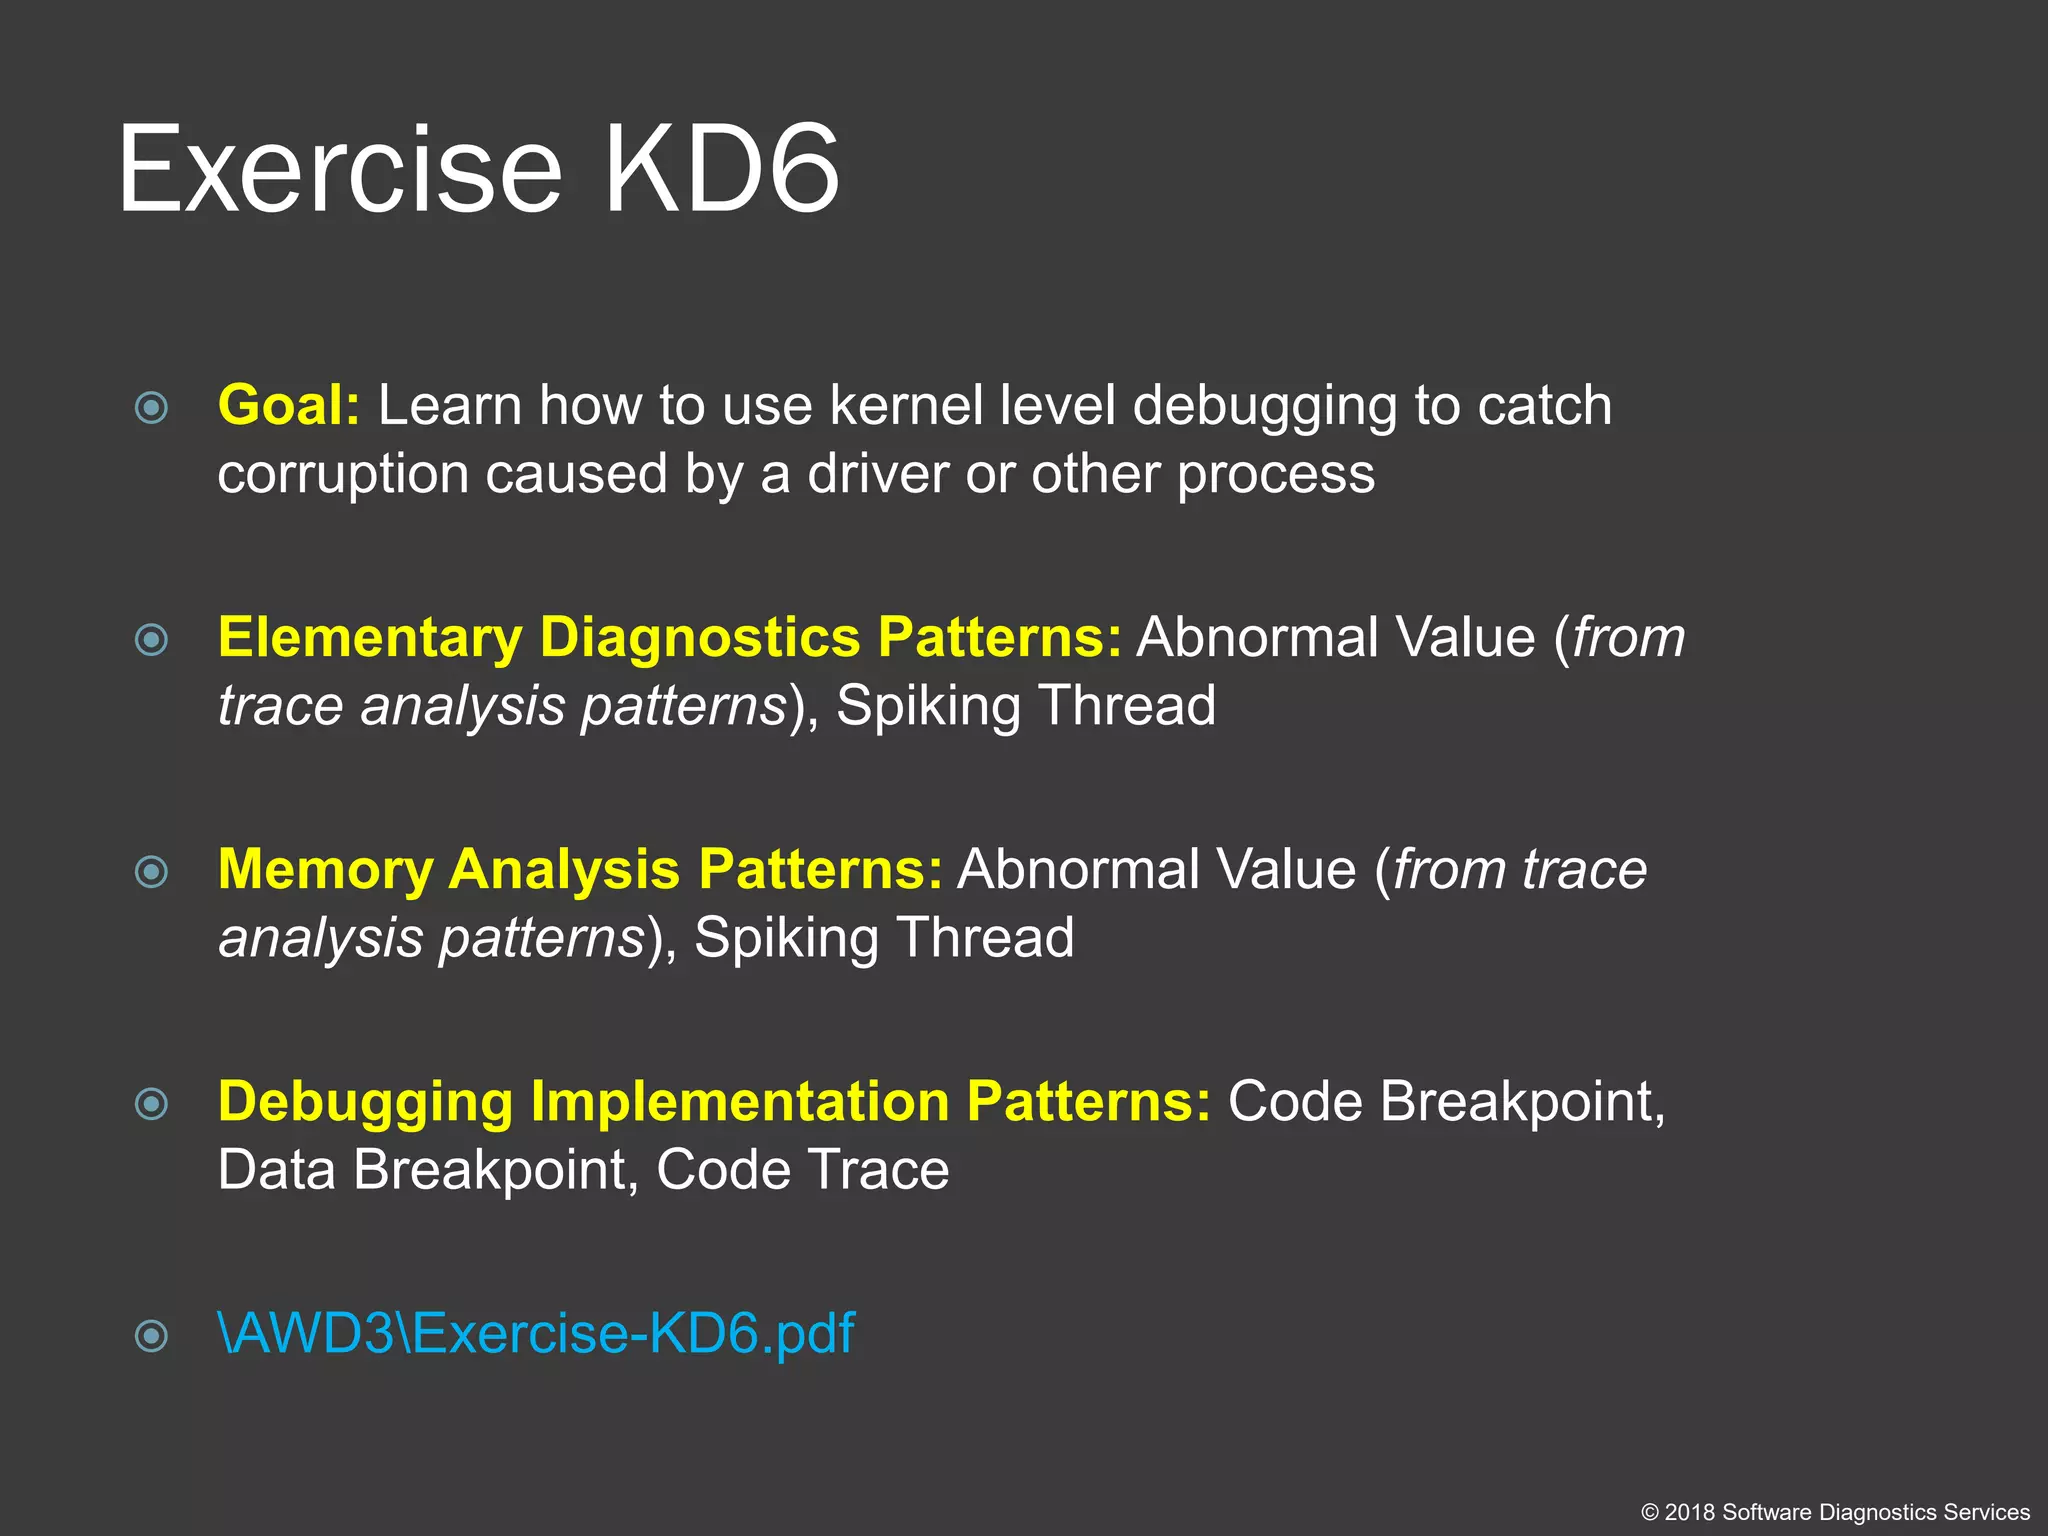
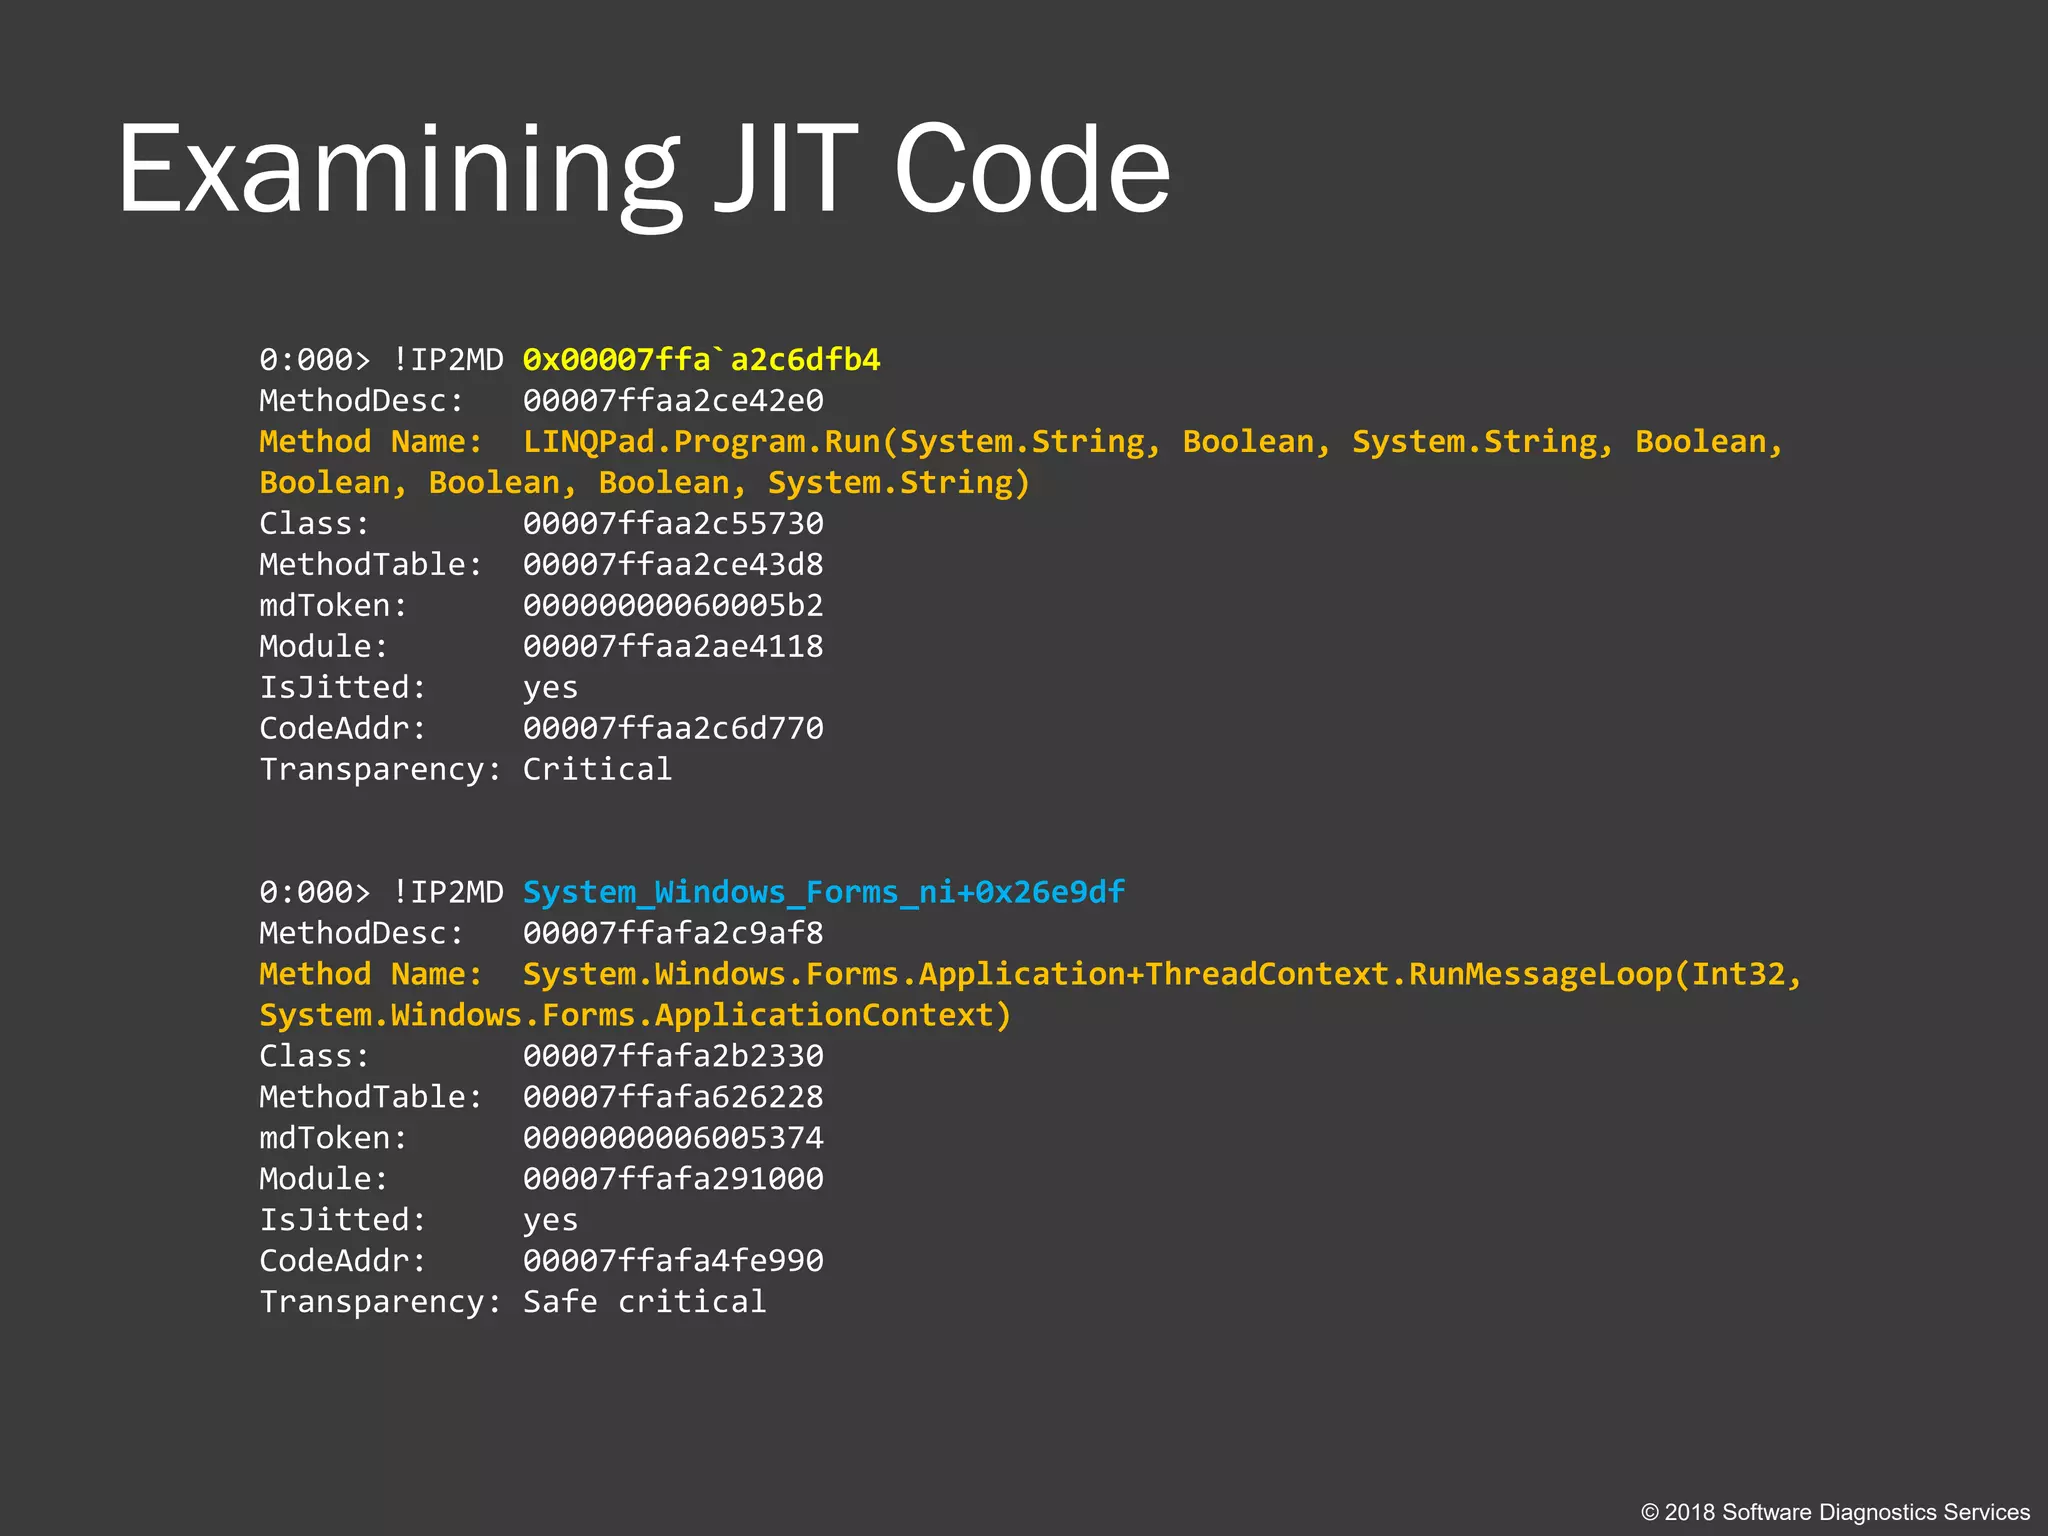
![Space Review (x64)
© 2018 Software Diagnostics Services
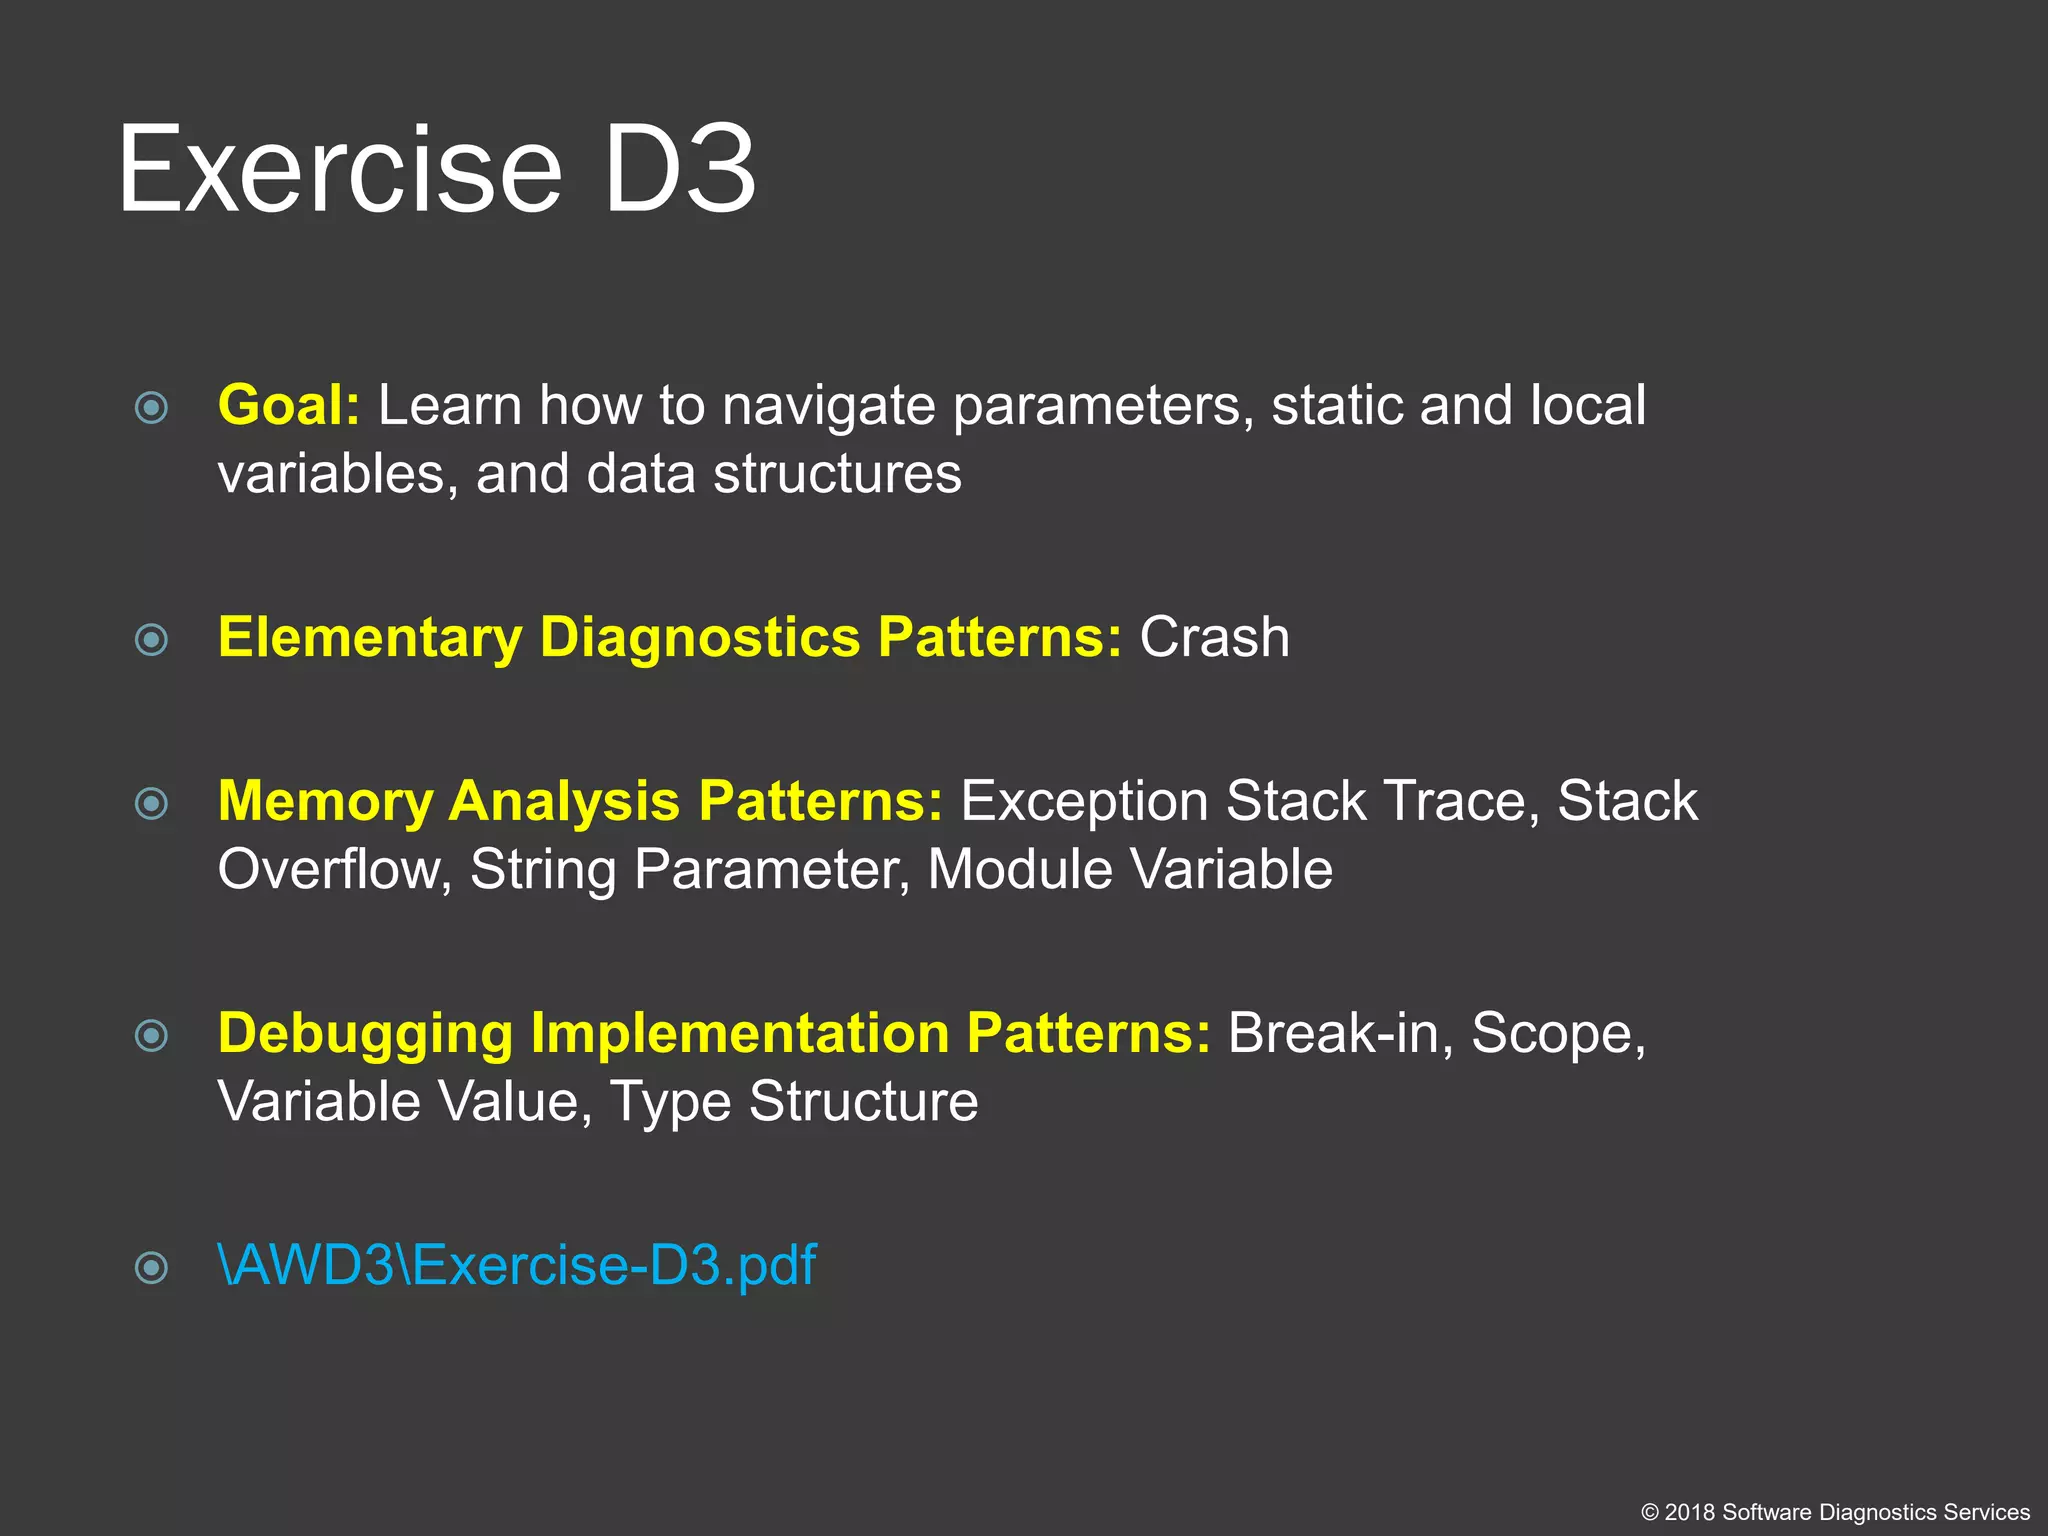
Kernel Space
0: kd> lmk
start end module name
ffffd414`7bc00000 ffffd414`7bf90000 win32kfull
ffffd414`7bf90000 ffffd414`7c1c4000 win32kbase
ffffd414`7c1d0000 ffffd414`7c20f000 cdd
ffffd414`7c730000 ffffd414`7c7ac000 win32k
fffff802`1cc05000 fffff802`1d566000 nt
fffff802`1d566000 fffff802`1d5f2000 hal
fffff802`1d800000 fffff802`1d80b000 kd
fffff803`9f200000 fffff803`9f264000 CLFS
fffff803`9f270000 fffff803`9f294000 tm
fffff803`9f2a0000 fffff803`9f2b7000 PSHED
fffff803`9f2c0000 fffff803`9f2cb000 BOOTVID
[...]
fffff803`a0290000 fffff803`a0534000 tcpip
fffff803`a0540000 fffff803`a05b6000 fwpkclnt
fffff803`a05c0000 fffff803`a05ed000 wfplwfs
fffff803`a05f0000 fffff803`a06ac000 fvevol
fffff803`a06b0000 fffff803`a06bb000 volume
fffff803`a06c0000 fffff803`a0727000 volsnap
fffff803`a0730000 fffff803`a077c000 rdyboost
fffff803`a0780000 fffff803`a07a4000 mup
fffff803`a07b0000 fffff803`a07c1000 iorate
fffff803`a07e0000 fffff803`a07fc000 disk
[...]
fffff803`a3020000 fffff803`a3028000 driver
fffff803`a3040000 fffff803`a304f000 dump_diskdump
fffff803`a3070000 fffff803`a308f000 dump_LSI_SAS
fffff803`a30b0000 fffff803`a30cd000 dump_dumpfve
fffff803`a3280000 fffff803`a3346000 dxgmms2
fffff803`a3350000 fffff803`a3398000 WUDFRd
fffff803`a33a0000 fffff803`a33c7000 luafv
fffff803`a33d0000 fffff803`a33f8000 wcifs
ffffffff`ffffffff
nt
driver
hal
User Space
00000000`00000000
00007fff`ffffffff
ffff8000`00000000
ntdll
App
MyDLL](https://image.slidesharecdn.com/accelerated-windows-debugging3-version2-public-180916100501/75/Accelerated-Windows-Debugging-3-training-public-slides-44-2048.jpg)


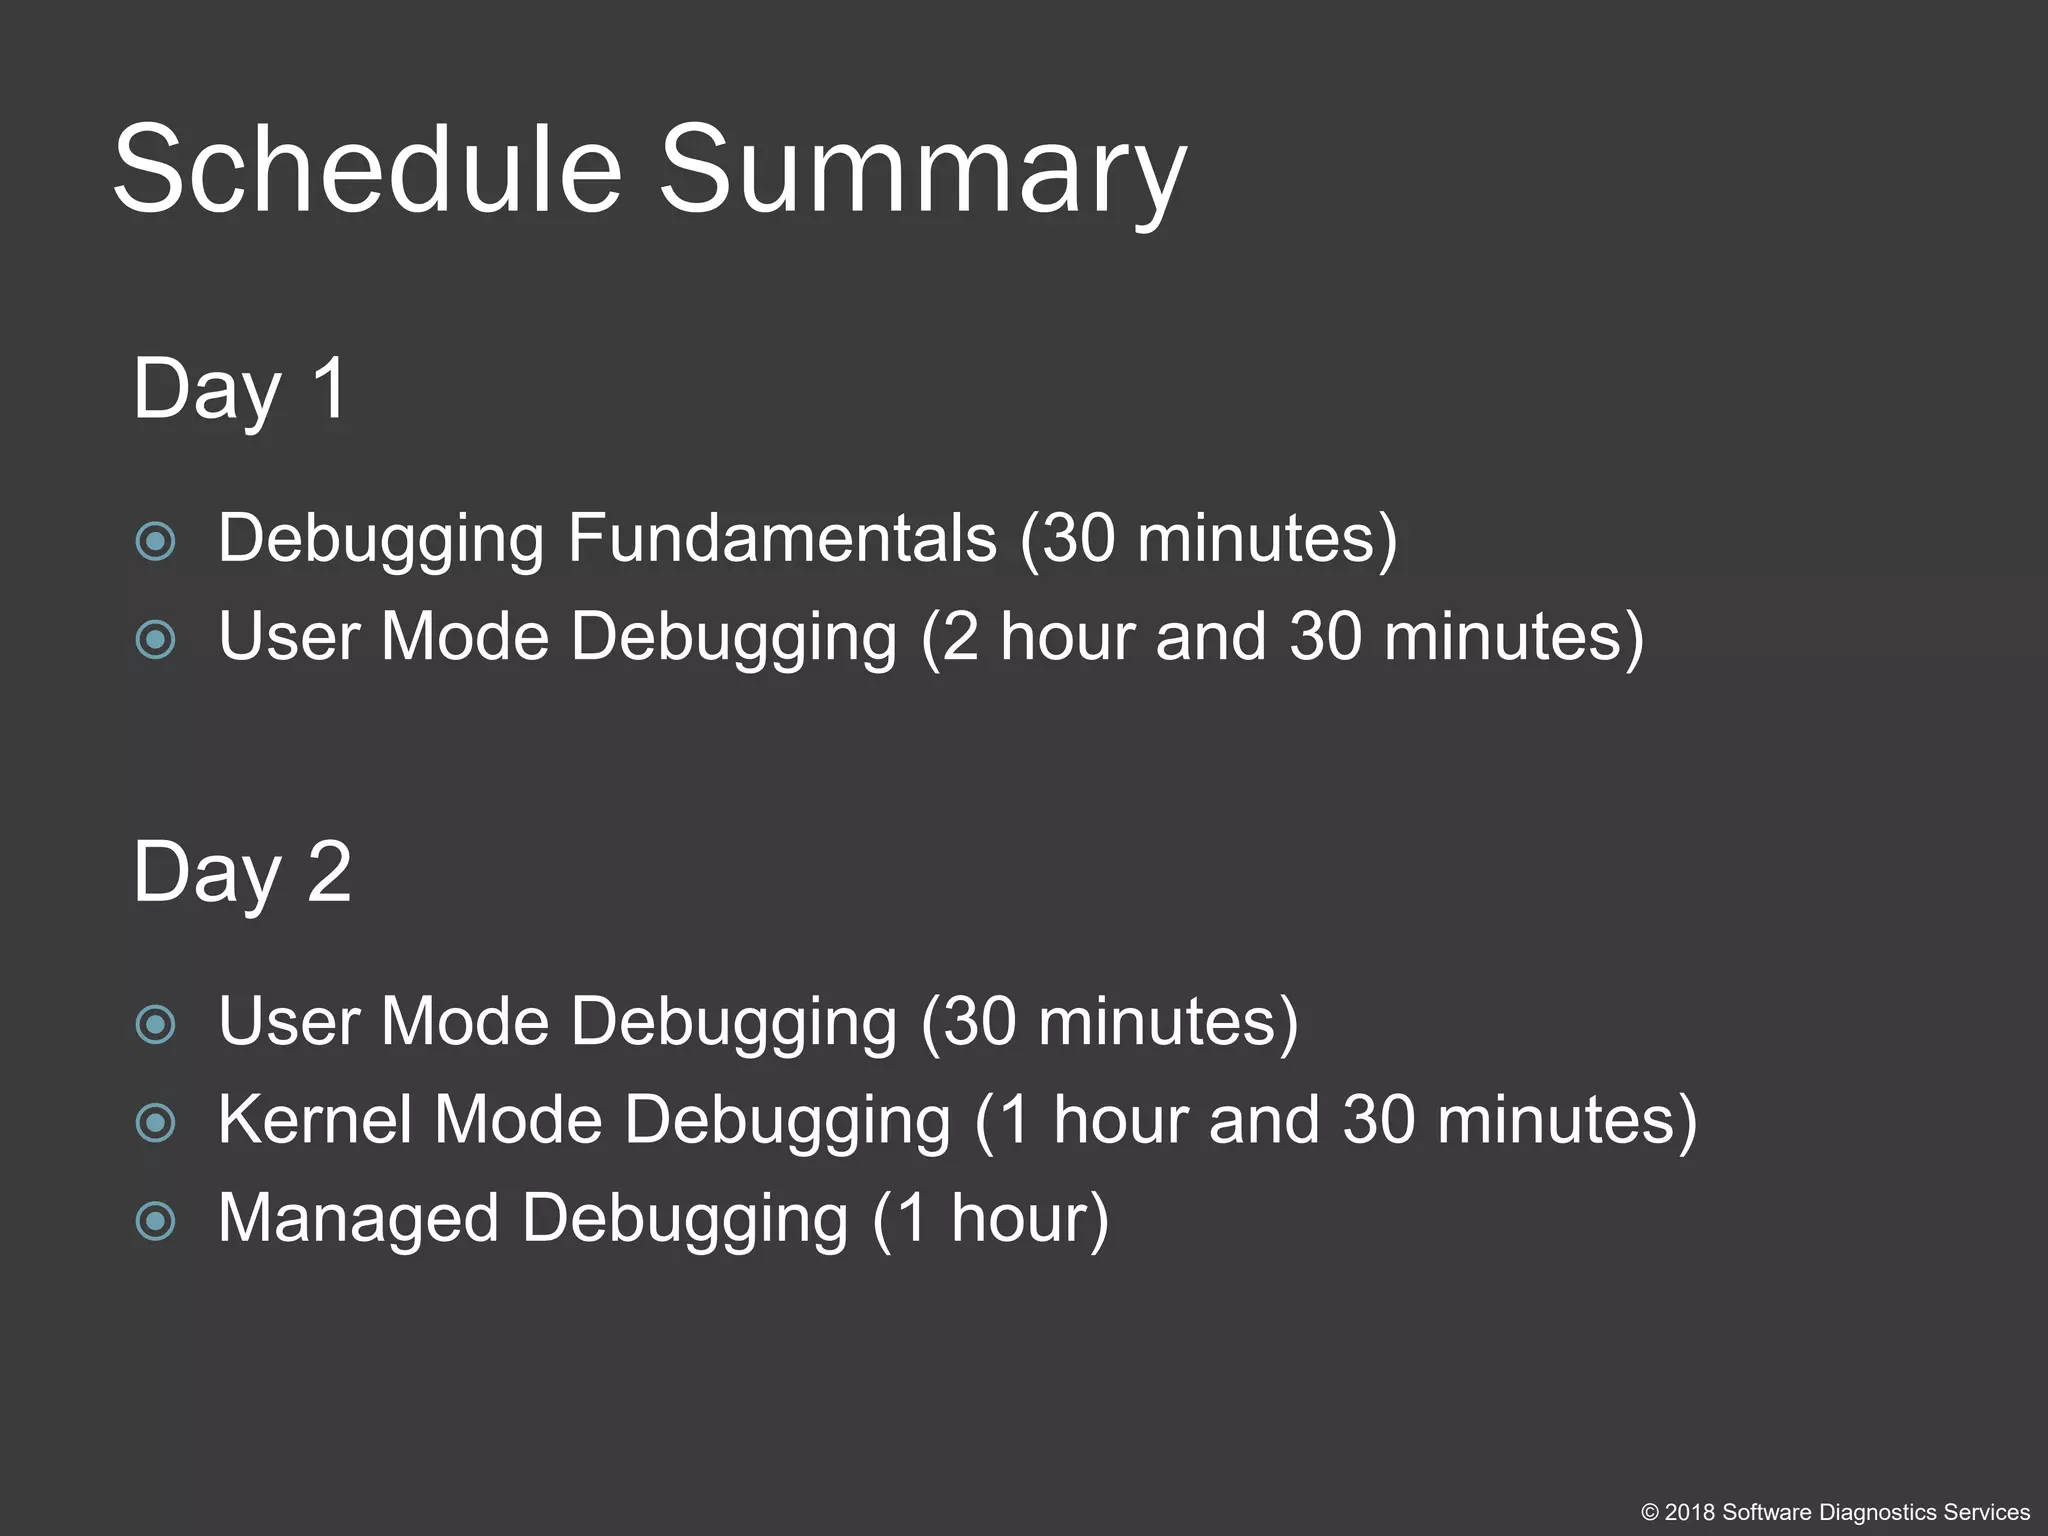
The document outlines an agenda for a 2-day training on debugging techniques using WinDbg, including fundamentals of debugging like memory spaces, execution modes, and debugging techniques; exercises on user mode debugging; and sessions on kernel mode debugging, managed debugging, and debugging principles.