Download to read offline


![SHAP-TreeExplainerAPI
1. Create a new explainer, with our model as argument
explainer = TreeExplainer(my_tree_model)
2. Calculate shap_values from our model using some observations
shap_values = explainer.shap_values(observations)
3. Use SHAP visualisation functions with our shap_values
shap.force_plot(base_value, shap_values[0]) # local explanation
shap.summary_plot(shap_values) # Global features importance](https://image.slidesharecdn.com/interpretableml-200529114735/85/Interpretable-ML-33-320.jpg)


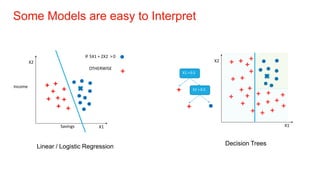
![Explainable Boosting Machines (EBM)
1. EBM preserves interpredibulty of a linear
model
2. Matches Accuracy of powerfull blackbox
models – Xgboost , Random Forest
3. Light in deployment
4. Slow in fitting on data
from interpret.glassbox import *
from interpret import show
ebm =ExplainableBoostingClassifier()
ebm.fit(X_train, y_train)
ebm_global = ebm.explain_global() show(ebm_global)
ebm_local = ebm.explain_local(X_test[:5], y_test[:5],
show(ebm_local)](https://image.slidesharecdn.com/interpretableml-200529114735/85/Interpretable-ML-36-320.jpg)


The document discusses the importance of model interpretability in data science, highlighting various techniques like ELI5, LIME, and SHAP for explaining model predictions. It emphasizes the need for interpretability to improve decision-making and maintain trust, especially in critical industries. Additionally, it contrasts simple and complex models, outlining how different interpretive methods can provide both local and global insights into model behavior.


![[DSC Europe 24] Orsalia Andreou - Fostering Trust in AI-Driven Finance](https://cdn.slidesharecdn.com/ss_thumbnails/orsaliaandreoufosteringtrustinai-drivenfinance-250216113615-6aa23936-thumbnail.jpg?width=640&height=640&fit=bounds)


