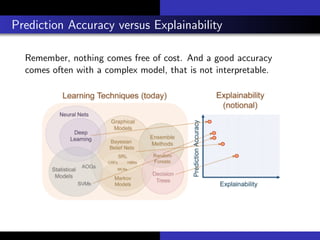
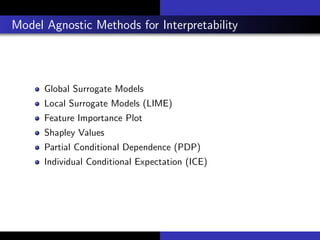
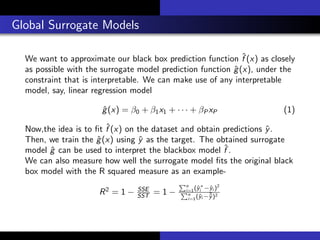
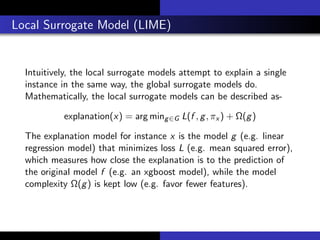
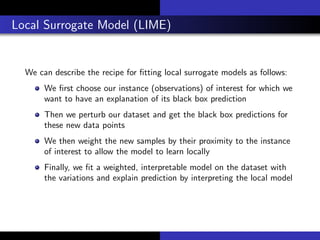
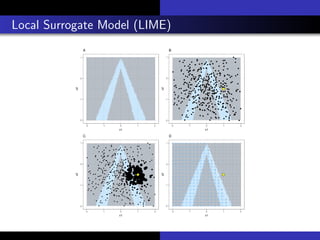
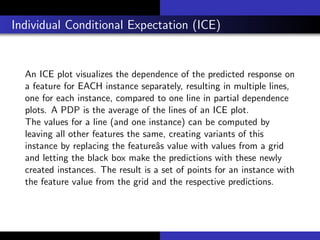
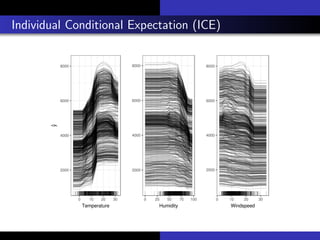
1) The document discusses various methods for interpreting machine learning models, including global and local surrogate models, feature importance plots, Shapley values, partial dependence plots, and individual conditional expectation plots.
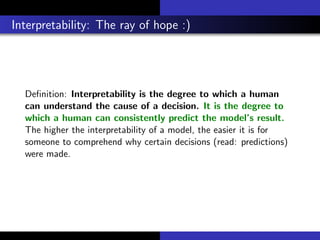
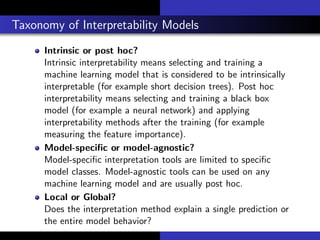
2) It explains that interpretability refers to how understandable the reasons for a model's predictions are to humans. Interpretability methods can provide global explanations of entire models or local explanations of individual predictions.
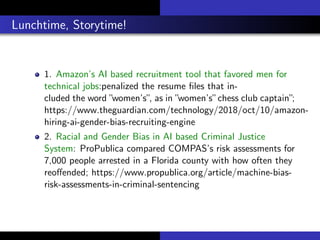
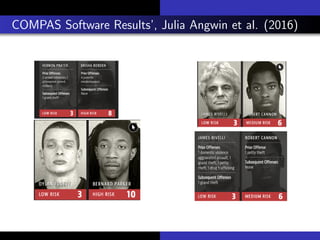
3) The document advocates that improving interpretability is important for addressing issues like bias in machine learning systems and increasing trust in applications used for high-stakes decisions like criminal justice.
Methodological study of opinion mining and sentiment analysis techniquesijsc
Decision making both on individual and organizational level is always accompanied by the search of
other’s opinion on the same. With tremendous establishment of opinion rich resources like, reviews, forum
discussions, blogs, micro-blogs, Twitter etc provide a rich anthology of sentiments. This user generated
content can serve as a benefaction to market if the semantic orientations are deliberated. Opinion mining
and sentiment analysis are the formalization for studying and construing opinions and sentiments. The
digital ecosystem has itself paved way for use of huge volume of opinionated data recorded. This paper is
an attempt to review and evaluate the various techniques used for opinion and sentiment analysis.
MS CS - Selecting Machine Learning AlgorithmKaniska Mandal
ML Algorithms usually solve an optimization problem such that we need to find parameters for a given model that minimizes
— Loss function (prediction error)
— Model simplicity (regularization)
A FUZZY INTERACTIVE BI-OBJECTIVE MODEL FOR SVM TO IDENTIFY THE BEST COMPROMIS...ijfls
A support vector machine (SVM) learns the decision surface from two different classes of the input points. In several applications, some of the input points are misclassified and each is not fully allocated to either of these two groups. In this paper a bi-objective quadratic programming model with fuzzy parameters is utilized and different feature quality measures are optimized simultaneously. An α-cut is defined to transform the fuzzy model to a family of classical bi-objective quadratic programming problems. The weighting method is used to optimize each of these problems. For the proposed fuzzy bi-objective quadratic programming model, a major contribution will be added by obtaining different effective support vectors due to changes in weighting values. The experimental results, show the effectiveness of the α-cut with the weighting parameters on reducing the misclassification between two classes of the input points. An interactive procedure will be added to identify the best compromise solution from the generated efficient solutions. The main contribution of this paper includes constructing a utility function for measuring the degree of infection with coronavirus disease (COVID-19).
A BI-OBJECTIVE MODEL FOR SVM WITH AN INTERACTIVE PROCEDURE TO IDENTIFY THE BE...ijaia
A support vector machine (SVM) learns the decision surface from two different classes of the input points, there are misclassifications in some of the input points in several applications. In this paper a bi-objective quadratic programming model is utilized and different feature quality measures are optimized simultaneously using the weighting method for solving our bi-objective quadratic programming problem. An important contribution will be added for the proposed bi-objective quadratic programming model by getting different efficient support vectors due to changing the weighting values. The numerical examples, give evidence of the effectiveness of the weighting parameters on reducing the misclassification between two classes of the input points. An interactive procedure will be added to identify the best compromise solution from the generated efficient solutions.
ANALYTICAL STUDY OF FEATURE EXTRACTION TECHNIQUES IN OPINION MININGcsandit
Although opinion mining is in a nascent stage of development but still the ground is set for dense growth of researches in the field. One of the important activities of opinion mining is to extract opinions of people based on characteristics of the object under study. Feature extraction in opinion mining can be done by various ways like that of clustering, support vector machines
etc. This paper is an attempt to appraise the various techniques of feature extraction. The first part discusses various techniques and second part makes a detailed appraisal of the major techniques used for feature extraction
Analytical study of feature extraction techniques in opinion miningcsandit
Although opinion mining is in a nascent stage of development but still the ground is set for
dense growth of researches in the field. One of the important activities of opinion mining is to
extract opinions of people based on characteristics of the object under study. Feature extraction
in opinion mining can be done by various ways like that of clustering, support vector machines
etc. This paper is an attempt to appraise the various techniques of feature extraction. The first
part discusses various techniques and second part makes a detailed appraisal of the major
techniques used for feature extraction
This presentation briefly defines machine learning and its types of algorithms. After that two algorithms are presented. The first is naive bayes classifier for text classification and later k-means for clustering including some strategies to improve results.
Constructing a classification model is important in machine learning for a particular task. A
classification process involves assigning objects into predefined groups or classes based on a
number of observed attributes related to those objects. Artificial neural network is one of the
classification algorithms which, can be used in many application areas. This paper investigates
the potential of applying the feed forward neural network architecture for the classification of
medical datasets. Migration based differential evolution algorithm (MBDE) is chosen and
applied to feed forward neural network to enhance the learning process and the network
learning is validated in terms of convergence rate and classification accuracy. In this paper,
MBDE algorithm with various migration policies is proposed for classification problems using
medical diagnosis.
And Then There Are Algorithms - Danilo Poccia - Codemotion Rome 2018Codemotion
In machine learning, training large models on a massive amount of data usually improves results. Our customers report, however, that training such models and deploying them is either operationally prohibitive or outright impossible for them. We created a collection of machine learning algorithms that scale to any amount of data, including k-means clustering for data segmentation, factorization machines for recommendations, time-series forecasting, linear regression, topic modeling, and image classification. This talk will discuss those algorithms, understand where and how they can be used.
This presentation talks about some of the outstanding methods for Interpreting the complex machine learning black box models. One of the ideas is to use interpretable simple models to explain predictions using sophisticated black box machine learning models.
Model Agnostic methods are proven to have some specific advantages over the Model Specific Methods of Interpretability. This work demonstrates some of such results.
A simple framework for contrastive learning of visual representationsDevansh16
Link: https://machine-learning-made-simple.medium.com/learnings-from-simclr-a-framework-contrastive-learning-for-visual-representations-6c145a5d8e99
If you'd like to discuss something, text me on LinkedIn, IG, or Twitter. To support me, please use my referral link to Robinhood. It's completely free, and we both get a free stock. Not using it is literally losing out on free money.
Check out my other articles on Medium. : https://rb.gy/zn1aiu
My YouTube: https://rb.gy/88iwdd
Reach out to me on LinkedIn. Let's connect: https://rb.gy/m5ok2y
My Instagram: https://rb.gy/gmvuy9
My Twitter: https://twitter.com/Machine01776819
My Substack: https://devanshacc.substack.com/
Live conversations at twitch here: https://rb.gy/zlhk9y
Get a free stock on Robinhood: https://join.robinhood.com/fnud75
This paper presents SimCLR: a simple framework for contrastive learning of visual representations. We simplify recently proposed contrastive self-supervised learning algorithms without requiring specialized architectures or a memory bank. In order to understand what enables the contrastive prediction tasks to learn useful representations, we systematically study the major components of our framework. We show that (1) composition of data augmentations plays a critical role in defining effective predictive tasks, (2) introducing a learnable nonlinear transformation between the representation and the contrastive loss substantially improves the quality of the learned representations, and (3) contrastive learning benefits from larger batch sizes and more training steps compared to supervised learning. By combining these findings, we are able to considerably outperform previous methods for self-supervised and semi-supervised learning on ImageNet. A linear classifier trained on self-supervised representations learned by SimCLR achieves 76.5% top-1 accuracy, which is a 7% relative improvement over previous state-of-the-art, matching the performance of a supervised ResNet-50. When fine-tuned on only 1% of the labels, we achieve 85.8% top-5 accuracy, outperforming AlexNet with 100X fewer labels.
Comments: ICML'2020. Code and pretrained models at this https URL
Subjects: Machine Learning (cs.LG); Computer Vision and Pattern Recognition (cs.CV); Machine Learning (stat.ML)
Cite as: arXiv:2002.05709 [cs.LG]
(or arXiv:2002.05709v3 [cs.LG] for this version)
Submission history
From: Ting Chen [view email]
[v1] Thu, 13 Feb 2020 18:50:45 UTC (5,093 KB)
[v2] Mon, 30 Mar 2020 15:32:51 UTC (5,047 KB)
[v3] Wed, 1 Jul 2020 00:09:08 UTC (5,829 KB)
Camp IT: Making the World More Efficient Using AI & Machine LearningKrzysztof Kowalczyk
Slides from the introductory lecture I gave for students at Camp IT 2019. I tried to cover artificial inteligence, machine learning, most popular algorithms and their applications to business as broadly as possible - for in-depth materials on the given topics, see links and references in the presentation.
Awarded presentation of my research activity, PhD Day 2011, February 23th 2011, Cagliari, Italy.
This presentation has been awarded as the best one of the track on information engineering.
Want to know more?
see my publications at
http://prag.diee.unica.it/pra/ita/people/satta
GENETIC ALGORITHM FOR FUNCTION APPROXIMATION: AN EXPERIMENTAL INVESTIGATIONijaia
Function Approximation is a popular engineering problems used in system identification or Equation
optimization. Due to the complex search space it requires, AI techniques has been used extensively to spot
the best curves that match the real behavior of the system. Genetic algorithm is known for their fast
convergence and their ability to find an optimal structure of the solution. We propose using a genetic
algorithm as a function approximator. Our attempt will focus on using the polynomial form of the
approximation. After implementing the algorithm, we are going to report our results and compare it with
the real function output.
IMAGE CLASSIFICATION USING DIFFERENT CLASSICAL APPROACHESVikash Kumar
IMAGE CLASSIFICATION USING KNN, RANDOM FOREST AND SVM ALGORITHM ON GLAUCOMA DATASETS AND EXPLAIN THE ACCURACY, SENSITIVITY, AND SPECIFICITY OF EACH AND EVERY ALGORITHMS
BEHAVIOR STUDY OF ENTROPY IN A DIGITAL IMAGE THROUGH AN ITERATIVE ALGORITHM O...ijscmcj
Image segmentation is a critical step in computer vision tasks constituting an essential issue for pattern
recognition and visual interpretation. In this paper, we study the behavior of entropy in digital images
through an iterative algorithm of mean shift filtering. The order of a digital image in gray levels is defined.
The behavior of Shannon entropy is analyzed and then compared, taking into account the number of
iterations of our algorithm, with the maximum entropy that could be achieved under the same order. The
use of equivalence classes it induced, which allow us to interpret entropy as a hyper-surface in real m-
dimensional space. The difference of the maximum entropy of order n and the entropy of the image is used
to group the the iterations, in order to caractrizes the performance of the algorithm
Generating images from a text description is as challenging as it is interesting. The Adversarial network
performs in a competitive fashion where the networks are the rivalry of each other. With the introduction of
Generative Adversarial Network, lots of development is happening in the field of Computer Vision. With
generative adversarial networks as the baseline model, studied Stack GAN consisting of two-stage GANS
step-by-step in this paper that could be easily understood. This paper presents visual comparative study of
other models attempting to generate image conditioned on the text description. One sentence can be related
to many images. And to achieve this multi-modal characteristic, conditioning augmentation is also
performed. The performance of Stack-GAN is better in generating images from captions due to its unique
architecture. As it consists of two GANS instead of one, it first draws a rough sketch and then corrects the
defects yielding a high-resolution image.
Show drafts
volume_up
Empowering the Data Analytics Ecosystem: A Laser Focus on Value
The data analytics ecosystem thrives when every component functions at its peak, unlocking the true potential of data. Here's a laser focus on key areas for an empowered ecosystem:
1. Democratize Access, Not Data:
Granular Access Controls: Provide users with self-service tools tailored to their specific needs, preventing data overload and misuse.
Data Catalogs: Implement robust data catalogs for easy discovery and understanding of available data sources.
2. Foster Collaboration with Clear Roles:
Data Mesh Architecture: Break down data silos by creating a distributed data ownership model with clear ownership and responsibilities.
Collaborative Workspaces: Utilize interactive platforms where data scientists, analysts, and domain experts can work seamlessly together.
3. Leverage Advanced Analytics Strategically:
AI-powered Automation: Automate repetitive tasks like data cleaning and feature engineering, freeing up data talent for higher-level analysis.
Right-Tool Selection: Strategically choose the most effective advanced analytics techniques (e.g., AI, ML) based on specific business problems.
4. Prioritize Data Quality with Automation:
Automated Data Validation: Implement automated data quality checks to identify and rectify errors at the source, minimizing downstream issues.
Data Lineage Tracking: Track the flow of data throughout the ecosystem, ensuring transparency and facilitating root cause analysis for errors.
5. Cultivate a Data-Driven Mindset:
Metrics-Driven Performance Management: Align KPIs and performance metrics with data-driven insights to ensure actionable decision making.
Data Storytelling Workshops: Equip stakeholders with the skills to translate complex data findings into compelling narratives that drive action.
Benefits of a Precise Ecosystem:
Sharpened Focus: Precise access and clear roles ensure everyone works with the most relevant data, maximizing efficiency.
Actionable Insights: Strategic analytics and automated quality checks lead to more reliable and actionable data insights.
Continuous Improvement: Data-driven performance management fosters a culture of learning and continuous improvement.
Sustainable Growth: Empowered by data, organizations can make informed decisions to drive sustainable growth and innovation.
By focusing on these precise actions, organizations can create an empowered data analytics ecosystem that delivers real value by driving data-driven decisions and maximizing the return on their data investment.
Levelwise PageRank with Loop-Based Dead End Handling Strategy : SHORT REPORT ...Subhajit Sahu
Abstract — Levelwise PageRank is an alternative method of PageRank computation which decomposes the input graph into a directed acyclic block-graph of strongly connected components, and processes them in topological order, one level at a time. This enables calculation for ranks in a distributed fashion without per-iteration communication, unlike the standard method where all vertices are processed in each iteration. It however comes with a precondition of the absence of dead ends in the input graph. Here, the native non-distributed performance of Levelwise PageRank was compared against Monolithic PageRank on a CPU as well as a GPU. To ensure a fair comparison, Monolithic PageRank was also performed on a graph where vertices were split by components. Results indicate that Levelwise PageRank is about as fast as Monolithic PageRank on the CPU, but quite a bit slower on the GPU. Slowdown on the GPU is likely caused by a large submission of small workloads, and expected to be non-issue when the computation is performed on massive graphs.
Techniques to optimize the pagerank algorithm usually fall in two categories. One is to try reducing the work per iteration, and the other is to try reducing the number of iterations. These goals are often at odds with one another. Skipping computation on vertices which have already converged has the potential to save iteration time. Skipping in-identical vertices, with the same in-links, helps reduce duplicate computations and thus could help reduce iteration time. Road networks often have chains which can be short-circuited before pagerank computation to improve performance. Final ranks of chain nodes can be easily calculated. This could reduce both the iteration time, and the number of iterations. If a graph has no dangling nodes, pagerank of each strongly connected component can be computed in topological order. This could help reduce the iteration time, no. of iterations, and also enable multi-iteration concurrency in pagerank computation. The combination of all of the above methods is the STICD algorithm. [sticd] For dynamic graphs, unchanged components whose ranks are unaffected can be skipped altogether.
Chatty Kathy - UNC Bootcamp Final Project Presentation - Final Version - 5.23...John Andrews
SlideShare Description for "Chatty Kathy - UNC Bootcamp Final Project Presentation"
Title: Chatty Kathy: Enhancing Physical Activity Among Older Adults
Description:
Discover how Chatty Kathy, an innovative project developed at the UNC Bootcamp, aims to tackle the challenge of low physical activity among older adults. Our AI-driven solution uses peer interaction to boost and sustain exercise levels, significantly improving health outcomes. This presentation covers our problem statement, the rationale behind Chatty Kathy, synthetic data and persona creation, model performance metrics, a visual demonstration of the project, and potential future developments. Join us for an insightful Q&A session to explore the potential of this groundbreaking project.
Project Team: Jay Requarth, Jana Avery, John Andrews, Dr. Dick Davis II, Nee Buntoum, Nam Yeongjin & Mat Nicholas
Opendatabay - Open Data Marketplace.pptxOpendatabay
Opendatabay.com unlocks the power of data for everyone. Open Data Marketplace fosters a collaborative hub for data enthusiasts to explore, share, and contribute to a vast collection of datasets.
First ever open hub for data enthusiasts to collaborate and innovate. A platform to explore, share, and contribute to a vast collection of datasets. Through robust quality control and innovative technologies like blockchain verification, opendatabay ensures the authenticity and reliability of datasets, empowering users to make data-driven decisions with confidence. Leverage cutting-edge AI technologies to enhance the data exploration, analysis, and discovery experience.
From intelligent search and recommendations to automated data productisation and quotation, Opendatabay AI-driven features streamline the data workflow. Finding the data you need shouldn't be a complex. Opendatabay simplifies the data acquisition process with an intuitive interface and robust search tools. Effortlessly explore, discover, and access the data you need, allowing you to focus on extracting valuable insights. Opendatabay breaks new ground with a dedicated, AI-generated, synthetic datasets.
Leverage these privacy-preserving datasets for training and testing AI models without compromising sensitive information. Opendatabay prioritizes transparency by providing detailed metadata, provenance information, and usage guidelines for each dataset, ensuring users have a comprehensive understanding of the data they're working with. By leveraging a powerful combination of distributed ledger technology and rigorous third-party audits Opendatabay ensures the authenticity and reliability of every dataset. Security is at the core of Opendatabay. Marketplace implements stringent security measures, including encryption, access controls, and regular vulnerability assessments, to safeguard your data and protect your privacy.
1. Interpretability: Challenging the Black Box of
Machine Learning
Ankit Tewari
Research Data Scientist
Knowledge Engineering and Machine Learning Group (KEMLG)
Biomedical and Biophysical Signal Processing Group (B2S LAB)
Universitat Politecnica de Catalunya (UPC)
November 10, 2018
Smart City Week: City, Society and Technology
2. Lunchtime, Storytime!
1. Amazon’s AI based recruitment tool that favored men for
technical jobs:penalized the resume files that in-
cluded the word ”women’s”, as in ”women’s”chess club captain”;
https://www.theguardian.com/technology/2018/oct/10/amazon-
hiring-ai-gender-bias-recruiting-engine
2. Racial and Gender Bias in AI based Criminal Justice
System: ProPublica compared COMPAS’s risk assessments for
7,000 people arrested in a Florida county with how often they
reoffended; https://www.propublica.org/article/machine-bias-
risk-assessments-in-criminal-sentencing
4. Solutions?
While there are many reasons such biases are encountered in our
machine learning systems, there are pretty straight-forward
mechanisms to address. But, remember straight forward is not
always simple!
Data preprocessing techniques for classification without
discrimination. (statistical parity)
Discrimination aware Machine Learning Models
and many more approaches!
However, our discussion is focused on examining whether and how
much biased a system is through explaining the predictions made
by the system.
5. Prediction Accuracy versus Explainability
Remember, nothing comes free of cost. And a good accuracy
comes often with a complex model, that is not interpretable.
6. Smarter the System, the more Black the Box gets!
Remember, nothing comes free of cost. And a good accuracy
comes often with a complex model, that is not interpretable.
7. The intolerable silence!
Silence of your lover is different from the silence of your computer.
It signifies the barrier between tolerance and intolerance!
8. Interpretability: The ray of hope :)
Definition: Interpretability is the degree to which a human
can understand the cause of a decision. It is the degree to
which a human can consistently predict the model’s result.
The higher the interpretability of a model, the easier it is for
someone to comprehend why certain decisions (read: predictions)
were made.
9. Interpretability versus Interpretation
While interpretability is a measure of the extent to which a
machine learning model can be explained, the interpretation
is the explanation associated with the model’s predictions.
1. Importance and Scope
2. Taxonomy of Interpretability Methods
10. Taxonomy of Interpretability Models
Intrinsic or post hoc?
Intrinsic interpretability means selecting and training a
machine learning model that is considered to be intrinsically
interpretable (for example short decision trees). Post hoc
interpretability means selecting and training a black box
model (for example a neural network) and applying
interpretability methods after the training (for example
measuring the feature importance).
Model-specific or model-agnostic?
Model-specific interpretation tools are limited to specific
model classes. Model-agnostic tools can be used on any
machine learning model and are usually post hoc.
Local or Global?
Does the interpretation method explain a single prediction or
the entire model behavior?
11. Model Agnostic Methods for Interpretability
Global Surrogate Models
Local Surrogate Models (LIME)
Feature Importance Plot
Shapley Values
Partial Conditional Dependence (PDP)
Individual Conditional Expectation (ICE)
12. Global Surrogate Models
We want to approximate our black box prediction function ˆf (x) as closely
as possible with the surrogate model prediction function ˆg(x), under the
constraint that is interpretable. We can make use of any interpretable
model, say, linear regression model
ˆg(x) = β0 + β1x1 + · · · + βP xP (1)
Now,the idea is to fit ˆf (x) on the dataset and obtain predictions ˆy.
Then, we train the ˆg(x) using ˆy as the target. The obtained surrogate
model ˆg can be used to interpret the blackbox model ˆf .
We can also measure how well the surrogate model fits the original black
box model with the R squared measure as an example-
R2
= 1 − SSE
SST = 1 −
n
i=1(ˆy∗
i −ˆyi )2
n
i=1(ˆyi −¯ˆy)2
13. The terminal nodes of a surrogate tree that approximates the
behaviour of a support vector machine trained on the bike rental
dataset. The distributions in the nodes show that the surrogate
tree predicts a higher number of rented bikes when the weather is
above around 13 degrees (Celsius) and when the day was later in
the 2 year period (cut point at 435 days).
14. Local Surrogate Model (LIME)
Intuitively, the local surrogate models attempt to explain a single
instance in the same way, the global surrogate models do.
Mathematically, the local surrogate models can be described as-
explanation(x) = arg ming∈G L(f , g, πx ) + Ω(g)
The explanation model for instance x is the model g (e.g. linear
regression model) that minimizes loss L (e.g. mean squared error),
which measures how close the explanation is to the prediction of
the original model f (e.g. an xgboost model), while the model
complexity Ω(g) is kept low (e.g. favor fewer features).
15. Local Surrogate Model (LIME)
We can describe the recipe for fitting local surrogate models as follows:
We first choose our instance (observations) of interest for which we
want to have an explanation of its black box prediction
Then we perturb our dataset and get the black box predictions for
these new data points
We then weight the new samples by their proximity to the instance
of interest to allow the model to learn locally
Finally, we fit a weighted, interpretable model on the dataset with
the variations and explain prediction by interpreting the local model
17. Local Surrogate Model (LIME)
A) The plot displays the decision boundaries learned by a machine
learning model. In this case it was a Random Forest, but it does
not matter, because LIME is model-agnostic.
B) The yellow point is the instance of interest, which we want to
explain. The black dots are data sampled from a normal
distribution around the means of the features in the training
sample. This needs to be done only once and can be reused for
other explanations.
C) Introducing locality by giving points near the instance of
interest higher weights.
D) The colours and signs of the grid display the classifications of
the locally learned model form the weighted samples. The white
line marks the decision boundary (P(class) = 0.5) at which the
classification of the local model changes.
18. Local Surrogate Model (LIME)
Application of the LIME on a counter-terrorism dataset, an
ongoing project that aims to measure the fingerprints of terrorist
outfits across the globe
19. Feature Importance
A feature’s importance is the increase in the model’s prediction
error after we permuted the feature’s values (breaks the
relationship between the feature and the outcome).
Just like the global surrogate models, it provides a salient overview
of how the model is behaving globally.
20. Feature Importance
Feature Importance
Input: Trained model ˆf , feature matrix X , target vector Y , error
measure L(Y , ˆY )
1. Estimate the original model error eorig (ˆf ) = L(Y , ˆf (X)) (e.g. mean
squared error)
2. For each feature j ∈ {1, ..., p} d
Generate feature matrix Xpermj
by permuting feature Xj in X. This
breaks the association between Xj and Y .
Estimate error eperm = L(Y , ˆf (Xpermj
)) based on the predictions of
the permuted data
Calculate permutation feature importance FIj = eperm(ˆf )/eorig (ˆf ) .
Alternatively, the difference can be used: FIj = eperm(ˆf ) − eorig (f )
3. Sort variables by descending FI.
22. Shapley Values
The Shapley value is the average marginal contribution of a
feature value over all possible coalitions.
Predictions can be explained by assuming that each
feature is a ’player’ in a game where the prediction is
the payout. The Shapley value - a method from
coalitional game theory - tells us how to fairly distribute
the ’payout’ among the features.
The interpretation of the Shapley value. φij for feature j
and instance i is: the feature value xij contributed φij
towards the prediction for instance i compared to the
average prediction for the dataset. The Shapley value
works for both classification (if we deal with probabilities) and
regression. We use the Shapley value to analyse the
predictions of a Random Forest model predicting the
absenteeism at workplace.
24. Partial Dependence Plot (PDP)
The partial dependence plot (PDP or PD plot) shows the
marginal effect of a feature on the predicted outcome of a
previously fit model (J. H. Friedman). The prediction function is
fixed at a few values of the chosen features and averaged over the
other features.
In practice, the set of features Xs usually only contains one feature
or a maximum of two, because one feature produces 2D plots and
two features produce 3D plots. Everything beyond that is quite
tricky. Even 3D on a 2D paper or monitor is already challenging.
26. Indepent Conditional Expectation (ICE)
For a chosen feature, Individual Conditional Expectation (ICE)
plots draw one line per instance, representing how the instance’s
prediction changes when the feature changes.
27. Individual Conditional Expectation (ICE)
An ICE plot visualizes the dependence of the predicted response on
a feature for EACH instance separately, resulting in multiple lines,
one for each instance, compared to one line in partial dependence
plots. A PDP is the average of the lines of an ICE plot.
The values for a line (and one instance) can be computed by
leaving all other features the same, creating variants of this
instance by replacing the featureˆas value with values from a grid
and letting the black box make the predictions with these newly
created instances. The result is a set of points for an instance with
the feature value from the grid and the respective predictions.
29. Evaluating the Interpretability
Application Level Evaluation: Put the explanation into the
product and let the end user test it.
Human Level Evaluation: is a simplified application level
evaluation. The difference is that these experiments are not
conducted with the domain experts, but with lay humans. An
example would be to show a user different explanations and
the human would choose the best.
Functional Level Evaluation: This works best when the
class of models used was already evaluated by someone else in
a human level evaluation. For example it might be known that
the end users understand decision trees. In this case, a proxy
for explanation quality might be the depth of the tree. Shorter
trees would get a better explainability rating.
30. Questions?
Thank you so much for being the part of this talk. You can also
write me at ankitt.nic@gmail.com :)