Download as PDF, PPTX


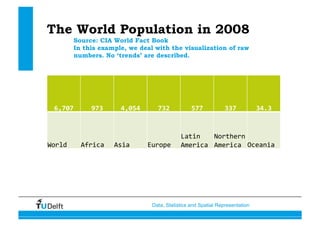
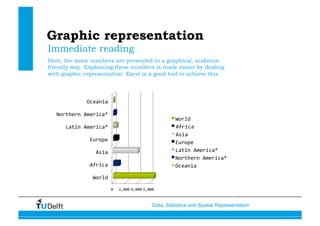
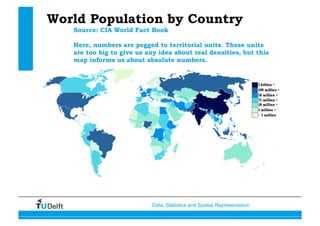
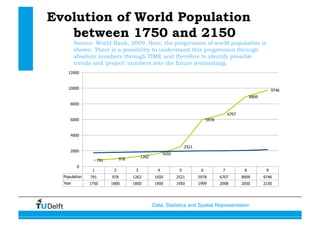

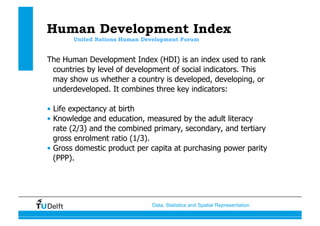


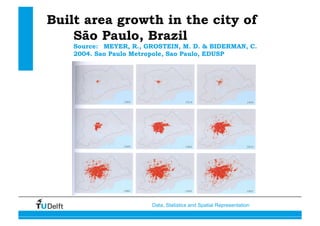
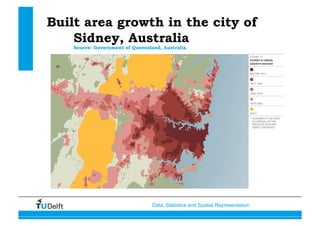


The document discusses quantitative research methods in urban planning, emphasizing the importance of data and statistics in understanding societal trends and spatial representations. It highlights historical context, modern sources of data, and the relationship between social processes and spatial analysis, featuring tools for visualizing and interpreting data. Additionally, it addresses the human development index and provides various examples of data applications in urban studies.