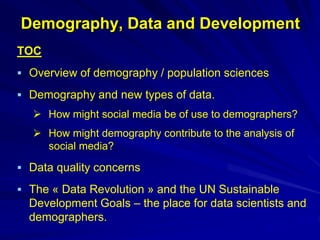
Slides from ICWSM'17 workshop on Social Media for Demographic Research (Montreal, May 2017)
Overview of demography
How can demographers contribute to the analysis of big data (social media)? How can social media contribute to population studies?
Concerns over data quality.
Data Revolution and the SDGs: overview and value, huge challenges for attaining a economic-demographic-
environment balance, and the urgent need for data scientists and demographers to work on these issues.
Population Studies / Demography IntroductionMuteeullah
Presentation and Assignment on Population / Demography including mortality, fertility and their measure, population census, vital registration, demography survey, House hold survey, population composition, errors in demographic data, demographic measures.................By Muteeullah Channa University of Sindh
Introduction:
Life table:
Life table is a comprehensive method of describing mortality, survival and other vital events in a population.
It is composed of several sets of values showing how a group of infants who are under unchanging conditions would gradually die.
It provides concise measures of longevity of that population.
Separate tables are prepared for males and females after each decennium census.
It is also called as the “Biometer” of the population by William Farr.
Levels, Patterns and Trends of Urbanization (World)ShreemoyeeSaha1
1. What is Urbanization?
2. Levels of Urbanization in the World
3. Patterns of Urbanization in the World : Demographic Changes, Economic Development, Consumption Pattern, Urban Footprint.
4. Patterns of Urbanization in Asia.
5. Trends of Urbanization in the World : Past, Recent and Future Trends.
6. Timeline of Urbanization in the World (1950- 2050)
7. Projected Urban and Rural Population.
8. Urbanization and Sustainability.
A technology-based model for sustaining the elderly: Addressing rising servic...husITa
The aging of civilization in the developed countries, and many developing countries, that are considered technically advanced, is well underway. Some developed countries, such as the United States, are beginning to realize the need to create alternative and innovative methods of caring for, and maintaining, the functioning and health needs of the elderly, in the absence of sufficient numbers of younger indigenous caretakers, within these aged population countries. The need to import and train sufficient labor, including social work practitioners, to operate existing social institutions and care for the aging is creating a number of general social problems
According to (International Wealth Solutions, 2008) the world population, of above age 65 years, was expected to increase from 6.9% in the year 2000 to 19.3% by the year 2050. However, population growth is expected to slow with decreases in fertility rates. The already large aging population in the United States, estimated at 12.3% in the year 2000, will be increasing to 21.1% and peaking earlier by the year 2035. As a result, there may be insufficient numbers of available laborers to service either the needs of the elderly, or in some cases, society as a whole.
Emerging technologies show promise of bridging the service needs gap created by these demographic challenges. These include medical sensor technologies designed to improve independent living options (Smith, 2008), integrated sensor design platforms, and the combining of environmental health and activity monitoring systems (Mazzù, Scalvini, Giordano, Frumento, Wells, Lokhorst, & Glisenti, 2008), and the proposed the fusion of a radio frequency identification (RFID) tag (Niemeijer, Alistair; Hertogh & Cees, 2008) which could be coupled with an infra-red system (Professional Engineering, 2004) and acoustic systems to provide more effective monitoring (Istrate, Vacher, Serignat, Besacier & Castelli 2006), and information and communication (ICT) technologies,
Gender Equality and Big Data. Making Gender Data Visible UN Global Pulse
This report provides background context on how big data can be used to facilitate and assess progress towards the SDGs, and focuses in particular on SDG 5 – “Achieve gender equality and empower all women and girls”. It examines successes and challenges in the use of big data to improve the lives of women and girls, and identifies concrete data innovation projects from across the development sector that have considered the gender dimension.
Human reproduction planning is the practice of intentionally controlling the rate of growth of a human population. Historically, human population planning has been implemented with the goal of increasing the rate of human population growth. However, in the period from the 1950s to the 1980s, concerns about global population growth and its effects on poverty, environmental degradation and political stability led to efforts to reduce human population growth rates. More recently, some countries, such as China, Iran, and Spain, have begun efforts to increase their birth rates once again. While population planning can involve measures that improve people's lives by giving them greater control of their reproduction, a few programs, most notably the Chinese government's "one-child policy and two-child policy", have resorted to coercive measures.
Randy OlsonNational GeographicSuperStockLearning Objecti.docxmakdul
Randy Olson/National Geographic/SuperStock
Learning Objectives
After studying this chapter, you should be able to:
• Explain what the field of demography and demographics is about and how demographers use concepts
like birth rates, death rates, and fertility rates to study changes in population over time.
• Discuss the range of population forecasts for the decades ahead and the factors that help explain the
variation in those forecasts.
• Explain the I 5 PAT concept and how it shifts the focus of the population-environment debate from one
solely focused on human numbers to a broader discussion of the role of affluence and technology in
environmental degradation.
• Discuss the ways in which the combination of increased family planning services and improvement in
the status of women in society helped the Asian nation of Bangladesh achieve remarkable reductions in
fertility rates and population growth.
Human Population
Dynamics 2
CN CT
CO_TX
CO_BL
CO_CRD
CO_LO
ben85927_02_c02.indd 63 1/20/14 2:32 PM
InTroDucTIon
Pre-Test
1. Which stage is characterized with an equal birth rate and death rate in developing
countries?
a. Pre-industrial stage
b. Transitional stage
c. Industrial stage
d. Post-industrial stage
2. Which country has the fastest growing amount of carbon emissions from fossil fuels?
a. united States
b. Africa
c. England
d. china
3. Living standards and rates of consumption in much of Africa are very low, and yet
some demographers and environmental scientists are concerned about the future
environmental impacts of population on that continent. Based on the I 5 PAT formula
this is because Africa has
a. a declining A factor.
b. a rising T factor.
c. a rising A factor.
d. a rising P factor.
4. Beyond the availability of family planning and contraceptive services, demographers
know that better education and opportunities for young girls and women can have a
powerful impact on fertility rates. This is because
a. well-educated women tend to have more children.
b. well-educated women tend to have fewer children.
c. well-educated women tend not to get married.
d. well-educated women can read the instructions on contraceptive packages.
Answers
1. d. Post-industrial stage. The answer can be found in section 2.1.
2. d. china. The answer can be found in section 2.2.
3. d. a rising P factor. The answer can be found in section 2.3.
4. b. well-educated women tend to have fewer children. The answer can be found in section 2.4.
Introduction
During Paleolithic, or stone tool, times humans had relatively little advantage over other ani-
mals on the savanna. Survival was fragile, people died young, and populations stayed small.
But humans were smart. Tribal bonds became strong, people learned to cooperate for the
common good, and we survived those perilous times.
Then, about 50,000 years ago, tool technology began to show rapid improvements. Light,
sharp, streamlined spear points replace ...
THE IMPORTANCE OF MARTIAN ATMOSPHERE SAMPLE RETURN.Sérgio Sacani
The return of a sample of near-surface atmosphere from Mars would facilitate answers to several first-order science questions surrounding the formation and evolution of the planet. One of the important aspects of terrestrial planet formation in general is the role that primary atmospheres played in influencing the chemistry and structure of the planets and their antecedents. Studies of the martian atmosphere can be used to investigate the role of a primary atmosphere in its history. Atmosphere samples would also inform our understanding of the near-surface chemistry of the planet, and ultimately the prospects for life. High-precision isotopic analyses of constituent gases are needed to address these questions, requiring that the analyses are made on returned samples rather than in situ.
A brief information about the SCOP protein database used in bioinformatics.
The Structural Classification of Proteins (SCOP) database is a comprehensive and authoritative resource for the structural and evolutionary relationships of proteins. It provides a detailed and curated classification of protein structures, grouping them into families, superfamilies, and folds based on their structural and sequence similarities.
(May 29th, 2024) Advancements in Intravital Microscopy- Insights for Preclini...Scintica Instrumentation
Intravital microscopy (IVM) is a powerful tool utilized to study cellular behavior over time and space in vivo. Much of our understanding of cell biology has been accomplished using various in vitro and ex vivo methods; however, these studies do not necessarily reflect the natural dynamics of biological processes. Unlike traditional cell culture or fixed tissue imaging, IVM allows for the ultra-fast high-resolution imaging of cellular processes over time and space and were studied in its natural environment. Real-time visualization of biological processes in the context of an intact organism helps maintain physiological relevance and provide insights into the progression of disease, response to treatments or developmental processes.
In this webinar we give an overview of advanced applications of the IVM system in preclinical research. IVIM technology is a provider of all-in-one intravital microscopy systems and solutions optimized for in vivo imaging of live animal models at sub-micron resolution. The system’s unique features and user-friendly software enables researchers to probe fast dynamic biological processes such as immune cell tracking, cell-cell interaction as well as vascularization and tumor metastasis with exceptional detail. This webinar will also give an overview of IVM being utilized in drug development, offering a view into the intricate interaction between drugs/nanoparticles and tissues in vivo and allows for the evaluation of therapeutic intervention in a variety of tissues and organs. This interdisciplinary collaboration continues to drive the advancements of novel therapeutic strategies.
What is greenhouse gasses and how many gasses are there to affect the Earth.moosaasad1975
What are greenhouse gasses how they affect the earth and its environment what is the future of the environment and earth how the weather and the climate effects.
Comparing Evolved Extractive Text Summary Scores of Bidirectional Encoder Rep...University of Maribor
Slides from:
11th International Conference on Electrical, Electronics and Computer Engineering (IcETRAN), Niš, 3-6 June 2024
Track: Artificial Intelligence
https://www.etran.rs/2024/en/home-english/
This presentation explores a brief idea about the structural and functional attributes of nucleotides, the structure and function of genetic materials along with the impact of UV rays and pH upon them.
Introduction:
RNA interference (RNAi) or Post-Transcriptional Gene Silencing (PTGS) is an important biological process for modulating eukaryotic gene expression.
It is highly conserved process of posttranscriptional gene silencing by which double stranded RNA (dsRNA) causes sequence-specific degradation of mRNA sequences.
dsRNA-induced gene silencing (RNAi) is reported in a wide range of eukaryotes ranging from worms, insects, mammals and plants.
This process mediates resistance to both endogenous parasitic and exogenous pathogenic nucleic acids, and regulates the expression of protein-coding genes.
What are small ncRNAs?
micro RNA (miRNA)
short interfering RNA (siRNA)
Properties of small non-coding RNA:
Involved in silencing mRNA transcripts.
Called “small” because they are usually only about 21-24 nucleotides long.
Synthesized by first cutting up longer precursor sequences (like the 61nt one that Lee discovered).
Silence an mRNA by base pairing with some sequence on the mRNA.
Discovery of siRNA?
The first small RNA:
In 1993 Rosalind Lee (Victor Ambros lab) was studying a non- coding gene in C. elegans, lin-4, that was involved in silencing of another gene, lin-14, at the appropriate time in the
development of the worm C. elegans.
Two small transcripts of lin-4 (22nt and 61nt) were found to be complementary to a sequence in the 3' UTR of lin-14.
Because lin-4 encoded no protein, she deduced that it must be these transcripts that are causing the silencing by RNA-RNA interactions.
Types of RNAi ( non coding RNA)
MiRNA
Length (23-25 nt)
Trans acting
Binds with target MRNA in mismatch
Translation inhibition
Si RNA
Length 21 nt.
Cis acting
Bind with target Mrna in perfect complementary sequence
Piwi-RNA
Length ; 25 to 36 nt.
Expressed in Germ Cells
Regulates trnasposomes activity
MECHANISM OF RNAI:
First the double-stranded RNA teams up with a protein complex named Dicer, which cuts the long RNA into short pieces.
Then another protein complex called RISC (RNA-induced silencing complex) discards one of the two RNA strands.
The RISC-docked, single-stranded RNA then pairs with the homologous mRNA and destroys it.
THE RISC COMPLEX:
RISC is large(>500kD) RNA multi- protein Binding complex which triggers MRNA degradation in response to MRNA
Unwinding of double stranded Si RNA by ATP independent Helicase
Active component of RISC is Ago proteins( ENDONUCLEASE) which cleave target MRNA.
DICER: endonuclease (RNase Family III)
Argonaute: Central Component of the RNA-Induced Silencing Complex (RISC)
One strand of the dsRNA produced by Dicer is retained in the RISC complex in association with Argonaute
ARGONAUTE PROTEIN :
1.PAZ(PIWI/Argonaute/ Zwille)- Recognition of target MRNA
2.PIWI (p-element induced wimpy Testis)- breaks Phosphodiester bond of mRNA.)RNAse H activity.
MiRNA:
The Double-stranded RNAs are naturally produced in eukaryotic cells during development, and they have a key role in regulating gene expression .
Earliest Galaxies in the JADES Origins Field: Luminosity Function and Cosmic ...Sérgio Sacani
We characterize the earliest galaxy population in the JADES Origins Field (JOF), the deepest
imaging field observed with JWST. We make use of the ancillary Hubble optical images (5 filters
spanning 0.4−0.9µm) and novel JWST images with 14 filters spanning 0.8−5µm, including 7 mediumband filters, and reaching total exposure times of up to 46 hours per filter. We combine all our data
at > 2.3µm to construct an ultradeep image, reaching as deep as ≈ 31.4 AB mag in the stack and
30.3-31.0 AB mag (5σ, r = 0.1” circular aperture) in individual filters. We measure photometric
redshifts and use robust selection criteria to identify a sample of eight galaxy candidates at redshifts
z = 11.5 − 15. These objects show compact half-light radii of R1/2 ∼ 50 − 200pc, stellar masses of
M⋆ ∼ 107−108M⊙, and star-formation rates of SFR ∼ 0.1−1 M⊙ yr−1
. Our search finds no candidates
at 15 < z < 20, placing upper limits at these redshifts. We develop a forward modeling approach to
infer the properties of the evolving luminosity function without binning in redshift or luminosity that
marginalizes over the photometric redshift uncertainty of our candidate galaxies and incorporates the
impact of non-detections. We find a z = 12 luminosity function in good agreement with prior results,
and that the luminosity function normalization and UV luminosity density decline by a factor of ∼ 2.5
from z = 12 to z = 14. We discuss the possible implications of our results in the context of theoretical
models for evolution of the dark matter halo mass function.
Nutraceutical market, scope and growth: Herbal drug technologyLokesh Patil
As consumer awareness of health and wellness rises, the nutraceutical market—which includes goods like functional meals, drinks, and dietary supplements that provide health advantages beyond basic nutrition—is growing significantly. As healthcare expenses rise, the population ages, and people want natural and preventative health solutions more and more, this industry is increasing quickly. Further driving market expansion are product formulation innovations and the use of cutting-edge technology for customized nutrition. With its worldwide reach, the nutraceutical industry is expected to keep growing and provide significant chances for research and investment in a number of categories, including vitamins, minerals, probiotics, and herbal supplements.
1. Demography, Data and Development
TOC
Overview of demography / population sciences
Demography and new types of data.
How might social media be of use to demographers?
How might demography contribute to the analysis of
social media?
Data quality concerns
The « Data Revolution » and the UN Sustainable
Development Goals – the place for data scientists and
demographers.
2. Central core:
Description/measurement
Mathematical relations
Population
structure (stocks)
- Size
- Composition
(age, sex…)
- Distribution across
time and space
Processes of
demographic
change (flows)
- Births
- Deaths
- Migrations
Changes in
population size &
structure, over
time and space
Demography, Data and Development
3. Demography, Data and Development
The training of technical demographers gives them
a rigorous understanding of the linkages between
human population stocks and flows across space
and time.
Capacity to assess what is feasible with data on
populations and the limitations of those data.
Ability to evaluate data quality, to link and process
data from disparate sources, and to see data as
part of a larger, systemic framework.
4. Demography, Data and Development
A useful conceptual tool
is the Lexis diagram
Presentation of three
conceptual dimensions
that exist in two-
dimensional space:
age, period and cohort
(or generation).
Consider those born
during 1950, near the
start of the baby boom.
4
3
2
1
0
1950 1951 1952 1953 1954
Age
Calendar year
5. Demography, Data and Development
With age, they will
physically change: they
first become larger and
stronger; subsequently
they grow older and
face physical infirmities.
These are examples
of true “age” effects
on their health (the
vertical arrow)
4
3
2
1
0
1950 1951 1952 1953 1954
Age
Calendar year
6. Demography, Data and Development
Time “period effects”
are shown by the
horizontal arrow.
Over time, medical
discoveries are made,
prices and access to
different foods change,
and lifestyles evolve –
for instance, access to
exercise classes. All of
these affect health and
mortality risks.
4
3
2
1
0
1950 1951 1952 1953 1954
Age
Calendar year
7. Demography, Data and Development
“Cohort” effects include
cumulative effects. For
example: an epidemic
affecting children may affect
the cohort’s susceptibility to
risks later in life.
Being part of a large
generation may also give
rise to lasting cohort effects:
the behaviors of baby
boomers may simply
differ from those of other
generations.
4
3
2
1
0
1950 1951 1952 1953 1954
Age
Calendar year
8. Demography, Data and Development
Each of these effects has consequences for the health
and survival of the group.
Each is selective in different ways, affecting the “frailty”
and representativeness of those who remain “ alive ” –
under observation.
The conceptual and formal tools of demography can
be transposed to other areas including social media.
For example: studying the population of Facebook users
(birth cohorts or year of 1st registration cohorts), with
period effects (changes to the package, introduction of
competing software, numbers of users), etc.
How does the set of users selectively evolve over time?
9. Demography, Data and Development
Broad demography (population studies)
Causes and consequences of population phenomena
Marriage behaviors, family structures, sexuality, gender,
contraceptive use…
Health, risky behaviors, effects of health services…
Labor vs. refugee migrations, migrant integration, effects
on sending and host countries…
Population aging: pensions, support services…
Demographic dividend: falling fertility, changes to age
structure and economic development…
Population growth and environmental sustainability…
10. Demography, Data and Development
Demographers have much to gain from, and
contribute to, the study of new types of data
Some examples:
Using demographic methods to study populations of
Facebook or Twitter users by “age”, time and cohort.
Spatial analysis (often neglected by demographers)
For example: “now-casting” disaggregated population
estimates using data from cellphones, satellites and
drones.
11. Demography, Data and Development
Better measuring & explaining socio-demographic
phenomena
Big data sets often lack the variables needed for
rigorous hypothesis testing grounded in theory.
Traditional data too are lacking for some topics.
Examples:
o Use of social media data and cellphone records
to study mobility (migration and integration).
o Using Facebook postings to gain insight into
attitudes and strategies regarding behaviors
(cf. anthropological data)
12. Demography, Data and Development
Data quality concerns
Distinguish two cases with different standards
Targeting populations, exploring attitudes, getting
preliminary information of a topic with no good data
Rigorous scientific studies (precise measurement and
modeling of causal effects): replicability, robustness
and generalizability across populations; uncertainty
(significance levels); assessing and avoiding biaises.
Demographers tend to be more interested in the 2nd
- more demanding - case.
13. Demography, Data and Development
Essential that data be validated before use
Internal: ensuring consistency
External, via comparison with other data
There is enormous value to linking data or using
other means to confront new types of data with
old (census, survey and administrative data, etc.).
Goals: Devise robust standards of quality and
precision. Assess and avoid biases.
14. Demography, Data and Development
Big issues include:
The very rapid pace of change in new types of data,
The potential for large and evolving selectivity over
time, space and subgroups,
The disparate nature of new data, with often non-
transparent (non-public) algorithms for searches,
imputations… that can affect results,
Limits to access to data (and the levels of access
too may vary over time).
How can effective data quality assessments be
made in this situation?
15. Demography, Data and Development
Demographers are not the only ones concerned
by these issues.
But technical demographers have always been
keenly interested in assessing data quality, and
some demographic methods may be of value for
this work.
16. Demography, Data and Development
Call for a “Data Revolution” to support the
UN 2030 Development Agenda (SDGs)
The data landscape is very rapidly changing at
present: volume, speed and type of data; technologies;
number of producers and users, etc.
Notion that better evidence should lead to more
effective decisions, development initiatives, and
improved accountability.
Core elements of the DR: making better data more
rapidly available, more open and accessible, and
integrating new and old types of data.
17. Demography, Data and Development
MDGs versus SDGs
SDGs: massive increase in data requirements
Number of quantifiable indicators
Nbr of: Goals Indicators Geography
2000-2015 MDGs 8 60 LMICs
2015-2030 SDGs 17 230 World
These SDG indicators should be disaggregated
(/space, sex, subgroup), to assure that “no one is
left behind”.
(SDGs = Sustainable Development Goals, 2015-2030
MDGs = Millennium development goals, 2000-2015)
18. Demography, Data and Development
Yet already big data gaps for MDGs. Ex. for Africa:
2005: 11/51 countries had comparable poverty
estimates.
CRVS: < 6% of countries have barely viable data.
To address this, there is an urgent need to:
make effective use of new types of data,
develop new methods,
restructure and link data sources, and
develop the capacity of institutions in LMICs to
collect, edit, analyse and use new data.
Enormous challenges
19. Demography, Data and Development
Aren’t these goals unrealistic?
In part yes, especially in the short term.
Then should we care about them?
Yes. This agenda addresses hugely important
and urgent issues facing the world. Even partial
success is important.
Demographers and computer data scientists have
important roles to play in this effort.
20. Demography, Data and Development
The SDGs aim to improve human welfare through
inclusive socioeconomic progress, while protecting
the environment.
Focus on three core issues
Poverty reduction (economic development),
Environmental sustainability, and
Population growth.
21. Demography, Data and Development
Good news: Economic growth and related advances
(health, nutrition, schooling…) have greatly reduced
extreme poverty
Absolute poverty
is defined as living
on < $1.90 US per
day (in 2011 $)
Past 25 years:
improvements
driven in large part
by rapid economic
growth in Asia.
22. Demography, Data and Development
Today, ±700 million people live in absolute (extreme)
poverty. Many more live in yet very difficult conditions.
80% of the extreme poor are in sub-Saharan Africa and
South Asia – the two regions that will have rapid
population growth in upcoming decades.
Most live in rural areas and are poorly educated. Over
half are < 18 years of age. The quality of their upbringing
will have large effects on the future of our world.
To alleviate suffering and provide these people
with a chance at decent lives, inclusive
economic development must continue (SDG 8…)
23. Demography, Data and Development
Worrisome and urgent: the global environment
Clear evidence of rapid climate change and other types
of environmental degradation (e.g. destruction of ocean
fish stocks from overfishing, pollution and rising acidity).
Many scientists doubt that the 2015 Paris Agreement
aiming to limit global warming to 2 degrees is achievable.
Others argue that even attaining this goal is insufficient to
avoid devastating climatic change.
We are already living beyond LT sustainable thresholds.
The growth needed to reduce poverty must occur in
ways that simultaneously reduces the impact of human
activities on the environment (SDGs 12-15).
24. Demography, Data and Development
Major complication: rapid population growth
2017-2100: projected 3.7 billion increase in population
size (± entire world population in 1970), to 11.2 billion.
79% of this growth will occur in sub-Saharan Africa;
most of the rest in South/Central Asia.
The population of SSA will grow by nearly 3 billion
(= 1.4 X current pop of N & S America, and Europe).
Growth is caused by high fertility relative to mortality,
and to the young age structure (SSA median age is
18.5 → population growth momentum).
26. Demography, Data and Development
Prospects for environmental sustainability
As income levels and population sizes grow, there will
be a strong tendency for carbon use in Africa and
South Asia to increase significantly.
As incomes rise from very low levels, people will seek
to improve their living standards by buying fridges,
TVs, mopeds, cars… → ↑ in energy use.
The challenge is to improve human welfare while
accommodating rapid population growth and reducing
impacts (pollution…) on the environment → achieving a
LT population-economic-environmental balance ASAP.
27. Demography, Data and Development
Success will require environmentally friendly growth,
technological advances, and rapid falls in fertility.
Fertility reductions require parents in LMICs to be
motivated to invest more in each child by limiting
their fertility (better schooling…), along with the
ability to do so (good access to contraception).
Sustainable development and Falling fertility are thus
interrelated: improved schooling, lower child mortality
and urbanisation entices parents to opt for fewer
children, good access to contraception provides the
means, and lower fertility is an essential ingredient to
attaining a sustainable world.
28. Demography, Data and Development
Achieving this will be extraordinarily difficult.
Not achieving it will be a catastrophe: continued misery
for large parts of the world population, and risking
disastrous environmental change.
Improvements to the evidence base – the “Data
Revolution” – will be of real value for the design of
more effective policy and interventions.
The participation of cutting-edge computer data scientists
and demographers in Data Revolution work is critical.
[Examples: Big Data and the Well-Being of Women and Girls
Applications on the Social Scientific Frontier (Bapu Vaitla et al.,
4/2017, http://data2x.org/wp-content/uploads/2017/03/Big-Data-
and-the-Well-Being-of-Women-and-Girls.pdf]