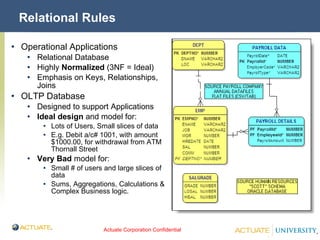
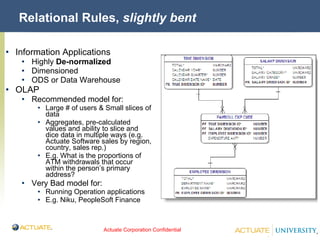
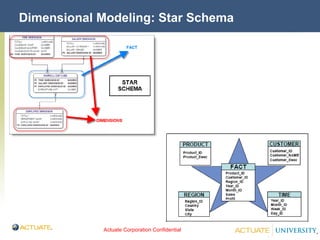
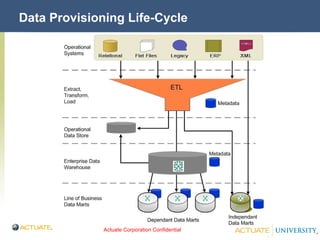
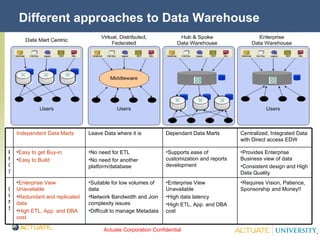
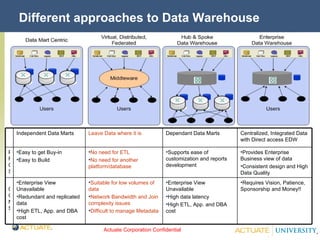
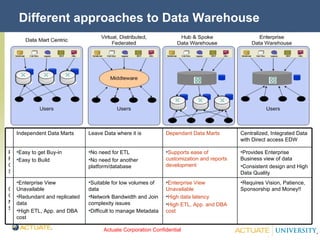
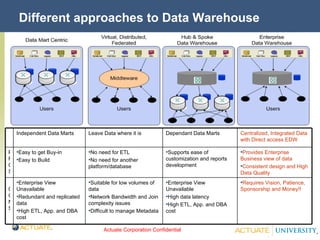
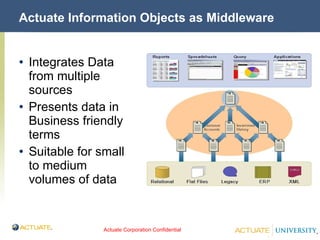
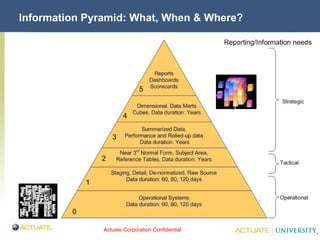
Data Provisioning An Enterprise and  Business Perspective
Problem Statement…. “ There's too much data and it's duplicated hundreds of times. The mistake companies make is that they start from the data they have. They need to ask what data do their users need and what are the questions they are asking. Understand the questions, how they can be answered and what kind of data is needed.” Quote by CIO of Major Corporation
The main dimensions of BI : Reporting (Operational) Access and Format data from multiple disparate sources DB2, Oracle, Sybase or SalesForce.com Provides Holistic view of business New customer acquisition at Actuate touches: Billing Licensing Support Shipping Inherently Semantic in nature Customers, Order history, Balance Payment, Products
The main dimensions of BI : Analysis (tactical) Need to view data in “dimensions” and “hierarchies” Sales (d) by Country (h), by Time period (h) Explore and Analyze Ad-hoc reporting Pivot data Drill down to details Highly summarized and concise view of data Technology & Interfaces optimized for high performance
The main dimensions of BI : Dashboards & Scorecards (strategic) Monitor KPIs,Metrics & Exceptions Extensive use of Alerts and Tracking mechanisms Data emphasized with graphs and visual controls
What do end users really care about? Easier access to data Quick/Reasonable Performance
Report developers worst Nightmare……
Relational Rules Operational Applications Relational Database Highly  Normalized  (3NF = Ideal) Emphasis on Keys, Relationships, Joins OLTP Database Designed to support Applications Ideal design  and model for: Lots of Users, Small slices of data E.g. Debit a/c# 1001, with amount $1000.00, for withdrawal from ATM Thornall Street Very Bad  model for: Small # of users and large slices of data Sums, Aggregations, Calculations & Complex Business logic.
Relational Rules,  slightly bent Information Applications Highly  De-normalized Dimensioned ODS or Data Warehouse OLAP Recommended model for: Large # of users & Small slices of data Aggregates, pre-calculated values and ability to slice and dice data in multiple ways (e.g. Actuate Software sales by region, country, sales rep.) E.g. What is the proportions of ATM withdrawals that occur within the person’s primary address? Very Bad model for: Running Operation applications E.g. Niku, PeopleSoft Finance
Dimensional Modeling: Star Schema
Recognizing ‘Facts’ and ‘Dimensions’ Facts Has what you are trying to MEASURE (e.g. Sales, Expenditures) Usually Numeric's Dimensions Qualify’s Measures (e.g. Products, Departments, Time) Hierarchical in nature (NAO   East   West   Central)
Extracting requirements to build the data model Business users drive processes and projects Do not ask precise questions such as “what numbers do you want?” They want everything in a report or flat file so they can do their own analysis Usually a huge gap exists between what they WANT and what they NEED Have them express in Analytical terms I would like to know what is the distribution of Actuate Software Sales by Product type and Region. What is the proportion of Revenue that comes from ‘A (new)’ versus ‘B (existing)’ customers Your Objective? Is to identify the  ‘measures’  and  ‘dimensions’  needed for your data model I would like to know what is the distribution of  Actuate Software Sales  by  Product type  and  Region  What is the proportion of  Revenue  that comes from ‘A (new)’ versus ‘B (existing)’  customers
Data Provisioning Life-Cycle
Different approaches to Data Warehouse Requires Vision, Patience, Sponsorship and Money!! Enterprise View Unavailable High data latency High ETL, App. and DBA cost Suitable for low volumes of data Network Bandwidth and Join complexity issues Difficult to manage Metadata Enterprise View Unavailable Redundant and replicated data High ETL, App. and DBA cost CONS Provides Enterprise Business view of data Consistent design and High Data Quality Supports ease of customization and reports development No need for ETL No need for another platform/database Easy to get Buy-in Easy to Build PROS Centralized, Integrated Data with Direct access EDW Dependant Data Marts Leave Data where it is Independent Data Marts
Actuate Information Objects as Middleware Integrates Data from multiple sources Presents data in Business friendly terms Suitable for small to medium volumes of data
Information Pyramid: What, When & Where? 0 1 2 3 4 5
How companies end up with 1000’s of reports Client with International operations, multiple systems and many databases created to support local ad-hoc and transaction management. Unable to consolidate data to satisfy reporting requirements. Decides to build a Data Warehouse. After many iterations, DW is finally complete with information from many subject areas and provides significant strategic business value. The new DW satisfied many of the standard and static reporting needs (reports once created, did not need to be modified). However as the # of users of the DW grew, reporting requirements became more complex in nature. The client soon realized that the reports became more and more dynamic in nature.
How companies end up with 1000’s of reports…contd. The growth in # of reports was due to the fact that users now had access to data and could view and analyze it in multiple ways and thus emerged the need for Ad-hoc reporting. The increase in # of reports and the increase in volume of data being requested by them had a very drastic impact on performance. Upon analysis the client found that the data warehouse was in a 3NF and followed an E/R model. To solve the performance problem the client created a new set of de-normalized tables in the DW. The process of de-normalizing tables was  done on a report-by-report basis.
How companies end up with 1000’s of reports…contd. Very soon the client ended up with a DW and a few thousand de-normalized tables. These de-normalized tables were supposed to provide easy and fast access to data. However in reality, these tables were very complex to manage, had inconsistent data and difficult to link. This made the DW very inefficient to maintain and use for reporting. The client realized the problems of creating de-normalized tables for every report and decided to adopt another strategy.
How companies end up with 1000’s of reports…contd. The client then decided to undertake a new project to maintain the reporting tables or data structures in a separate, ‘dimensioned’ database or ‘data mart’. The new dimensioned model would not only help users with ad-hoc analysis, but also be easier to read and understand. In addition, the dimensioned model would give much better performance than the E/R modeled DW
What would you have done differently?

Data Provisioning & Optimization

  • 1.
    Data Provisioning AnEnterprise and Business Perspective
  • 2.
    Problem Statement…. “There's too much data and it's duplicated hundreds of times. The mistake companies make is that they start from the data they have. They need to ask what data do their users need and what are the questions they are asking. Understand the questions, how they can be answered and what kind of data is needed.” Quote by CIO of Major Corporation
  • 3.
    The main dimensionsof BI : Reporting (Operational) Access and Format data from multiple disparate sources DB2, Oracle, Sybase or SalesForce.com Provides Holistic view of business New customer acquisition at Actuate touches: Billing Licensing Support Shipping Inherently Semantic in nature Customers, Order history, Balance Payment, Products
  • 4.
    The main dimensionsof BI : Analysis (tactical) Need to view data in “dimensions” and “hierarchies” Sales (d) by Country (h), by Time period (h) Explore and Analyze Ad-hoc reporting Pivot data Drill down to details Highly summarized and concise view of data Technology & Interfaces optimized for high performance
  • 5.
    The main dimensionsof BI : Dashboards & Scorecards (strategic) Monitor KPIs,Metrics & Exceptions Extensive use of Alerts and Tracking mechanisms Data emphasized with graphs and visual controls
  • 6.
    What do endusers really care about? Easier access to data Quick/Reasonable Performance
  • 7.
    Report developers worstNightmare……
  • 8.
    Relational Rules OperationalApplications Relational Database Highly Normalized (3NF = Ideal) Emphasis on Keys, Relationships, Joins OLTP Database Designed to support Applications Ideal design and model for: Lots of Users, Small slices of data E.g. Debit a/c# 1001, with amount $1000.00, for withdrawal from ATM Thornall Street Very Bad model for: Small # of users and large slices of data Sums, Aggregations, Calculations & Complex Business logic.
  • 9.
    Relational Rules, slightly bent Information Applications Highly De-normalized Dimensioned ODS or Data Warehouse OLAP Recommended model for: Large # of users & Small slices of data Aggregates, pre-calculated values and ability to slice and dice data in multiple ways (e.g. Actuate Software sales by region, country, sales rep.) E.g. What is the proportions of ATM withdrawals that occur within the person’s primary address? Very Bad model for: Running Operation applications E.g. Niku, PeopleSoft Finance
  • 10.
  • 11.
    Recognizing ‘Facts’ and‘Dimensions’ Facts Has what you are trying to MEASURE (e.g. Sales, Expenditures) Usually Numeric's Dimensions Qualify’s Measures (e.g. Products, Departments, Time) Hierarchical in nature (NAO  East  West  Central)
  • 12.
    Extracting requirements tobuild the data model Business users drive processes and projects Do not ask precise questions such as “what numbers do you want?” They want everything in a report or flat file so they can do their own analysis Usually a huge gap exists between what they WANT and what they NEED Have them express in Analytical terms I would like to know what is the distribution of Actuate Software Sales by Product type and Region. What is the proportion of Revenue that comes from ‘A (new)’ versus ‘B (existing)’ customers Your Objective? Is to identify the ‘measures’ and ‘dimensions’ needed for your data model I would like to know what is the distribution of Actuate Software Sales by Product type and Region What is the proportion of Revenue that comes from ‘A (new)’ versus ‘B (existing)’ customers
  • 13.
  • 14.
    Different approaches toData Warehouse Requires Vision, Patience, Sponsorship and Money!! Enterprise View Unavailable High data latency High ETL, App. and DBA cost Suitable for low volumes of data Network Bandwidth and Join complexity issues Difficult to manage Metadata Enterprise View Unavailable Redundant and replicated data High ETL, App. and DBA cost CONS Provides Enterprise Business view of data Consistent design and High Data Quality Supports ease of customization and reports development No need for ETL No need for another platform/database Easy to get Buy-in Easy to Build PROS Centralized, Integrated Data with Direct access EDW Dependant Data Marts Leave Data where it is Independent Data Marts
  • 15.
    Different approaches toData Warehouse Requires Vision, Patience, Sponsorship and Money!! Enterprise View Unavailable High data latency High ETL, App. and DBA cost Suitable for low volumes of data Network Bandwidth and Join complexity issues Difficult to manage Metadata Enterprise View Unavailable Redundant and replicated data High ETL, App. and DBA cost CONS Provides Enterprise Business view of data Consistent design and High Data Quality Supports ease of customization and reports development No need for ETL No need for another platform/database Easy to get Buy-in Easy to Build PROS Centralized, Integrated Data with Direct access EDW Dependant Data Marts Leave Data where it is Independent Data Marts
  • 16.
    Different approaches toData Warehouse Requires Vision, Patience, Sponsorship and Money!! Enterprise View Unavailable High data latency High ETL, App. and DBA cost Suitable for low volumes of data Network Bandwidth and Join complexity issues Difficult to manage Metadata Enterprise View Unavailable Redundant and replicated data High ETL, App. and DBA cost CONS Provides Enterprise Business view of data Consistent design and High Data Quality Supports ease of customization and reports development No need for ETL No need for another platform/database Easy to get Buy-in Easy to Build PROS Centralized, Integrated Data with Direct access EDW Dependant Data Marts Leave Data where it is Independent Data Marts
  • 17.
    Different approaches toData Warehouse Requires Vision, Patience, Sponsorship and Money!! Enterprise View Unavailable High data latency High ETL, App. and DBA cost Suitable for low volumes of data Network Bandwidth and Join complexity issues Difficult to manage Metadata Enterprise View Unavailable Redundant and replicated data High ETL, App. and DBA cost CONS Provides Enterprise Business view of data Consistent design and High Data Quality Supports ease of customization and reports development No need for ETL No need for another platform/database Easy to get Buy-in Easy to Build PROS Centralized, Integrated Data with Direct access EDW Dependant Data Marts Leave Data where it is Independent Data Marts
  • 18.
    Actuate Information Objectsas Middleware Integrates Data from multiple sources Presents data in Business friendly terms Suitable for small to medium volumes of data
  • 19.
    Information Pyramid: What,When & Where? 0 1 2 3 4 5
  • 20.
    How companies endup with 1000’s of reports Client with International operations, multiple systems and many databases created to support local ad-hoc and transaction management. Unable to consolidate data to satisfy reporting requirements. Decides to build a Data Warehouse. After many iterations, DW is finally complete with information from many subject areas and provides significant strategic business value. The new DW satisfied many of the standard and static reporting needs (reports once created, did not need to be modified). However as the # of users of the DW grew, reporting requirements became more complex in nature. The client soon realized that the reports became more and more dynamic in nature.
  • 21.
    How companies endup with 1000’s of reports…contd. The growth in # of reports was due to the fact that users now had access to data and could view and analyze it in multiple ways and thus emerged the need for Ad-hoc reporting. The increase in # of reports and the increase in volume of data being requested by them had a very drastic impact on performance. Upon analysis the client found that the data warehouse was in a 3NF and followed an E/R model. To solve the performance problem the client created a new set of de-normalized tables in the DW. The process of de-normalizing tables was done on a report-by-report basis.
  • 22.
    How companies endup with 1000’s of reports…contd. Very soon the client ended up with a DW and a few thousand de-normalized tables. These de-normalized tables were supposed to provide easy and fast access to data. However in reality, these tables were very complex to manage, had inconsistent data and difficult to link. This made the DW very inefficient to maintain and use for reporting. The client realized the problems of creating de-normalized tables for every report and decided to adopt another strategy.
  • 23.
    How companies endup with 1000’s of reports…contd. The client then decided to undertake a new project to maintain the reporting tables or data structures in a separate, ‘dimensioned’ database or ‘data mart’. The new dimensioned model would not only help users with ad-hoc analysis, but also be easier to read and understand. In addition, the dimensioned model would give much better performance than the E/R modeled DW
  • 24.
    What would youhave done differently?

Editor's Notes

  • #2 Information consumers have an insatiable appetite for information. When you ask a business user the question “What information do you need?” the answer usually is “I need everything and I need it quickly” In the real world there is always a conflict between business requirements and performance and usability.
  • #12 Dimension Tables Contain information by which a Fact can be presented Include multiple levels of the Dimension (example: Market) Values for all levels of the Dimension are known (example: Time) Related to Fact Table at lowest level of Dimension (example: Market) Exist in a one-to-many relationship with the Fact Table Fact Table Designed to answer questions for one business measure Contains only single-valued Facts Represents derived values Must be applicable to all attached Dimension Tables One per Star Schema