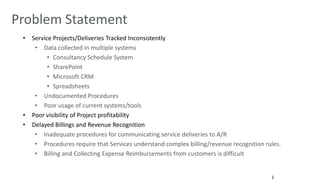
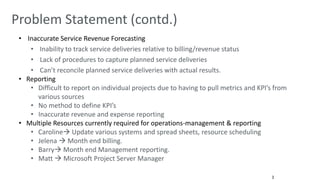
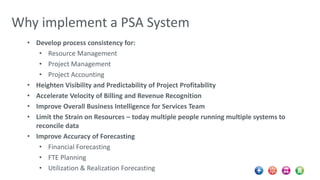
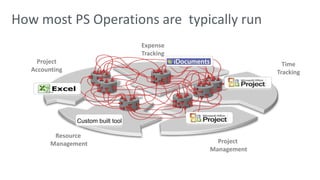
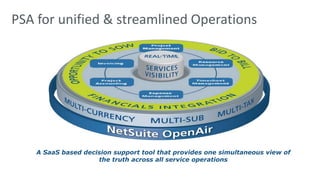
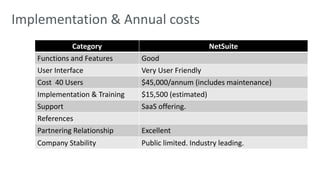
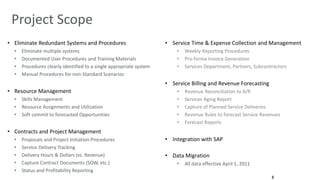
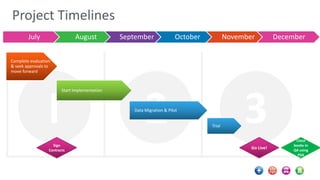
ActiveEfficiencyTM starts here
2 
Problem Statement 
• Service Projects/Deliveries Tracked Inconsistently 
• Data collected in multiple systems 
• Consultancy Schedule System 
• SharePoint 
• Microsoft CRM 
• Spreadsheets 
• Undocumented Procedures 
• Poor usage of current systems/tools 
• Poor visibility of Project profitability 
• Delayed Billings and Revenue Recognition 
• Inadequate procedures for communicating service deliveries to A/R 
• Procedures require that Services understand complex billing/revenue recognition rules. 
• Billing and Collecting Expense Reimbursements from customers is difficult
3 
Problem Statement (contd.) 
• Inaccurate Service Revenue Forecasting 
• Inability to track service deliveries relative to billing/revenue status 
• Lack of procedures to capture planned service deliveries 
• Can’t reconcile planned service deliveries with actual results. 
• Reporting 
• Difficult to report on individual projects due to having to pull metrics and KPI’s from 
various sources 
• No method to define KPI’s 
• Inaccurate revenue and expense reporting 
• Multiple Resources currently required for operations-management & reporting 
• Caroline Update various systems and spread sheets, resource scheduling 
• Jelena  Month end billing. 
• Barry Month end Management reporting. 
• Matt  Microsoft Project Server Manager
Why implement a PSA System 
• Develop process consistency for: 
• Resource Management 
• Project Management 
• Project Accounting 
• Heighten Visibility and Predictability of Project Profitability 
• Accelerate Velocity of Billing and Revenue Recognition 
• Improve Overall Business Intelligence for Services Team 
• Limit the Strain on Resources – today multiple people running multiple systems to 
reconcile data 
• Improve Accuracy of Forecasting 
• Financial Forecasting 
• FTE Planning 
• Utilization & Realization Forecasting
Time 
Tracking 
How most PS Operations are typically run 
Expense 
Tracking 
Project 
Management 
Project 
Accounting 
Custom built tool 
Resource 
Management
PSA for unified & streamlined Operations 
A SaaS based decision support tool that provides one simultaneous view of 
the truth across all service operations
Implementation & Annual costs 
Category NetSuite 
Functions and Features Good 
User Interface Very User Friendly 
Cost 40 Users $45,000/annum (includes maintenance) 
Implementation & Training $15,500 (estimated) 
Support SaaS offering. 
References 
Partnering Relationship Excellent 
Company Stability Public limited. Industry leading.
Project Scope 
• Eliminate Redundant Systems and Procedures 
• Eliminate multiple systems 
• Documented User Procedures and Training Materials 
• Procedures clearly identified to a single appropriate system 
• Manual Procedures for non-Standard Scenarios 
• Resource Management 
• Skills Management 
• Resource Assignments and Utilization 
• Soft commit to forecasted Opportunities 
• Contracts and Project Management 
• Proposals and Project Initiation Procedures 
• Service Delivery Tracking 
• Delivery Hours & Dollars (vs. Revenue) 
• Capture Contract Documents (SOW, etc.) 
• Status and Profitability Reporting 
• Service Time & Expense Collection and Management 
• Weekly Reporting Procedures 
• Pro-forma Invoice Generation 
• Services Department, Partners, Subcontractors 
8 
• Service Billing and Revenue Forecasting 
• Revenue Reconciliation to A/R 
• Services Aging Report 
• Capture of Planned Service Deliveries 
• Revenue Rules to forecast Service Revenues 
• Forecast Reports 
• Integration with SAP 
• Data Migration 
• All data effective April 1, 2011
Project Timelines 
July August September October November December 
I 2 3 
© 1E 2013 
Trial 
Complete evaluation 
& seek approvals to 
move forward 
Start Implementation 
Sign 
Contracts 
Go Live! 
Data Migration & Pilot 
Close 
books in 
Q4 using 
PSA
Employee Realization Report
Project Portfolio View
Resource Management Chart
Project Margin Heatmap
Project Burn Rate
Forecasted Revenue by Stage
Supply v Demand Report – Resource Forecast
Workspaces Module - Dashboard
Dashboard – Document Management
Expense Report
Timesheet Status Report

Professional Services Automation

  • 1.
  • 2.
    2 Problem Statement • Service Projects/Deliveries Tracked Inconsistently • Data collected in multiple systems • Consultancy Schedule System • SharePoint • Microsoft CRM • Spreadsheets • Undocumented Procedures • Poor usage of current systems/tools • Poor visibility of Project profitability • Delayed Billings and Revenue Recognition • Inadequate procedures for communicating service deliveries to A/R • Procedures require that Services understand complex billing/revenue recognition rules. • Billing and Collecting Expense Reimbursements from customers is difficult
  • 3.
    3 Problem Statement(contd.) • Inaccurate Service Revenue Forecasting • Inability to track service deliveries relative to billing/revenue status • Lack of procedures to capture planned service deliveries • Can’t reconcile planned service deliveries with actual results. • Reporting • Difficult to report on individual projects due to having to pull metrics and KPI’s from various sources • No method to define KPI’s • Inaccurate revenue and expense reporting • Multiple Resources currently required for operations-management & reporting • Caroline Update various systems and spread sheets, resource scheduling • Jelena  Month end billing. • Barry Month end Management reporting. • Matt  Microsoft Project Server Manager
  • 4.
    Why implement aPSA System • Develop process consistency for: • Resource Management • Project Management • Project Accounting • Heighten Visibility and Predictability of Project Profitability • Accelerate Velocity of Billing and Revenue Recognition • Improve Overall Business Intelligence for Services Team • Limit the Strain on Resources – today multiple people running multiple systems to reconcile data • Improve Accuracy of Forecasting • Financial Forecasting • FTE Planning • Utilization & Realization Forecasting
  • 5.
    Time Tracking Howmost PS Operations are typically run Expense Tracking Project Management Project Accounting Custom built tool Resource Management
  • 6.
    PSA for unified& streamlined Operations A SaaS based decision support tool that provides one simultaneous view of the truth across all service operations
  • 7.
    Implementation & Annualcosts Category NetSuite Functions and Features Good User Interface Very User Friendly Cost 40 Users $45,000/annum (includes maintenance) Implementation & Training $15,500 (estimated) Support SaaS offering. References Partnering Relationship Excellent Company Stability Public limited. Industry leading.
  • 8.
    Project Scope •Eliminate Redundant Systems and Procedures • Eliminate multiple systems • Documented User Procedures and Training Materials • Procedures clearly identified to a single appropriate system • Manual Procedures for non-Standard Scenarios • Resource Management • Skills Management • Resource Assignments and Utilization • Soft commit to forecasted Opportunities • Contracts and Project Management • Proposals and Project Initiation Procedures • Service Delivery Tracking • Delivery Hours & Dollars (vs. Revenue) • Capture Contract Documents (SOW, etc.) • Status and Profitability Reporting • Service Time & Expense Collection and Management • Weekly Reporting Procedures • Pro-forma Invoice Generation • Services Department, Partners, Subcontractors 8 • Service Billing and Revenue Forecasting • Revenue Reconciliation to A/R • Services Aging Report • Capture of Planned Service Deliveries • Revenue Rules to forecast Service Revenues • Forecast Reports • Integration with SAP • Data Migration • All data effective April 1, 2011
  • 9.
    Project Timelines JulyAugust September October November December I 2 3 © 1E 2013 Trial Complete evaluation & seek approvals to move forward Start Implementation Sign Contracts Go Live! Data Migration & Pilot Close books in Q4 using PSA
  • 10.
  • 11.
  • 12.
  • 13.
  • 14.
  • 15.
  • 16.
    Supply v DemandReport – Resource Forecast
  • 17.
  • 18.
  • 19.
  • 20.