Downloaded 125 times
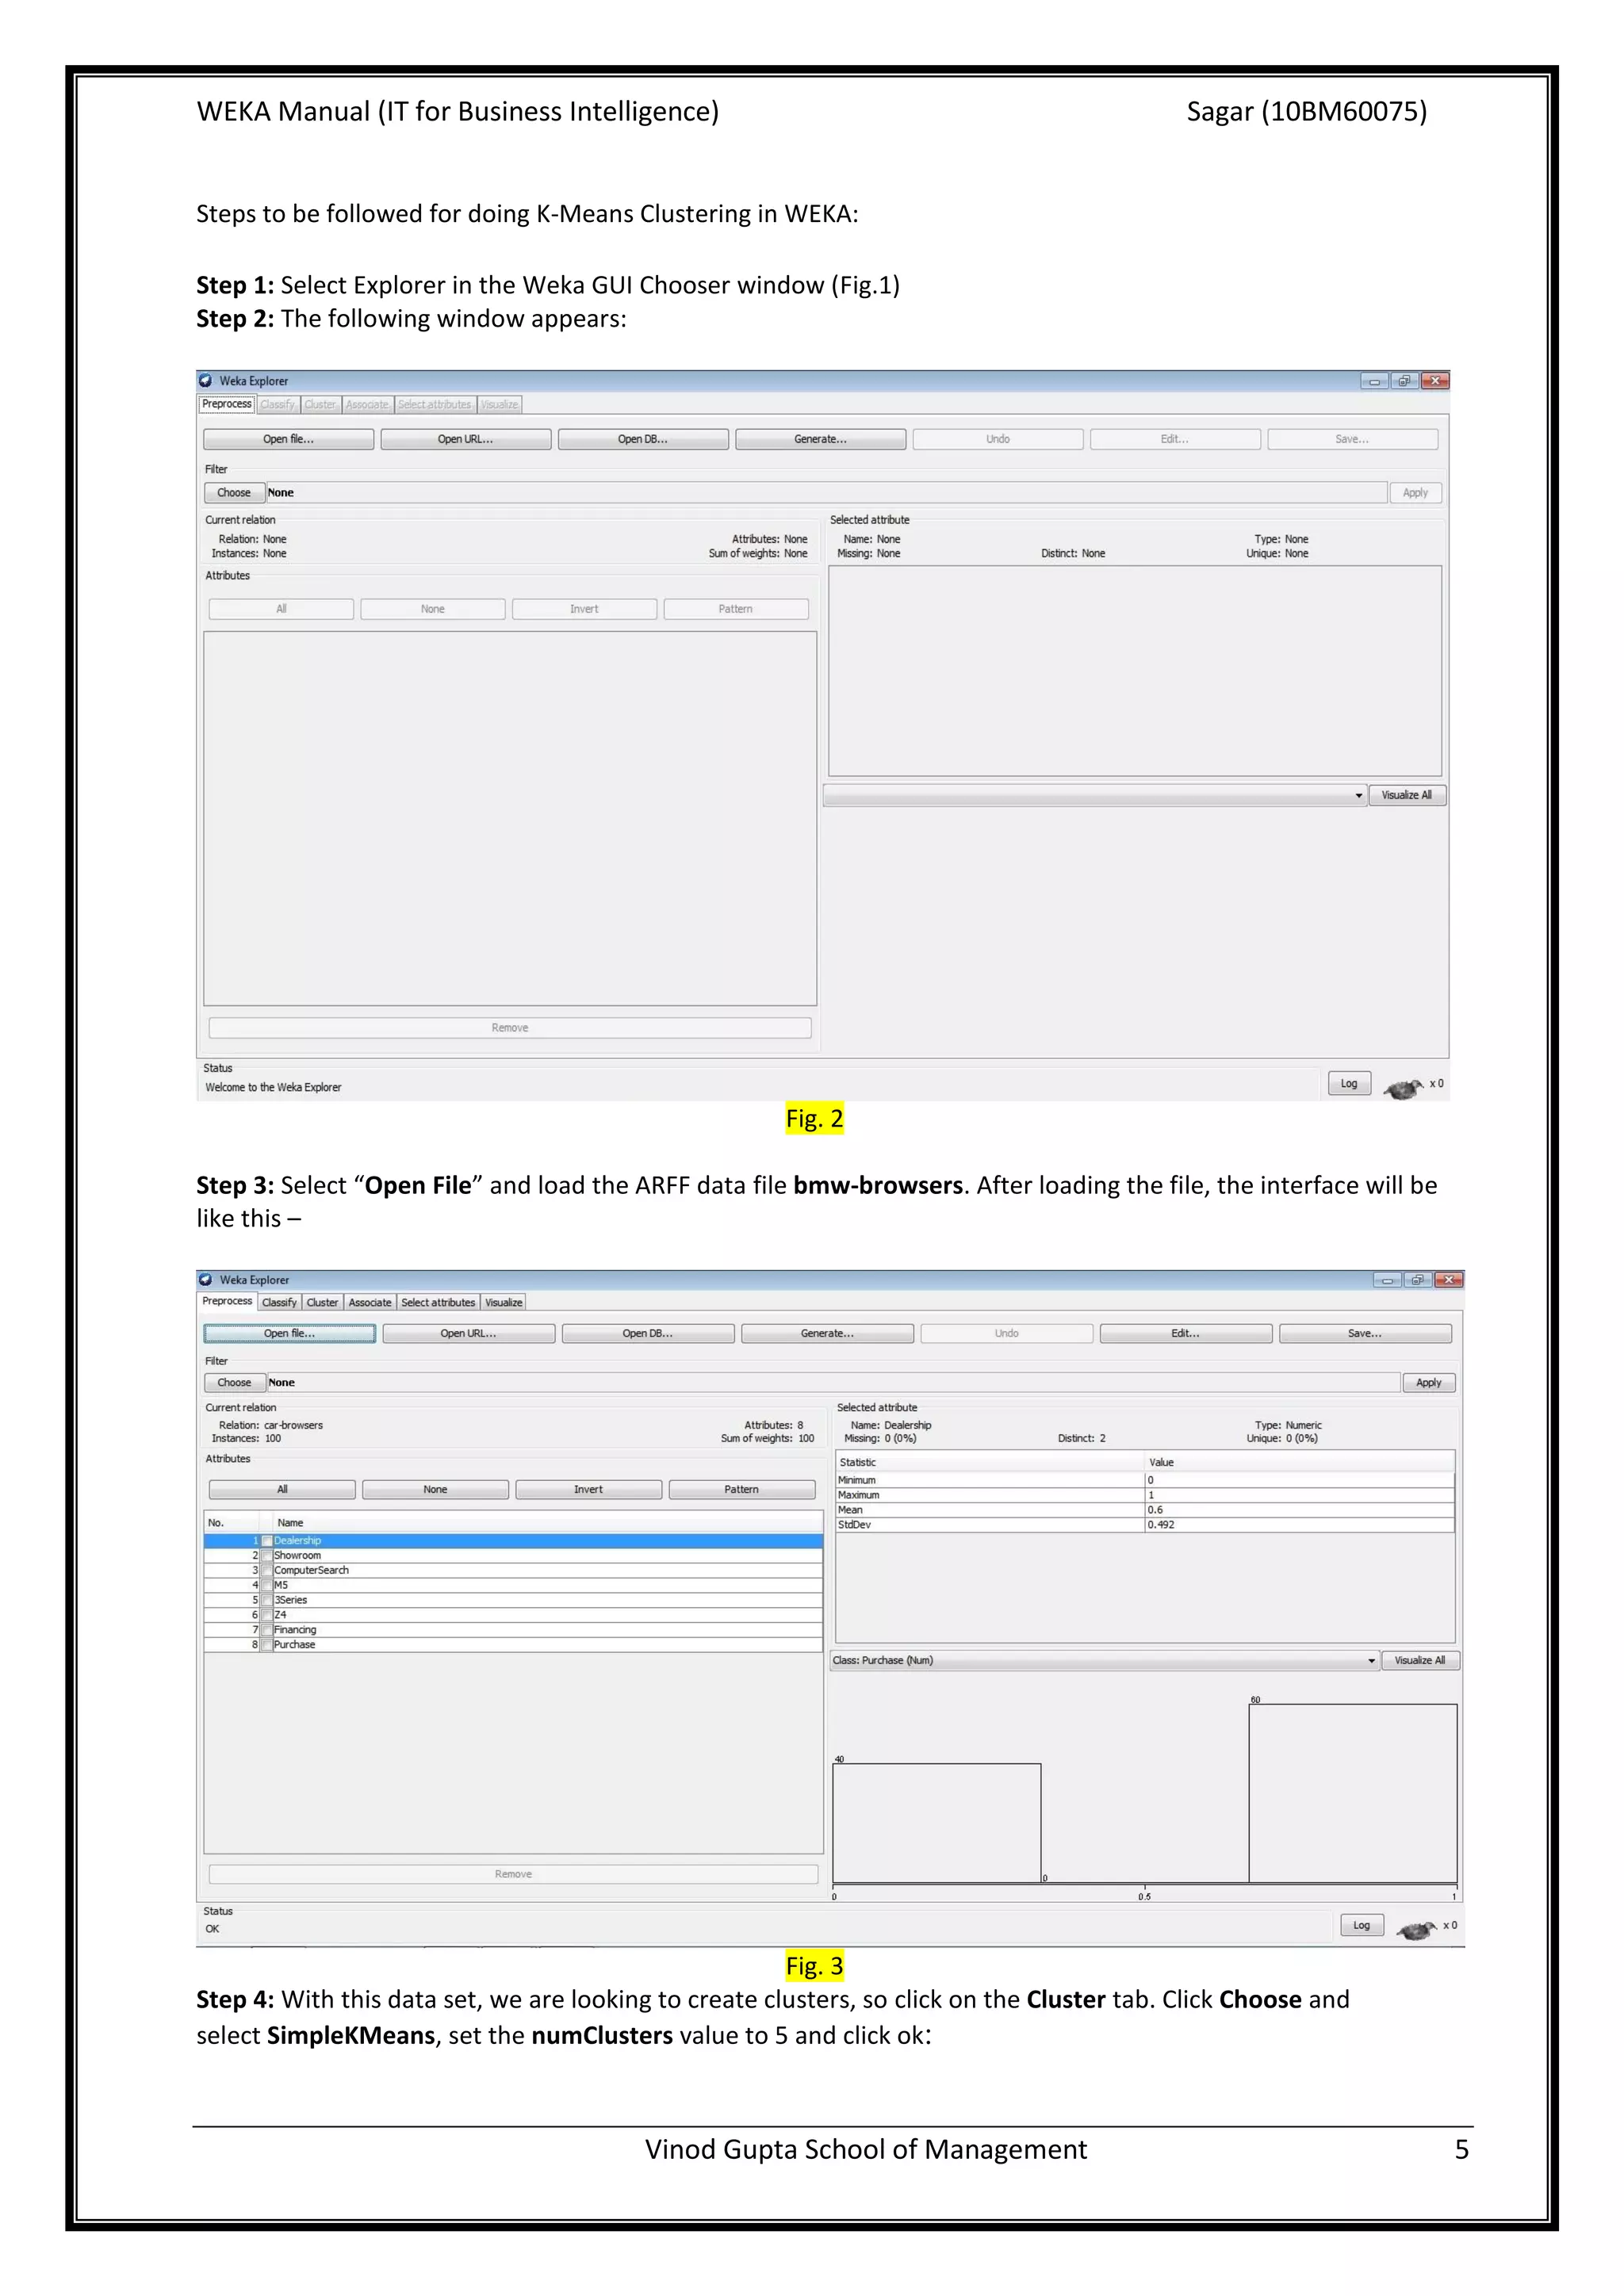
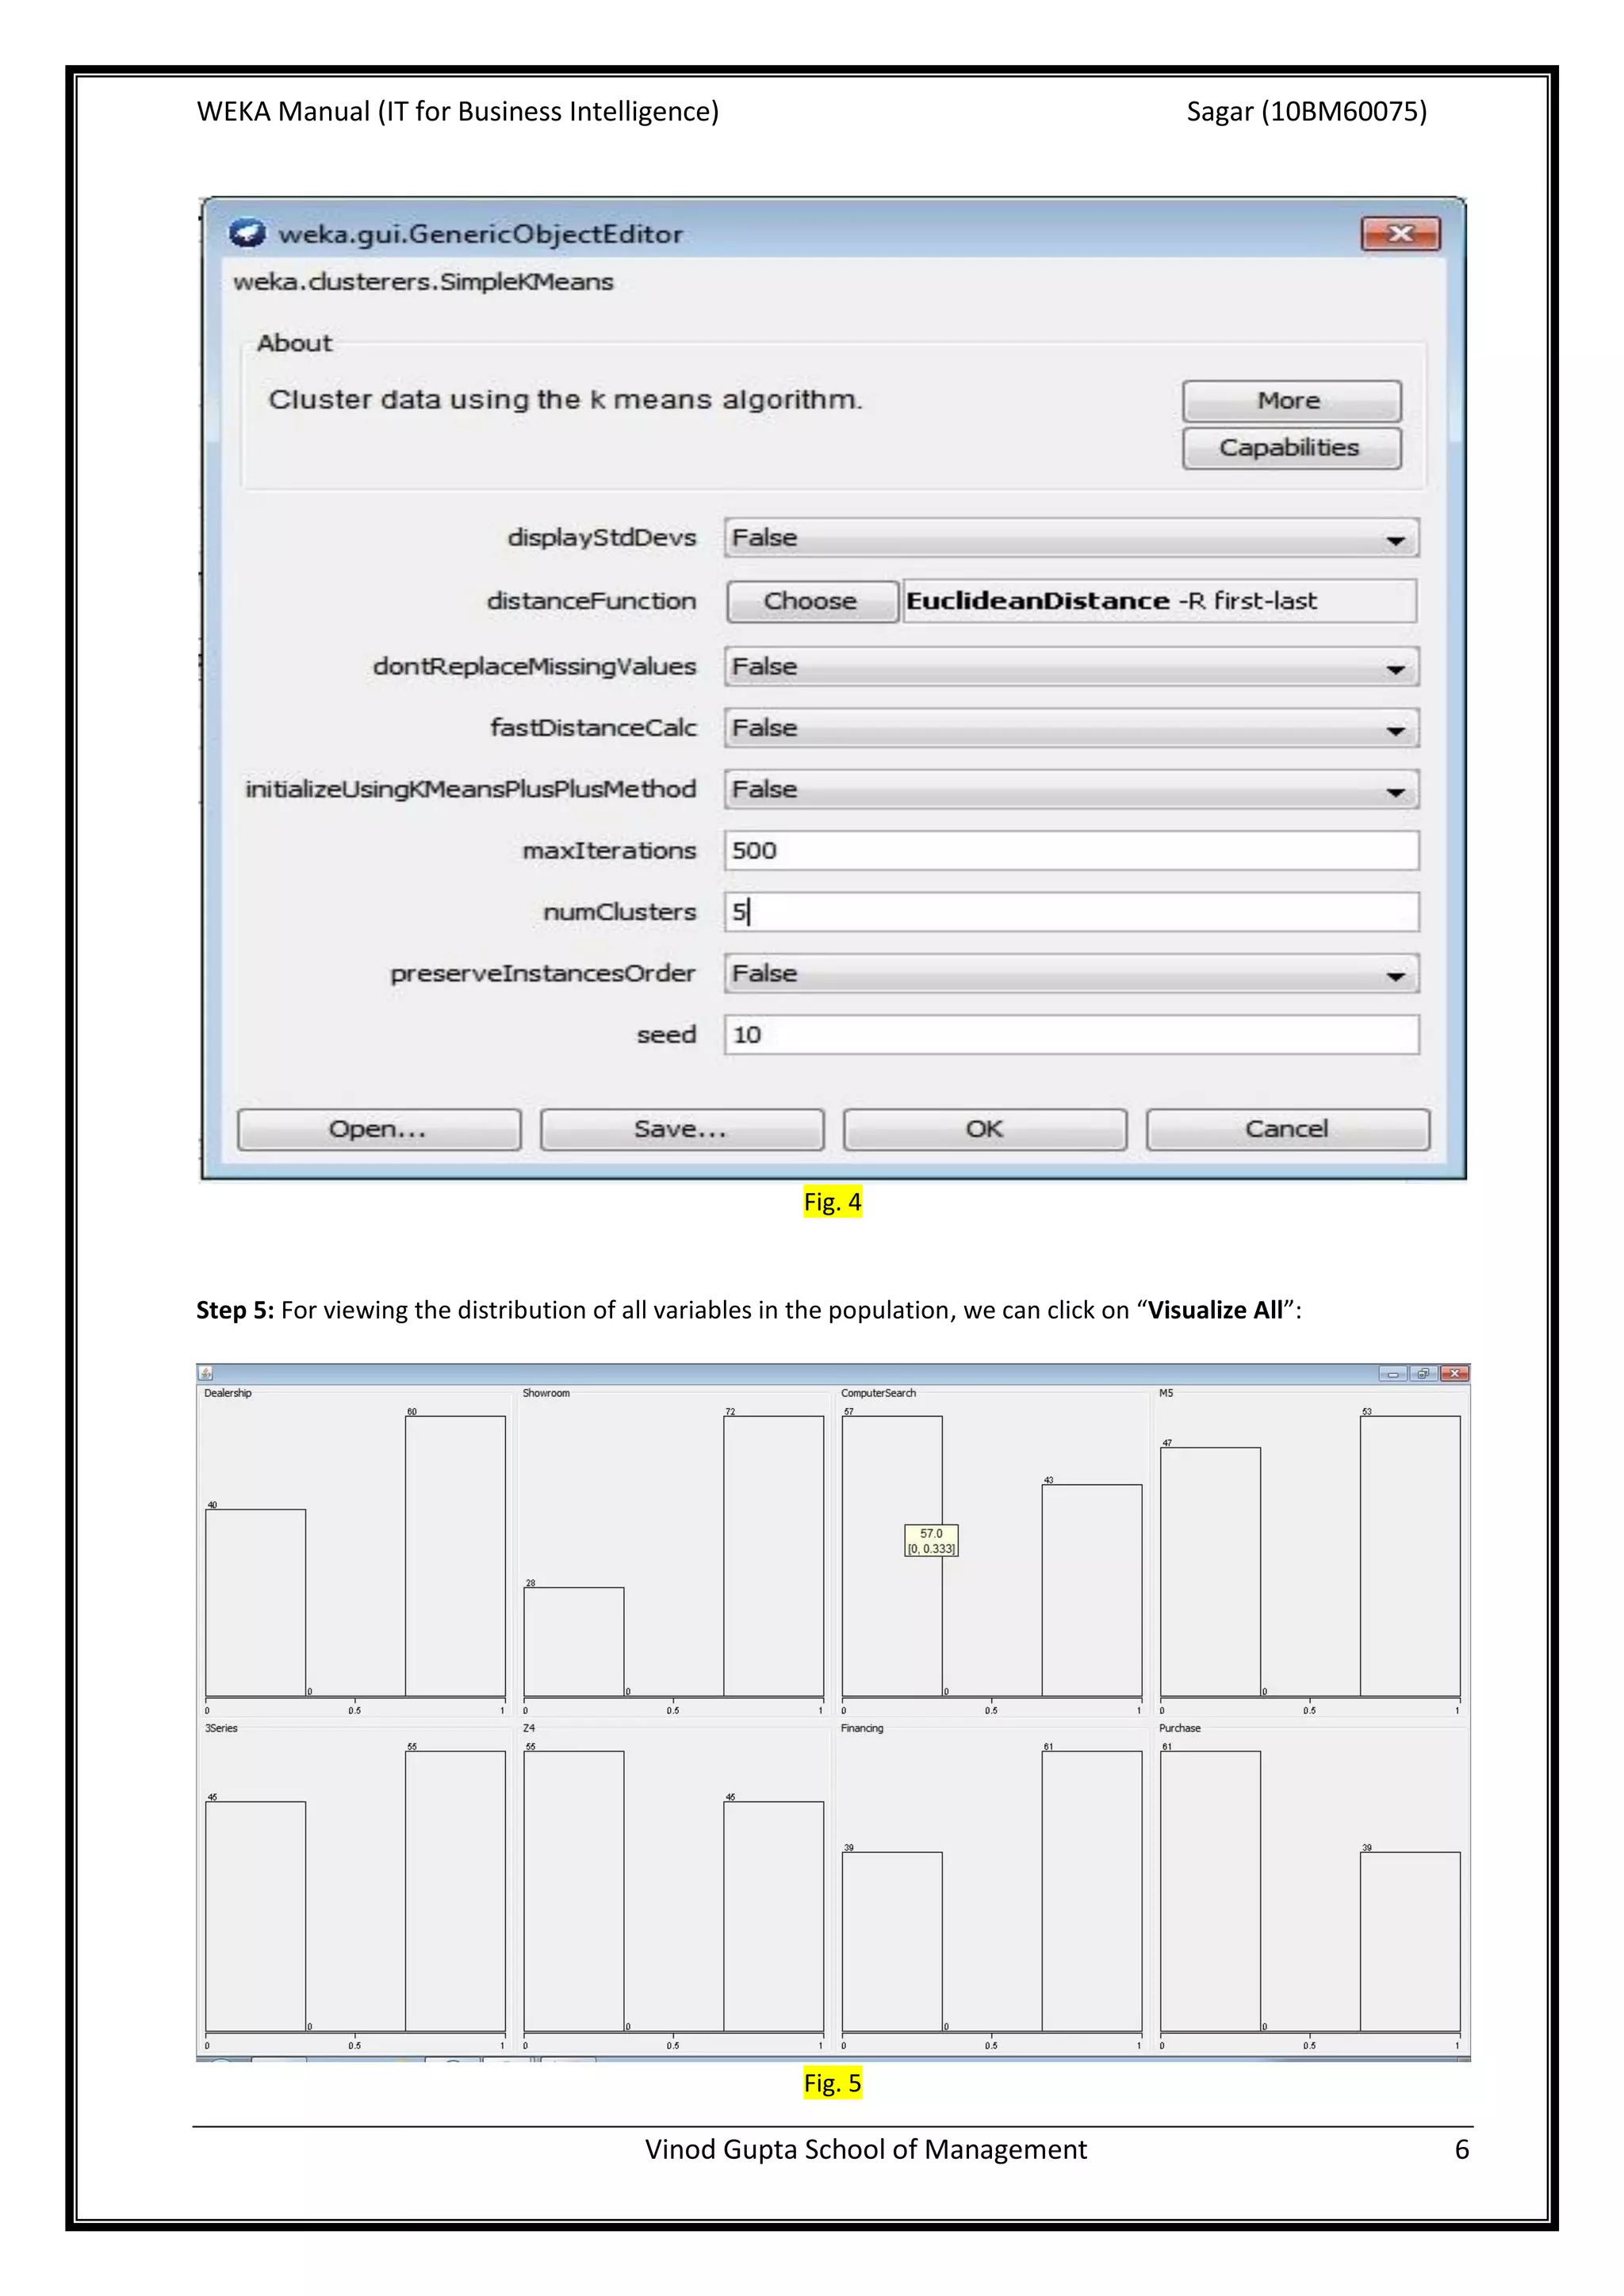
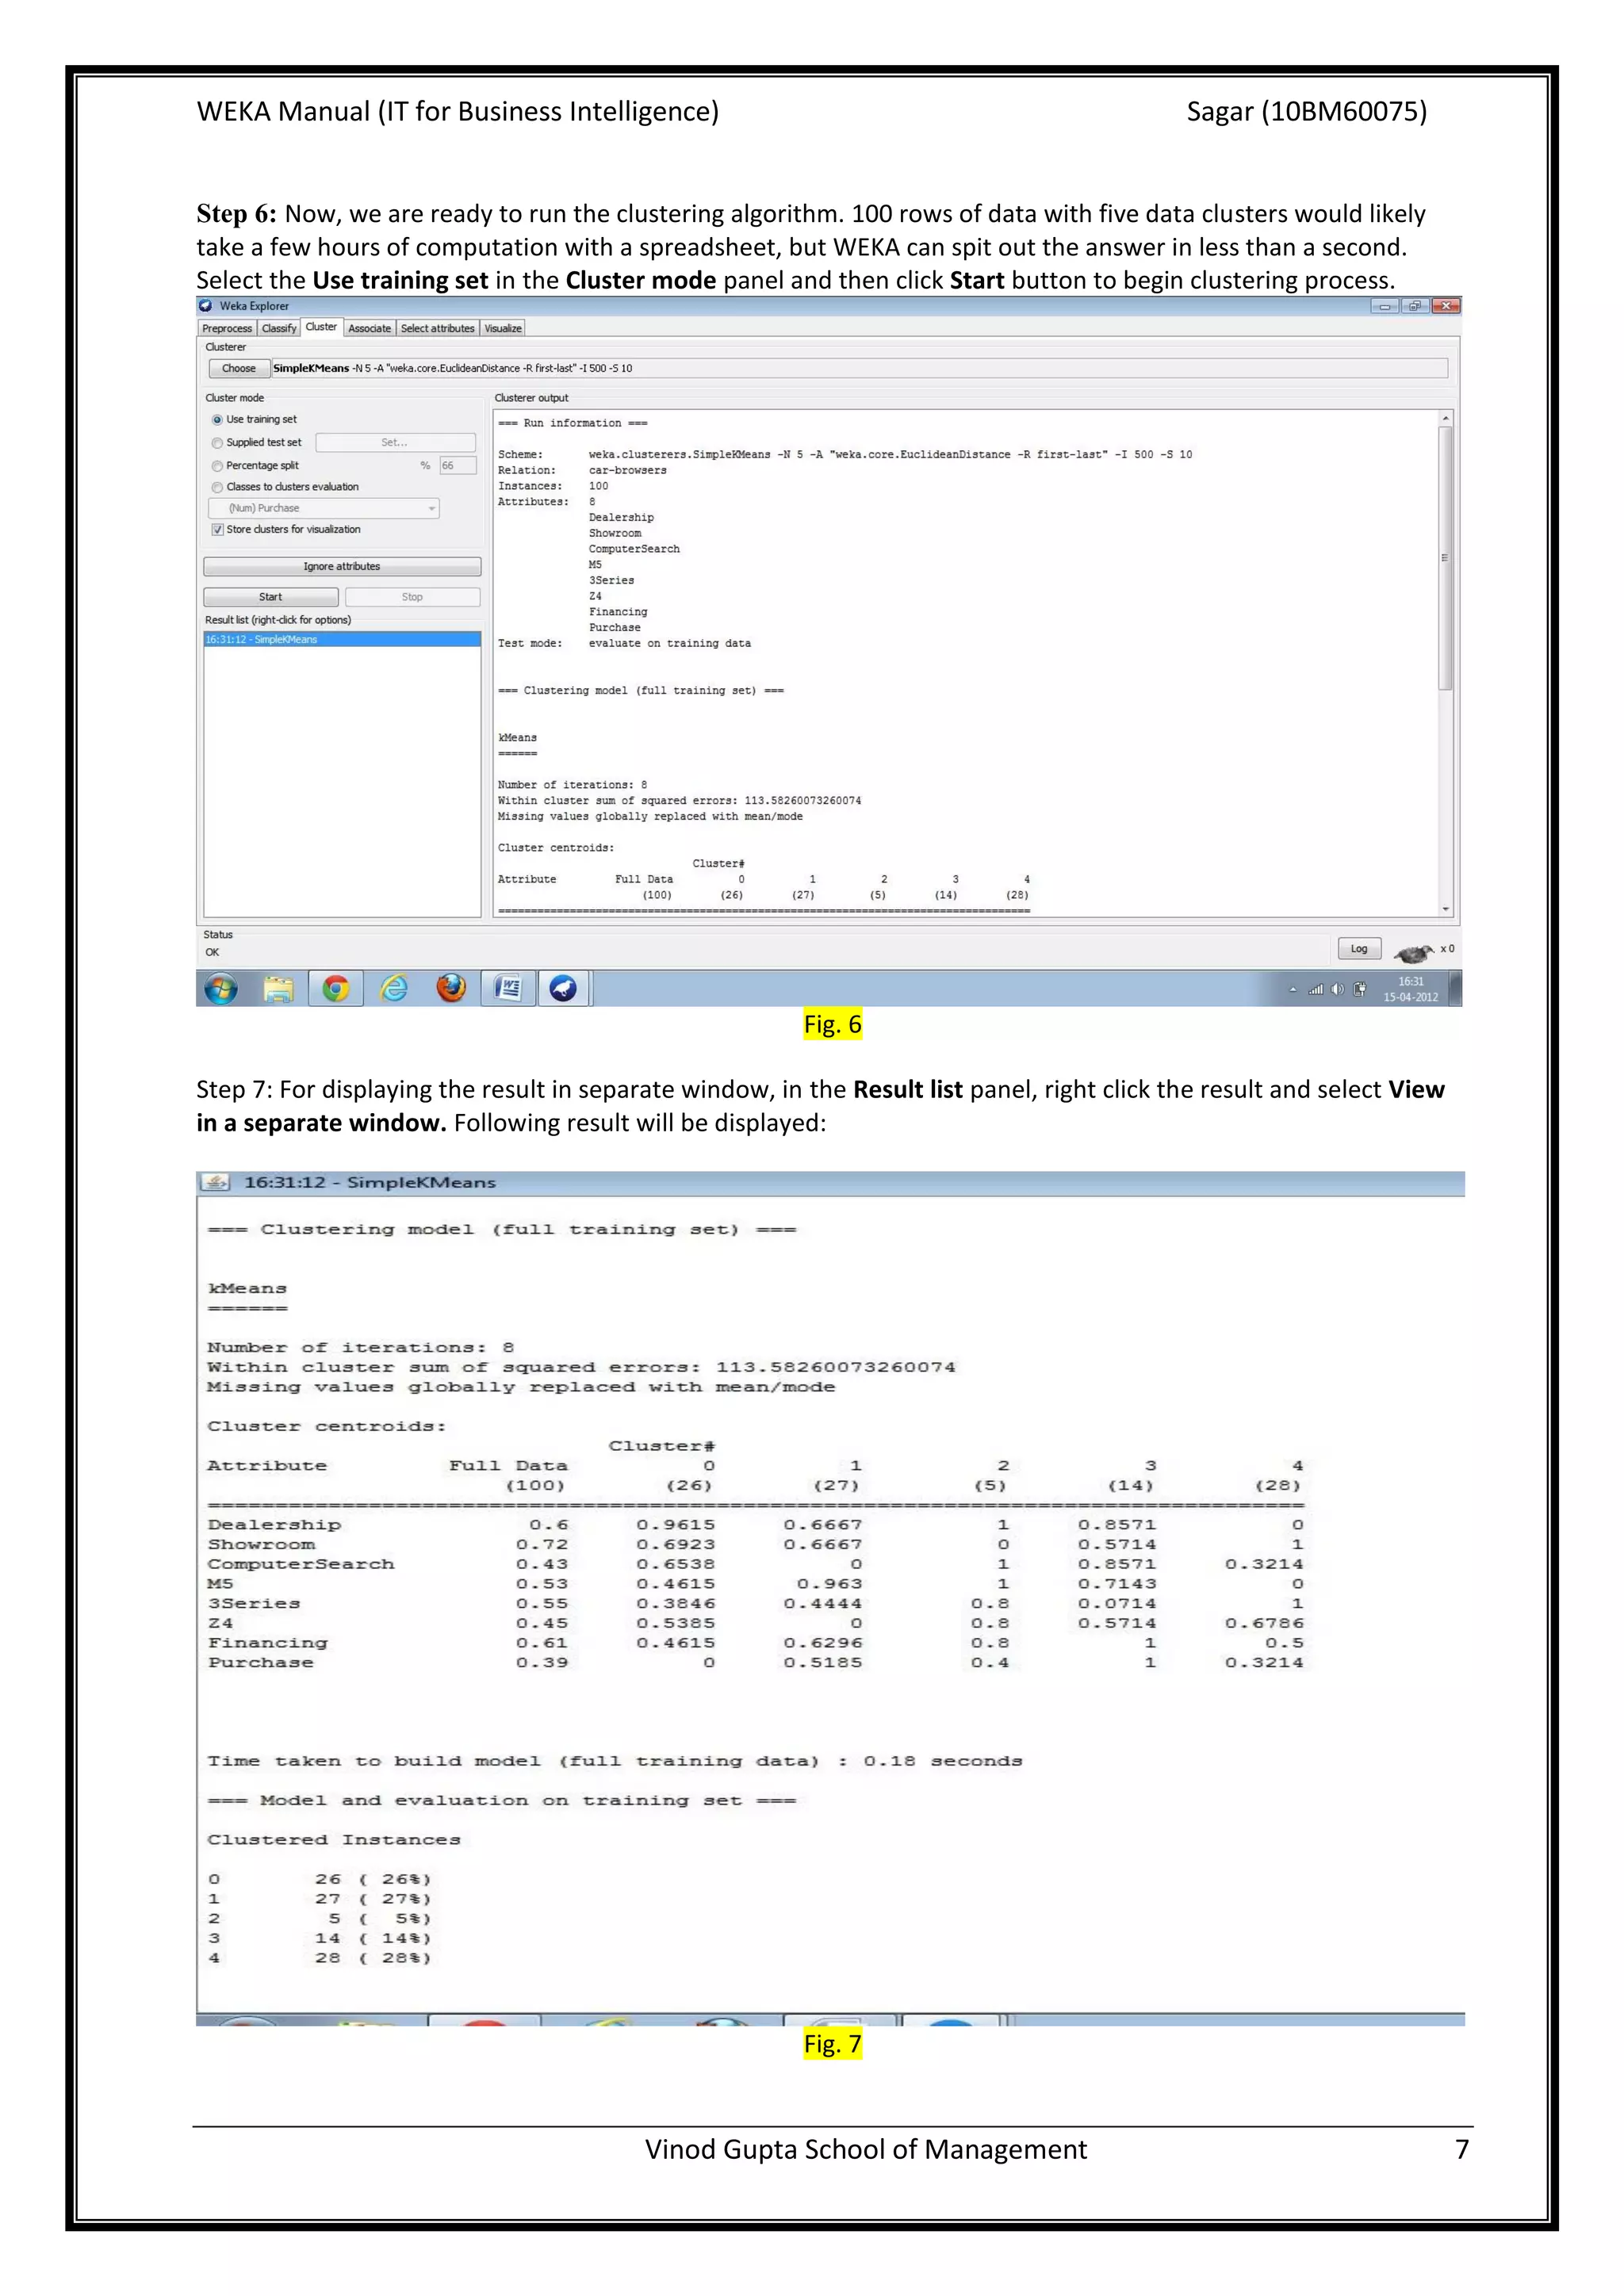
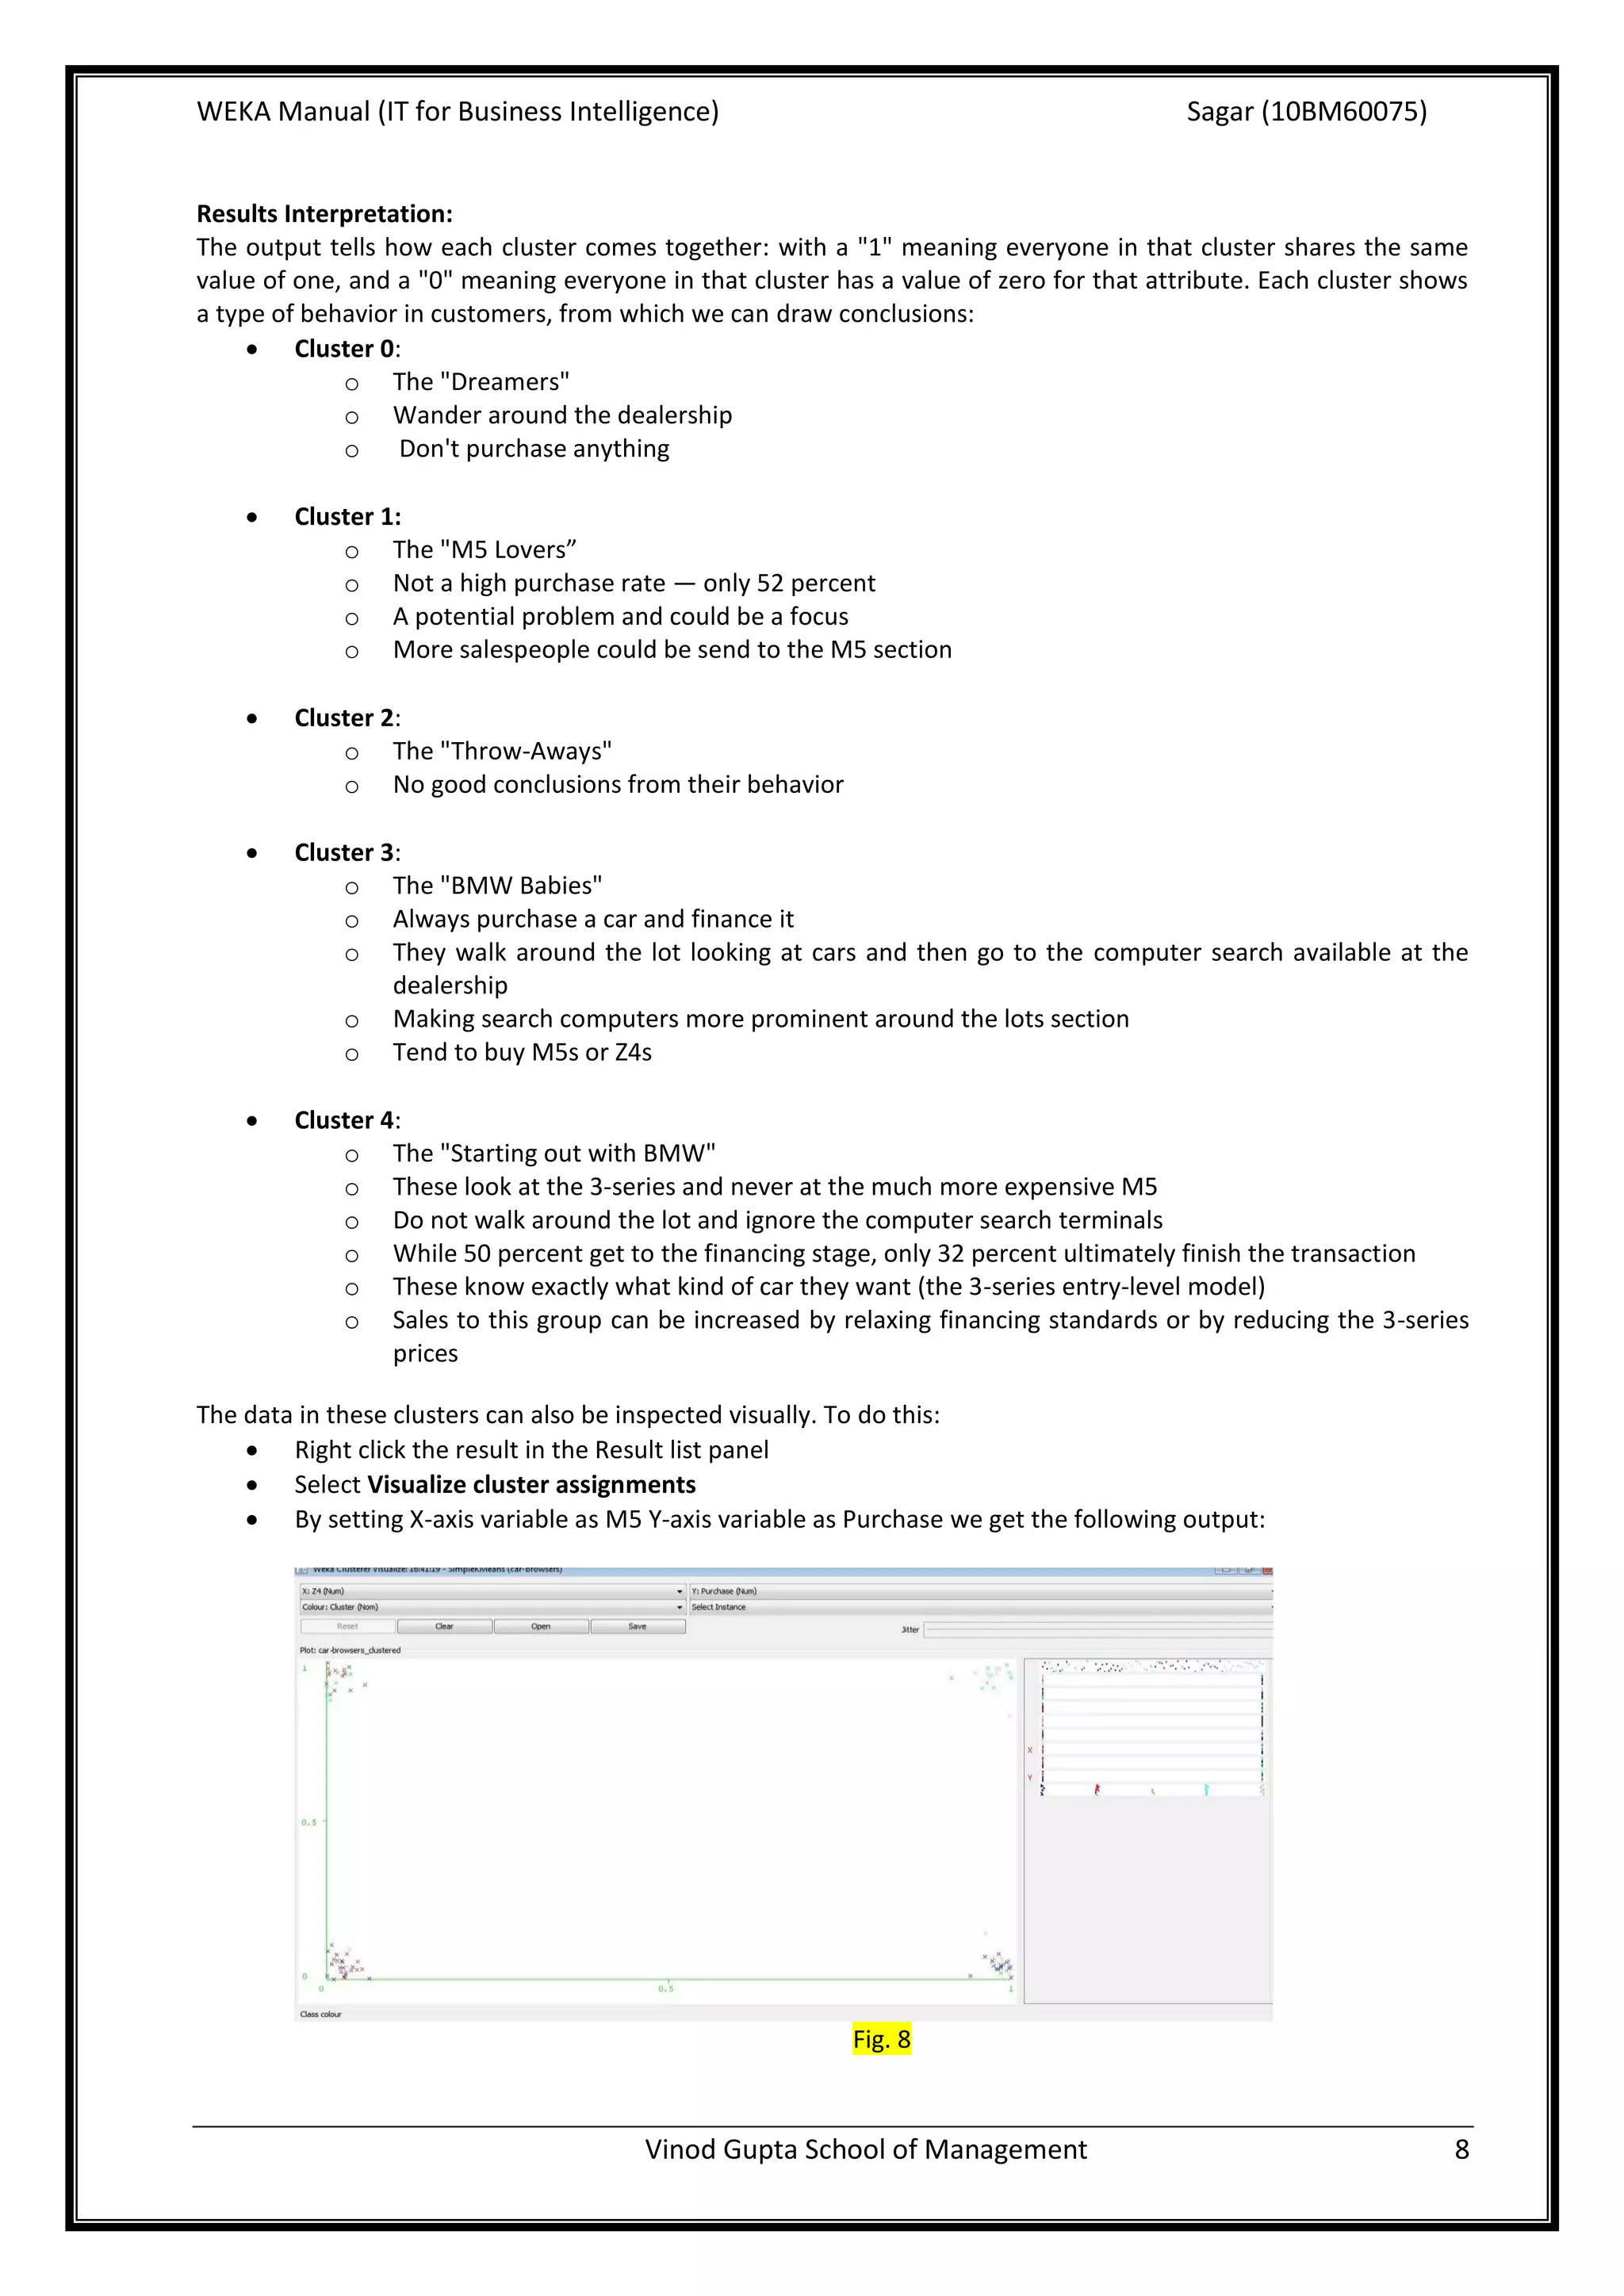

This document provides an overview of using the WEKA data mining tool to perform two common techniques: clustering and linear regression. It first introduces WEKA and its interfaces. It then provides details on k-means clustering, including how to implement it in WEKA on a sample BMW customer dataset. This identifies five distinct customer clusters. The document also explains linear regression and uses a house pricing dataset in WEKA to build a regression model to predict house value based on features.


![Microsoft PowerPoint - weka [Read-Only]](https://cdn.slidesharecdn.com/ss_thumbnails/microsoft-powerpoint-weka-readonly3765-thumbnail.jpg?width=640&height=640&fit=bounds)


