Credit card fraud detection using python machine learning
•
6 likes•1,937 views

This document provides an overview of machine learning tools, technologies, and the data preparation process. It discusses collecting and selecting relevant data, data visualization, labeling data for supervised learning, and transforming raw data into a tidy format. The document also covers various data preprocessing techniques, including data cleaning, formatting, handling missing values and outliers, smoothing, aggregation, generalization, and data reduction methods. The goal of these preprocessing steps is to prepare raw data into a structured format suitable for machine learning modeling.

Recommended
Recommended
More Related Content
What's hot
What's hot (20)
Similar to Credit card fraud detection using python machine learning
Similar to Credit card fraud detection using python machine learning (20)
Recently uploaded
Recently uploaded (20)
Credit card fraud detection using python machine learning
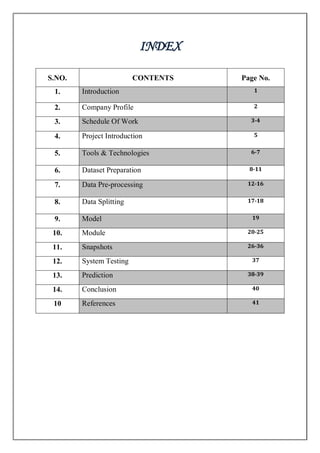
- 1. INDEX S.NO. CONTENTS Page No. 1. Introduction 1 2. Company Profile 2 3. Schedule Of Work 3-4 4. Project Introduction 5 5. Tools & Technologies 6-7 6. Dataset Preparation 8-11 7. Data Pre-processing 12-16 8. Data Splitting 17-18 9. Model 19 10. Module 20-25 11. Snapshots 26-36 12. System Testing 37 13. Prediction 38-39 14. Conclusion 40 10 References 41
- 2. INTRODUCTION Python 1. Web development – Web framework like Django and Flask are based on Python. They help you write server side code which helps you manage database, write backend programming logic, mapping urls etc. 2. Machine learning – There are many machine learning applications written in Python. Machine learning is a way to write logic so that a machine can learn and solve a particular problem on its own. For example, products recommendation in websites like Amazon, Flipchart, eBay etc. is a machine learning algorithm that recognizes user’s interest. Face recognition and Voice recognition in your phone is another example of machine learning. 3. Data Analysis – Data analysis and data visualization in form of charts can also be developed using Python. 4. Scripting – Scripting is writing small programs to automate simple tasks such as sending automated response emails etc. Such type of applications can also be written in Python programming language. 5. Game development – I can develop games using Python. 6. I can develop embedded applications in Python. 7. Desktop applications – I can develop desktop application in Python using library like TKinter or QT. 8. Artificial Intelligence – I can analyze the data using Artificial intelligence module scikit-learn.
- 3. COMPANY PROFILE ABOUT SMARTRIED SOFTWARE TECHNOLOGIES PVT LTD: - Company_name has been a trusted partner for enabling data-driven business transformation in enterprises by leveraging advanced analytics, domain expertise, and artificial intelligence-powered technology accelerators. It enables businesses to contextualize data, generate actionable insights from complex business problems, and make data-driven decisions across pan-enterprise processes to create sustainable business impact. Company_name aims to transform enterprise to digital enterprise, reimagine their business goals in multiple dimensions with analytical decision supports. Company works 24*7 and involves with enterprise and agencies work culture for seamlessness delivery, Quality of our service is perfectly consistent and coherent.
- 4. SCHEDULE OF WORK CDO METHODOLOGY:- A chief data officer (CDO) is a corporate officer responsible for enterprise wide governance and utilization of information as an asset, via data processing, analysis, data mining, information trading and other means. CDOs report mainly to the chief executive officer (CEO). Depending on the area of expertise this can vary. CDO is a member of the executive management team and manager of enterprise-wide data processing & data mining. The Chief Analytics Officer (CAO) is an emerging role that is critical for organizations that want to treat their information as an asset as well as capitalize on and create value from it. CAOs may have worked for analytics software vendors, thereby providing industry thought-leadership for raising the analytics quotient of prospects and customers. Thus, corporations can learn to take advantage of their expertise by bringing analytics talent onto the executive leadership team. The CAO is a business strategist who knows about the flow of information, understands its context, and is aware of how that information links across the enterprise. He or she uses analytics for capitalizing on the data for making sound decisions and achieving better outcomes for the business. Even though this role may traditionally gravitate towards IT, it is not purely an IT role; rather the role of the Chief Analytics Officer is to connect business and IT. A chief analytics officer (CAO) may suggest applying personalization techniques based on machine learning. The techniques allow for offering deals based on customers’ preferences, online behavior, average income, and purchase history. While a business analyst defines the feasibility of a software solution and sets the requirements for it, a solution architect organizes the development. So, a solution architect’s responsibility is to make sure these requirements become a base for a new solution. We’ve talked more about setting machine learning strategy in our projects.
- 5. S. No. Date Working Module Name 1. 28 - JAN - 2019 Work with core Python 2. 08 - FEB – 2019 data structure in python 3. 15 - FEB – 2019 Openpyxl 4. 2 - MARCH – 2019 tkinter 5. 20 - MANCH – 2019 numpy 6. 28 - MARCH – 2019 pandas 7. 10 - APRAIL – 2019 django, json 8. 20 - APRAIL - 2019 ML
- 6. PROJECT INTRODUCTION Machine learning is a sub-domain of computer science which evolved from the study of pattern recognition in data, and also from the computational learning theory in artificial intelligence. It is the Credit Card Fraud Detection to most interesting careers in data analytics today. As data sources proliferate along with the computing power to process them, going straight to the data is one of the most straightforward ways to quickly gain insights and make predictions. Machine Learning can be thought of as the study of a list of sub-problems, viz: decision making, clustering, classification, forecasting, data analyzing, Supervised learning, or classification is the machine learning task of inferring a function from a labeled data. In Supervised learning, we have a training set, and a test set. The training and test set consists of a set of examples consisting of input and output vectors, and the goal of the supervised learning algorithm is to infer a function that maps the input vector to the output vector with minimal error. In layman’s terms, supervised learning can be termed as the process of concept learning, where a brain is exposed to a set of inputs and result vectors and the brain learns the concept that relates said inputs to outputs. A wide array of supervised machine learning algorithms are available to the machine learning enthusiasm.
- 7. TOOLS & TECHNOLOGIES The practice of data science requires the use of analytics tools, technologies and languages to help data professionals extract insights and value from data. A recent survey by Kaggle revealed that data professionals relied on Python, R and SQL more than other tools in 2017. Looking ahead to 2018, the survey results showed that data professionals are most interested in learning Tensorflow, Python and R.
- 9. DATASET PREPARATION Data collection It’s time for a data analyst to pick up the baton and lead the way to machine learning implementation. The job of a data analyst is to find ways and sources of collecting relevant and comprehensive data, interpreting it, and analyzing results with the help of statistical techniques. The type of data depends on what you want to predict. There is no exact answer to the question ―How much data is needed?‖ because each machine learning problem is unique. In turn, the number of attributes data scientists will use when building a predictive model depends on the attributes’ predictive value. Data visualization A large amount of information represented in graphic form is easier to understand and analyze. Some companies specify that a data analyst must know how to create slides, diagrams, charts, and templates.
- 10. Labeling Supervised machine learning, which we’ll talk about below, entails training a predictive model on historical data with predefined target answers. An algorithm must be shown which target answers or attributes to look for. Mapping these target attributes in a dataset is called labeling. Data labeling takes much time and effort as datasets sufficient for machine learning may require thousands of records to be labeled. For instance, if your image recognition algorithm must classify types of bicycles, these types should be clearly defined and labeled in a dataset. Here are some approaches that streamline this tedious and time-consuming procedure. Data selection After having collected all information, a data analyst chooses a subgroup of data to solve the defined problem. For instance, if you save your customers’ geographical location, you don’t need to add their cell phones and bank card numbers to a dataset. But purchase history would be necessary. The selected data includes attributes that need to be considered when building a predictive model. A data scientist, who is usually responsible for data preprocessing and transformation, as well as model building and evaluation, can be also assigned to do data collection and selection tasks in small data science teams. Data Tidying Tidy data is the data which is obtained as as an outcome of processes applied to clean the data in such a way so that the data can be visualized and used in a model in an easy way. Tidy data norms helps us in data analysis process by defining some guidelines which we need to follow while performing the data cleaning operations. It provides a standard way to organize the data values within a dataset and formalizes the way we define the shape of the dataset. Also, the tidy data makes the data manipulation process easier. As in database normalization forms (1NF, 2NF, 3NF, & BCNF), tidy data principles have some predefined rules. Let’s have a look at the tidy data principles.
- 11. Tidy Data Principles The tidy data principles are: 1. Each column represents a separate variable in the dataset 2. Each row represents an individual observation in the dataset 3. Each type of observational unit forms a table These rules are equivalent to the database third normal form (3NF). Let’s have a look at some real life dataset examples to understand the tidy data principles in more detail. Transformation collected data into a useable data tale format. In the data table we split those columns that have more than one data. Most of the Data Science / Machine Learning projects follow the Pareto principle where we spend almost 80% of the time in data preparation and remaining 20% in choosing and training the appropriate ML model. Mostly, the datasets we get to
- 12. Page | 1 create Machine Learning models are messy datasets and cannot be fitted into the model directly. We need to perform some data cleaning steps in order to get a dataset which then can be fitted into the model. We need to make sure that the data we are inputting into the model is a tidy data. Indeed, it is the first step in a Machine Learning / Data Science project. We may need to repeat the data cleaning process many times as we face new challenges and problems while cleaning the data. Data cleaning is one of the most important and time taking process a Data Scientist performs before performing any EDA (Exploratory Data Analysis) or statistical analysis on the data.
- 13. Page | 2 DATA PRE-PROCESSING The purpose of preprocessing is to convert raw data into a form that fits machine learning. Structured and clean data allows a data scientist to get more precise results from an applied machine learning model. The technique includes data formatting, cleaning, and sampling. Data Pre-processing Methods Raw data is highly susceptible to noise, missing values, and inconsistency. The quality of data affects the data mining results. In order to help improve the quality of the data and, consequently, of the mining results raw data is pre-processed so as to improve the efficiency and ease of the mining process. Data preprocessing is one of the most critical steps in a data mining process which deals with the preparation and transformation of the initial dataset. Data preprocessing methods are divided into following categories: Data Cleaning Data Integration Data Transformation Data Reduction Data formatting. The importance of data formatting grows when data is acquired from various sources by different people. The first task for a data scientist is to standardize record formats. A specialist checks whether variables representing each attribute are recorded in the same way. Titles of products and services, prices, date formats, and addresses are examples of variables. The principle of data consistency also applies to attributes represented by numeric ranges. Data cleaning. This set of procedures allows for removing noise and fixing inconsistencies in data. A data scientist can fill in missing data using imputation techniques, e.g. substituting missing values with mean attributes. A specialist also detects outliers — observations that deviate significantly from the rest of distribution. If an outlier indicates erroneous data, a data scientist deletes or corrects them if possible. This stage also includes removing incomplete and useless data objects.
- 14. Page | 3 Incorrect data may also result from inconsistencies in naming conventions or data codes used. Duplicate tuples also require data cleaning. Data cleaning routines work to ―clean" the data by filling in missing values, smoothing noisy data, identifying or removing outliers, and resolving inconsistencies. Dirty data can cause Confusion for the mining procedure. Although most mining routines have some procedures for dealing with incomplete or noisy data, they are not always robust. Instead, they may concentrate on avoiding over fitting the data to the function being modeled. Therefore, a useful pre-processing step is to run your data through some data cleaning routines. Missing Values: If it is noted that there are many tuples that have no recorded value for several attributes, then the missing values can be filled in for the attribute by various methods described below: 1. Ignore the tuple: This is usually done when the class label is missing (assuming the mining task involves classification or description). This method is not very effective, unless the tuple contains several attributes with missing values. It is especially poor when the percentage of missing values per attribute varies considerably. 2. Fill in the missing value manually: In general, this approach is time-consuming and may not be feasible given a large data set with many missing values. 3. Use a global constant to fill in the missing value: Replace all missing attribute values by the same constant, such as a label like Unknown, or -∞. If missing values are replaced by, say, Unknown, then the mining program may mistakenly think that they form an interesting concept, since they all have a value in common that of Unknown". Hence, although this method is simple, it is not recommended. 4. Use the attribute mean to fill in the missing value 5. Use the attribute mean for all samples belonging to the same class as the given tuple. 6. Use the most probable value to fill in the missing value: This may be determined with inference-based tools using a Bayesian formalism or decision tree induction. Data Transformation In data transformation, the data are transformed or consolidated into forms appropriate for mining. Data transformation can involve the following:
- 15. Page | 4 1. Normalization, where the attribute data are scaled so as to fall within a small specified range, such as -1.0 to 1.0, or 0 to 1.0. 2. Smoothing works to remove the noise from data. Such techniques include binning, clustering, and regression. 3. Aggregation, where summary or aggregation operations are applied to the data. For example, the daily sales data may be aggregated so as to compute monthly and annual total amounts. This step is typically used in constructing a data cube for analysis of the data at multiple granularities. 4. Generalization of the data, where low level or 'primitive' (raw) data are replaced by higher level concepts through the use of concept hierarchies. For example, categorical attributes, like street, can be generalized to higher level concepts, like city or county. Similarly, values for numeric attributes, like age, may be mapped to higher level concepts, like young, middle-aged, and senior. Data Reduction Complex data analysis and mining on huge amounts of data may take a very long time, making such analysis impractical or infeasible. Data reduction techniques have been helpful in analyzing reduced representation of the dataset without compromising the integrity of the original data and yet producing the quality knowledge. The concept of data reduction is commonly understood as either reducing the volume or reducing the dimensions(number of attributes). There are a number of methods that have facilitated in analyzing a reduced volume or dimension of data and yet yield useful knowledge. Certain partition based methods work on partition of data tuples. That is, mining on the reduced data set should be more efficient yet produce the same (or almost the same) analytical results Strategies for data reduction include the following. 1. Data cube aggregation, where aggregation operations are applied to the data in the construction of a data cube. 2. Dimension reduction, where irrelevant, weakly relevant, or redundant attributes or dimensions may be detected and removed.
- 16. Page | 5 3. Data compression, where encoding mechanisms are used to reduce the data set size. The methods used for data compression are wavelet transform and Principal Component Analysis. 4. Numerosity reduction, where the data are replaced or estimated by alternative, smaller data representations such as parametric models (which need store only the model parameters instead of the actual data e.g. regression and log-linear models), or nonparametric methods such as clustering, sampling, and the use of histograms. 5. Discretization and concept hierarchy generation, where raw data values for attributes are replaced by ranges or higher conceptual levels. Concept hierarchies allow the mining of data at multiple levels of abstraction, and are a powerful tool for data mining. • Pre-processing refers to the transformations applied to our data before feeding it to the algorithm. • Data Preprocessing is a technique that is used to convert the raw data into a clean data set. In other words, whenever the data is gathered from different sources it is collected in raw format which is not feasible for the analysis. Outlier An outlier is an object that deviates significantly from the rest of the objects. They can be caused by measurement or execution error. The analysis of outlier data is referred to as outlier analysis or outlier mining. Why outlier analysis? Most data mining methods discard outliers noise or exceptions, however, in some applications such as fraud detection, the rare events can be more interesting than the more regularly occurring one and hence, the outlier analysis becomes important in such case.
- 17. Page | 6 Detecting Outier Clustering based outlier detection using distance to the closest cluster: In K-Means clustering technique, each cluster has a mean value. Objects belong to the cluster whose mean value is closest to it. In order to identify the Outlier, firstly we need to initialize the threshold value such that any distance of any data point greater than it from its nearest cluster identifies it as an outlier for our purpose. Then we need to find the distance of the test data to each cluster mean. Now, if the distance between the test data and the closest cluster to it is greater than the threshold value then we will classify the test data as an outlier.
- 18. Page | 7 DATASET SPLITTING Test and Train Data Training data, also called AI training data, training set, training dataset, or learning set is the information used to train an algorithm. The training data includes both input data and the corresponding expected output. Based on this ―ground truth‖ data, the algorithm can learn how to apply technologies such as neural networks, to learn and produce complex results, so that it can make accurate decisions when later presented with new data. Training data can be used for various machine learning algorithms, such as sentiment analysis, natural language processing (NLP), and chatbot training. Testing data, on the other hand, includes only input data, not the corresponding expected output. The testing data is used to assess how well your algorithm was trained, and to estimate model properties. When you have a large data set, it's recommended to split it into 3 parts: 1. Training set (60% of the original data set): This is used to build up our prediction algorithm and to adjust the weights on the neural network. Our algorithm tries to tune itself to the quirks of the training data sets. In this phase we usually create multiple algorithms in order to compare their performances during the Cross-Validation Phase. Each type of algorithm has its own parameter options (the number of layers in a Neural Network, the number of trees in a Random Forest, etc). For each of your algorithms, you must pick one option. That’s why you have a training set. 2. Cross-Validation set (20% of the original data set): This data set is used to compare the performances of the prediction algorithms that were created based on the training set. You now have a collection of algorithms. You must pick one algorithm that has the best performance. That’s why you have a test set. A validation data set is a sample of data held back from training your model that is used to give an estimate of model skill while tuning model’s hyper parameters. This data set is used to minimize over fitting. You're not adjusting the weights of the network with this data set, you're just verifying that any increase in accuracy over the training data set actually yields an increase in accuracy over a data set that has not been shown to the network before, or at least the network hasn't trained on it (i.e. validation data set). If the accuracy over the training data set increases, but the accuracy over then
- 19. Page | 8 validation data set stays the same or decreases, then you're over fitting your neural network and you should stop training. Test set (20% of the original data set): Now we have chosen our preferred prediction algorithm but we don't know yet how it's going to perform on completely unseen real-world data. So, we apply our chosen prediction algorithm on our test set in order to see how it's going to perform so we can have an idea about our algorithm's performance on unseen data. I suppose that if your algorithms did not have any parameters then you would not need a third step. In that case, your validation step ould be your test step. This data set is used only for testing the final solution in order to confirm the actual predictive power of the network. Validation set. The purpose of a validation set is to tweak a model’s hyperparameters — higher-level structural settings that can’t be directly learned from data. These settings can express, for instance, how complex a model is and how fast it finds patterns in data. The proportion of a training and a test set is usually 80 to 20 percent respectively. A training set is then split again, and its 20 percent will be used to form a validation set. At the same time, machine learning practitioner Jason Brownlee suggests using 66 percent of data for training and 33 percent for testing. A size of each subset depends on the total dataset size.
- 20. Page | 9 MODEL During this stage, a data scientist trains numerous models to define which one of them provides the most accurate predictions. Model training After a data scientist has preprocessed the collected data and split it into three subsets, he or she can proceed with a model training. This process entails ―feeding‖ the algorithm with training data. An algorithm will process data and output a model that is able to find a target value (attribute) in new data — an answer you want to get with predictive analysis. The purpose of model training is to develop a model. Two model training styles are most common — supervised and unsupervised learning. The choice of each style depends on whether you must forecast specific attributes or group data objects by similarities. Supervised learning. Supervised learning allows for processing data with target attributes or labeled data. These attributes are mapped in historical data before the training begins. With supervised learning, a data scientist can solve classification and regression problems. Unsupervised learning. During this training style, an algorithm analyzes unlabeled data. The goal of model training is to find hidden interconnections between data objects and structure objects by similarities or differences. Unsupervised learning aims at solving such problems as clustering, association rule learning, and dimensionality reduction. For instance, it can be applied at the data preprocessing stage to reduce data complexity.
- 21. Page | 10 MODULE An Application Module is a logical container for coordinated objects related to a particular task, with optional programming logic. Application Modules provide a simple runtime data connection model (one connection per Application Module) and a context for defining and executing transactions I am used some module in this project: 1. Pandas 2. Numpy 3. Matplotlib 4. Seaborn 5. Scipy 6. Sklearn 1. Pandas Pandas is a popular Python package for data science, and with good reason: it offers powerful, expressive and flexible data structures that make data manipulation and analysis easy, among many other things. The DataFrame is one of these structures. This tutorial covers Pandas DataFrames, from basic manipulations to advanced operations, by tackling 11 of the most popular questions so that you understand - and avoid- the doubts of the Pythonistas who have gone before you. The data frame as a way to store data in rectangular grids that can easily be overviewed. Each row of these grids corresponds to measurements or values of an instance, while each column is a vector containing data for a specific variable. This means that a data frame’s rows do not need to contain, but can contain, the same type of values: they can be numeric, character, logical, etc. Now, DataFrames in Python are very similar: they come with the Pandas library, and they are defined as two-dimensional labeled data structures with columns of potentially different types.
- 22. Page | 11 In general, you could say that the Pandas DataFrame consists of three main components: the data, the index, and the columns. Firstly, the DataFrame can contain data that is: Pandas DataFrame A Pandas Series: a one-dimensional labeled array capable of holding any data type with axis labels or index. An example of a Series object is one column from a DataFrame. 2. NumPy NumPy is the fundamental package for scientific computing with Python. It contains among other things: a powerful N-dimensional array object sophisticated (broadcasting) functions tools for integrating C/C++ and Fortran code useful linear algebra, Fourier transform, and random number capabilities Besides its obvious scientific uses, NumPy can also be used as an efficient multi- dimensional container of generic data. Arbitrary data-types can be defined. This allows NumPy to seamlessly and speedily integrate with a wide variety of databases. NumPy is licensed under the BSD license, enabling reuse with few restrictions. a NumPy ndarray, which can be a record or structured a two-dimensional ndarray dictionaries of one-dimensional ndarray’s, lists, dictionaries or Series. Note: the difference between np.ndarray and np.array() . The former is an actual data type, while the latter is a function to make arrays from other data structures. 3. Matplotlib Matplotlib is a Python 2D plotting library which produces publication quality figures in a variety of hardcopy formats and interactive environments across platforms. Matplotlib can be used in Python scripts, the Python and IPython shells, the Jupyter notebook, web application servers, and four graphical user interface toolkits.
- 23. Page | 12
- 24. Page | 13 Matplotlib tries to make easy things easy and hard things possible. You can generate plots, histograms, power spectra, bar charts, errorcharts, scatterplots, etc., with just a few lines of code. For examples, see the sample plots and thumbnail gallery. For simple plotting the pyplot module provides a MATLAB-like interface, particularly when combined with IPython. For the power user, you have full control of line styles, font properties, axes properties, etc, via an object oriented interface or via a set of functions familiar to MATLAB users. 4. Seaborn Seaborn is a library for making statistical graphics in Python. It is built on top of matplotlib and closely integrated with pandas data structures. Here is some of the functionality that seaborn offers: A dataset-oriented API for examining relationships between multiple variables Specialized support for using categorical variables to show observations or aggregate statistics Options for visualizing univariate or bivariate distributions and for comparing them between subsets of data. Automatic estimation and plotting of linear regression models for different kinds dependent variables. Convenient views onto the overall structure of complex datasets High-level abstractions for structuring multi-plot grids that let you easily build complex visualizations
- 25. Page | 14 Concise control over matplotlib figure styling with several built-in themes Seaborn aims to make visualization a central part of exploring and understanding data. Its dataset-oriented plotting functions operate on dataframes and arrays containing whole datasets and internally perform the necessary semantic mapping and statistical aggregation to produce informative plots. 5. SciPy The SciPy library is one of the core packages that make up the SciPy stack. It provides many user-friendly and efficient numerical routines such as routines for numerical integration, interpolation, optimization, linear algebra and statistics. In our previous Python Library tutorial, we saw Python Matplotlib. Today, we bring you a tutorial on Python SciPy. Here in this SciPy Tutorial, we will learn the benefits of Linear Algebra, Working of Polynomials, and how to install SciPy. Moreover, we will cover the Processing Signals with SciPy, and Processing Images with SciPy.
- 26. Page | 15 Python SciPy is open-source and BSD-licensed. You can pronounce it as Sigh Pie. Here are some shorts on it: Author: Travis Oliphant, Pearu Peterson, Eric Jones. First Release: 2001 Stable Release: Version 1.1.0; May, 2018. Written in: Fortran, C, C++, Python Programming Language. Python SciPy has modules for the following tasks: Optimization Linear algebra Integration Interpolation 6.Scikit-learn Scikit-learn(formerly scikits.learn) is a free software machine learning library for the Python programming language. It features various classification, regression and clustering algorithms including support vector machines, random forests, gradient boosting, k-means and DBSCAN, and is designed to interoperate with the Python numerical and scientific libraries NumPy and SciPy.
- 27. Page | 16 SNAPSHOTS 1. All column name of data:
- 28. Page | 17 2. First 10 raws: 3. Dtype of column :
- 29. Page | 18 4. Statistics of Data:
- 30. Page | 19 5. Histogram of column v4:
- 31. Page | 20 6. Find outlier of column Time: 7. Find outlier of column V1:
- 32. Page | 21 8. Find outlier of column V2: 9. Find outlier of column V3:
- 33. Page | 22 10. Find outlier of column V4:
- 34. Page | 23 11. Count the values of time column: 12. Count value of column v5 Bar graph:
- 35. Page | 24 13. Count value of column Time Bar graph: 14. Replace Null by 0 in column v4:
- 36. Page | 25 15. Bivariate outlier detection of column v4 and Time:
- 37. Page | 26 16. Correlation of matrix of all column: 17. Find value in less then 0 in column v5:
- 38. Page | 27
- 39. Page | 28 SYSTEM TESTING Model evaluation and testing The goal of this step is to develop the simplest model able to formulate a target value fast and well enough. A data scientist can achieve this goal through model tuning. That’s the optimization of model parameters to achieve an algorithm’s best performance. One of the more efficient methods for model evaluation and tuning is cross- validation. Cross-validation. Cross-validation is the most commonly used tuning method. It entails splitting a training dataset into ten equal parts (folds). A given model is trained on only nine folds and then tested on the tenth one (the one previously left out). Training continues until every fold is left aside and used for testing. As a result of model performance measure, a specialist calculates a cross-validated score for each set of hyperparameters. A data scientist trains models with different sets of hyperparameters to define which model has the highest prediction accuracy. The cross-validated score indicates average model performance across ten hold-out folds. Then a data science specialist tests models with a set of hyperparameter values that received the best cross-validated score. There are various error metrics for machine learning tasks.
- 40. Page | 29 PREDICTION Data scientists mostly create and train one or several dozen models to be able to choose the optimal model among well-performing ones. Models usually show different levels of accuracy as they make different errors on new data points. There are ways to improve analytic results. Model ensemble techniques allow for achieving a more precise forecast by using multiple top performing models and combining their results. The accuracy is usually calculated with mean and median outputs of all models in the ensemble. Mean is a total of votes divided by their number. Median represents a middle score for votes rearranged in order of size. The common ensemble methods are stacking, bagging, and boosting. Stacking. Also known as stacked generalization, this approach suggests developing a meta-model or higher-level learner by combining multiple base models. Stacking is usually used to combine models of different types, unlike bagging and boosting. The goal of this technique is to reduce generalization error. Bagging (bootstrap aggregating). This is a sequential model ensembling method. First, a training dataset is split into subsets. Then models are trained on each of these subsets. After this, predictions are combined using mean or majority voting. Bagging helps reduce the variance error and avoid model overfitting. Boosting. According to this technique, the work is divided into two steps. A data scientist first uses subsets of an original dataset to develop several averagely performing models and then combines them to increase their performance using majority vote. Each model is trained on a subset received from the performance of the previous model and concentrates on misclassified records. A model that most precisely predicts outcome values in test data can be deployed. Real-time prediction (real-time streaming or hot path analytics) This type of deployment speaks for itself. With real-time streaming analytics, you can instantly analyze live streaming data and quickly react to events that take place at any moment. Real-time prediction allows for processing of sensor or market data, data from IoT or mobile devices, as well as from mobile or desktop applications and websites. As this deployment method requires processing large streams of input data, it would be reasonable to use Apache Spark or rely on MlaaS platforms. Apache Spark is an open-source cluster-computing framework. A cluster is a set of
- 41. Page | 30 computers combined into a system through software and networking. Due to a cluster’s high performance, it can be used for big data processing, quick writing of applications in Java, Scala, or Python. Web service and real-time prediction differ in amount of data for analysis a system receives at a time. Stream learning Stream learning implies using dynamic machine learning models capable of improving and updating themselves. You can deploy a model capable of self learning if data you need to analyse changes frequently. Apache Spark or MlaaS will provide you with high computational power and make it possible to deploy a self-learning model.
- 42. Page | 31 CONCLUSION Regardless of a machine learning project’s scope, its implementation is a time- consuming process consisting of the same basic steps with a defined set of tasks. The distribution of roles in data science teams is optional and may depend on a project scale, budget, time frame, and a specific problem. For instance, specialists working in small teams usually combine responsibilities of several team members. Even though a project’s key goal — development and deployment of a predictive model — is achieved, a project continues. Data scientists have to monitor if an accuracy of forecasting results corresponds to performance requirements and improve a model if needed. Make sure you track a performance of deployed model unless you put a dynamic one in production. One of the ways to check if a model is still at its full power is to do the A/B test. Performance metrics used for model evaluation can also become a valuable source of feedback. The faster data becomes outdated within your industry, the more often you should test your model’s performance.