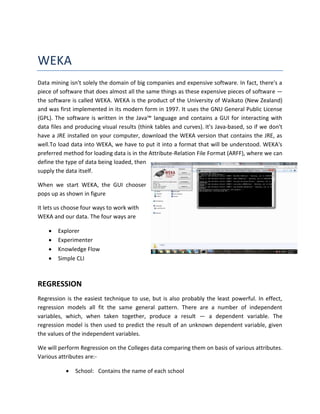
Data mining technique using WEKA


      IT for Business Intelligence


                        Submitted By:-

                        Siddharth Verma   10BM60086
WEKA
Data mining isn't solely the domain of big companies and expensive software. In fact, there's a
piece of software that does almost all the same things as these expensive pieces of software —
the software is called WEKA. WEKA is the product of the University of Waikato (New Zealand)
and was first implemented in its modern form in 1997. It uses the GNU General Public License
(GPL). The software is written in the Java™ language and contains a GUI for interacting with
data files and producing visual results (think tables and curves). It's Java-based, so if we don't
have a JRE installed on your computer, download the WEKA version that contains the JRE, as
well.To load data into WEKA, we have to put it into a format that will be understood. WEKA's
preferred method for loading data is in the Attribute-Relation File Format (ARFF), where we can
define the type of data being loaded, then
supply the data itself.

When we start WEKA, the GUI chooser
pops up as shown in figure

It lets us choose four ways to work with
WEKA and our data. The four ways are

       Explorer
       Experimenter
       Knowledge Flow
       Simple CLI


REGRESSION
Regression is the easiest technique to use, but is also probably the least powerful. In effect,
regression models all fit the same general pattern. There are a number of independent
variables, which, when taken together, produce a result — a dependent variable. The
regression model is then used to predict the result of an unknown dependent variable, given
the values of the independent variables.

We will perform Regression on the Colleges data comparing them on basis of various attributes.
Various attributes are:-

              School: Contains the name of each school
   School_Type: Coded 'LibArts' for liberal arts and 'Univ' for university
              SAT: Median combined Math and Verbal SAT score of students
              Acceptance: % of applicants accepted
              $/Student: Money spent per student in dollars
              Top 10%: % of students in the top 10% of their h.s. graduating class
              %PhD: % of faculty at the institution that have PhD degrees
              Grad%: % of students at institution who eventually graduate

To create our regression model, start WEKA, then choose the Explorer. In the Explorer screen,
select the Preprocess tab. Select the Open File button and select the ARFF file. After selecting the
file the explorer window looks as below


In the left section of the Explorer window, it outlines all of the columns in the data (Attributes)
and the number of rows of data supplied (Instances). By selecting each column, the right
section of the Explorer window will also give the information about the data in that column of
the data set. For example, by selecting the SAT column in the left section the right-section
should change to show the additional statistical information about the column. Finally, there's
a visual way of examining the data, which can be viewed by clicking the Visualize All button.
To create the model, click on the Classify tab. The first step is to select the model we want to
build, so WEKA knows how to work with the data, and how to create the appropriate model:
    1. Click the Choose button, then expand the functions branch.
    2. Select the LinearRegression leaf.


This tells WEKA that we want to build a regression model.
Though it may be obvious to us that we want to use the data we supplied in the ARFF file, there
are actually different options than what we'll be using. The other three choices are Supplied
test set, where we can supply a different set of data to build the model;Cross-validation, which
lets WEKA build a model based on subsets of the supplied data and then average them out to
create a final model; and Percentage split, where WEKA takes a percentile subset of the
supplied data to build a final model. With regression, we can simply choose Use training set.


Finally, Choosing no attribute method to determine each attributes contribution to regression.
The last step to creating our model is to choose the dependent variable one by one all
numerical attributes.
Right below the test options, there's a combo box that lets you choose the dependent variable.
Choosing SAT as dependent variable .To create our model, click Start. Figure below shows the
output window


INTERPRETATION OF THE RESULT:

SAT = ……..+ (30.6632* School) + (-1.245* School type) + (0.0609* Acceptance) +

              (0.0341* Top) +(0.064* 10%) +(0.1479* PHD%) – 1089.2569

Interpreting the pattern and conclusion that our model generated we see that besides just a
strict house value:
     SAT affects choice of School — WEKA tells us that Sat score affects choice of school the
        most
     School Type do not matter — Since we use a simple 0 or 1 value for an upgraded
        bathroom, we can use the coefficient from the regression model to determine the value
        of an upgraded bathroom on the house value.
     SAT score has no correlation with money spent per student. — WEKA will only use
        columns that statistically contribute to the accuracy of the model. It will throw out and
        ignore columns that don't help in creating a good model. So this regression model is
        telling us that no effect of SAT score on relation with $ spent on students.
CLUSTERING
Clustering is the task of assigning a set of objects into groups (called clusters) so that the
objects in the same cluster are more similar (in some sense or another) to each other than to
those in other clusters. WEKA offers clustering capabilities not only as standalone schemes, but
also as filters and classifiers.

To begin with clustering we will use the data set of places. The data set contains places
classified on bases of – The nine rating criteria used by Places Rated Almanac are:

Climate & Terrain, Housing, Health Care & Environment, Crime, Transportation, Education, The
Arts, Recreation and Economics

To create clustering, start WEKA, then choose the Explorer. In the Explorer screen, select
the Preprocess tab. Select the Open File button and select the ARFF file. After selecting the file
the explorer window looks as below


To perform clustering, select the "Cluster" tab in the Explorer and click on the "Choose" button.
This results in a drop down list of available clustering algorithms. In this case select
"SimpleKMeans". Next, click on the text box to the right of the "Choose" button to get the pop-
up window shown in Figure below, for editing the clustering parameter.
In the pop-up window we enter 5 as the number of clusters (instead of the default values of 2)
and we leave the value of "seed" as is. The seed value is used in generating a random number
which is, in turn, used for making the initial assignment of instances to clusters.


Once the options have been specified, we can run the clustering algorithm. Here we make sure
that in the "Cluster Mode" panel, the "Use training set" option is selected, and we click "Start".
We can right click the result set in the "Result list" panel and view the results of clustering in a
separate window.

We can choose the cluster number and any of the other attributes for each of the three
different dimensions available (x-axis, y-axis, and color).
Different combinations of choices will result in a visual rendering of different relationships
within each cluster.

INTERPRETING THE RESULT:

Each cluster shows us a type of behavior in our customers, from which we can begin to draw
some conclusions:

Cluster 0: Transportation facility is best in this place and it excels in educations as well. This place is rich
in arts and recreations as well.

Cluster 1: This place has least crime. Relatively low utility bills, property taxes, mortgage payments
makes it favorable place to live in.

Cluster 2: This place has highest violent crime rate and property crime rate. People in this place have to
pay highest utility bills, property taxes, mortgage payments but it has best climate and terrain and best
health care and environment too. Transport facilities are also good. This place is rich in arts and
recreations various venues are available which are best in categories.

Cluster 3: This place has least utility bills, property taxes, mortgage payments and therefore favorable.
Transport facilities are in bad shape. Little or no avenues of arts and recreation available. Lowest
average household income among all.

Cluster 4: This place has high crime rate. Health care and Environment is worse among all places and so
are education facilities. Highest average household income among all.

Weka term paper(siddharth 10 bm60086)

  • 1.
    Data mining techniqueusing WEKA IT for Business Intelligence Submitted By:- Siddharth Verma 10BM60086
  • 2.
    WEKA Data mining isn'tsolely the domain of big companies and expensive software. In fact, there's a piece of software that does almost all the same things as these expensive pieces of software — the software is called WEKA. WEKA is the product of the University of Waikato (New Zealand) and was first implemented in its modern form in 1997. It uses the GNU General Public License (GPL). The software is written in the Java™ language and contains a GUI for interacting with data files and producing visual results (think tables and curves). It's Java-based, so if we don't have a JRE installed on your computer, download the WEKA version that contains the JRE, as well.To load data into WEKA, we have to put it into a format that will be understood. WEKA's preferred method for loading data is in the Attribute-Relation File Format (ARFF), where we can define the type of data being loaded, then supply the data itself. When we start WEKA, the GUI chooser pops up as shown in figure It lets us choose four ways to work with WEKA and our data. The four ways are  Explorer  Experimenter  Knowledge Flow  Simple CLI REGRESSION Regression is the easiest technique to use, but is also probably the least powerful. In effect, regression models all fit the same general pattern. There are a number of independent variables, which, when taken together, produce a result — a dependent variable. The regression model is then used to predict the result of an unknown dependent variable, given the values of the independent variables. We will perform Regression on the Colleges data comparing them on basis of various attributes. Various attributes are:-  School: Contains the name of each school
  • 3.
    School_Type: Coded 'LibArts' for liberal arts and 'Univ' for university  SAT: Median combined Math and Verbal SAT score of students  Acceptance: % of applicants accepted  $/Student: Money spent per student in dollars  Top 10%: % of students in the top 10% of their h.s. graduating class  %PhD: % of faculty at the institution that have PhD degrees  Grad%: % of students at institution who eventually graduate To create our regression model, start WEKA, then choose the Explorer. In the Explorer screen, select the Preprocess tab. Select the Open File button and select the ARFF file. After selecting the file the explorer window looks as below In the left section of the Explorer window, it outlines all of the columns in the data (Attributes) and the number of rows of data supplied (Instances). By selecting each column, the right section of the Explorer window will also give the information about the data in that column of the data set. For example, by selecting the SAT column in the left section the right-section should change to show the additional statistical information about the column. Finally, there's a visual way of examining the data, which can be viewed by clicking the Visualize All button.
  • 4.
    To create themodel, click on the Classify tab. The first step is to select the model we want to build, so WEKA knows how to work with the data, and how to create the appropriate model: 1. Click the Choose button, then expand the functions branch. 2. Select the LinearRegression leaf. This tells WEKA that we want to build a regression model.
  • 5.
    Though it maybe obvious to us that we want to use the data we supplied in the ARFF file, there are actually different options than what we'll be using. The other three choices are Supplied test set, where we can supply a different set of data to build the model;Cross-validation, which lets WEKA build a model based on subsets of the supplied data and then average them out to create a final model; and Percentage split, where WEKA takes a percentile subset of the supplied data to build a final model. With regression, we can simply choose Use training set. Finally, Choosing no attribute method to determine each attributes contribution to regression. The last step to creating our model is to choose the dependent variable one by one all numerical attributes.
  • 6.
    Right below thetest options, there's a combo box that lets you choose the dependent variable. Choosing SAT as dependent variable .To create our model, click Start. Figure below shows the output window INTERPRETATION OF THE RESULT: SAT = ……..+ (30.6632* School) + (-1.245* School type) + (0.0609* Acceptance) + (0.0341* Top) +(0.064* 10%) +(0.1479* PHD%) – 1089.2569 Interpreting the pattern and conclusion that our model generated we see that besides just a strict house value:  SAT affects choice of School — WEKA tells us that Sat score affects choice of school the most  School Type do not matter — Since we use a simple 0 or 1 value for an upgraded bathroom, we can use the coefficient from the regression model to determine the value of an upgraded bathroom on the house value.  SAT score has no correlation with money spent per student. — WEKA will only use columns that statistically contribute to the accuracy of the model. It will throw out and ignore columns that don't help in creating a good model. So this regression model is telling us that no effect of SAT score on relation with $ spent on students.
  • 7.
    CLUSTERING Clustering is thetask of assigning a set of objects into groups (called clusters) so that the objects in the same cluster are more similar (in some sense or another) to each other than to those in other clusters. WEKA offers clustering capabilities not only as standalone schemes, but also as filters and classifiers. To begin with clustering we will use the data set of places. The data set contains places classified on bases of – The nine rating criteria used by Places Rated Almanac are: Climate & Terrain, Housing, Health Care & Environment, Crime, Transportation, Education, The Arts, Recreation and Economics To create clustering, start WEKA, then choose the Explorer. In the Explorer screen, select the Preprocess tab. Select the Open File button and select the ARFF file. After selecting the file the explorer window looks as below To perform clustering, select the "Cluster" tab in the Explorer and click on the "Choose" button. This results in a drop down list of available clustering algorithms. In this case select "SimpleKMeans". Next, click on the text box to the right of the "Choose" button to get the pop- up window shown in Figure below, for editing the clustering parameter.
  • 8.
    In the pop-upwindow we enter 5 as the number of clusters (instead of the default values of 2) and we leave the value of "seed" as is. The seed value is used in generating a random number which is, in turn, used for making the initial assignment of instances to clusters. Once the options have been specified, we can run the clustering algorithm. Here we make sure that in the "Cluster Mode" panel, the "Use training set" option is selected, and we click "Start". We can right click the result set in the "Result list" panel and view the results of clustering in a separate window. We can choose the cluster number and any of the other attributes for each of the three different dimensions available (x-axis, y-axis, and color).
  • 9.
    Different combinations ofchoices will result in a visual rendering of different relationships within each cluster. INTERPRETING THE RESULT: Each cluster shows us a type of behavior in our customers, from which we can begin to draw some conclusions: Cluster 0: Transportation facility is best in this place and it excels in educations as well. This place is rich in arts and recreations as well. Cluster 1: This place has least crime. Relatively low utility bills, property taxes, mortgage payments makes it favorable place to live in. Cluster 2: This place has highest violent crime rate and property crime rate. People in this place have to pay highest utility bills, property taxes, mortgage payments but it has best climate and terrain and best health care and environment too. Transport facilities are also good. This place is rich in arts and recreations various venues are available which are best in categories. Cluster 3: This place has least utility bills, property taxes, mortgage payments and therefore favorable. Transport facilities are in bad shape. Little or no avenues of arts and recreation available. Lowest average household income among all. Cluster 4: This place has high crime rate. Health care and Environment is worse among all places and so are education facilities. Highest average household income among all.