Downloaded 11 times


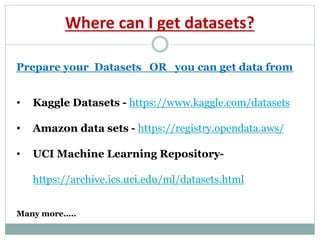


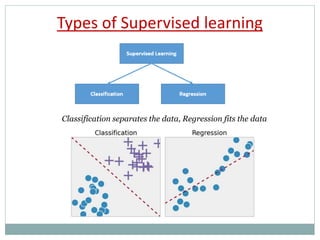
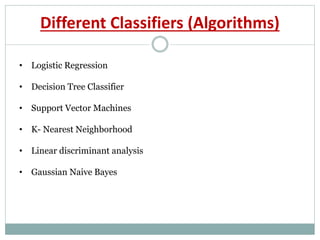
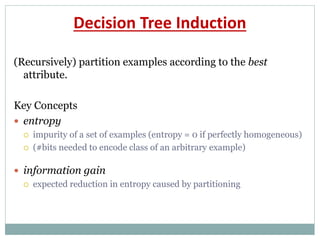
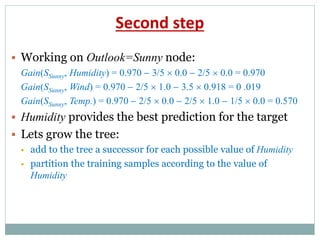
![Entropy in binary classification
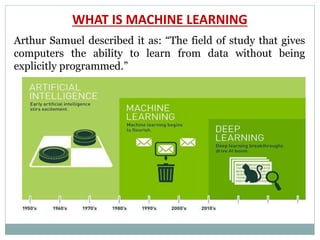
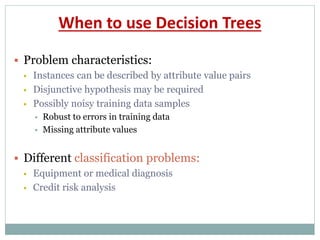
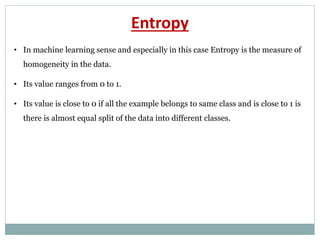
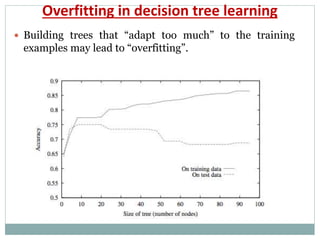
Entropy measures the impurity of a collection of examples.
It depends from the distribution of the random variable p.
S is a collection of training examples
p+ the proportion of positive examples in S
p– the proportion of negative examples in S
Entropy (S) – p+ log2 p+ – p–log2 p–
Entropy ([14+, 0–]) = – 14/14 log2 (14/14) – 0 log2 (0) = 0
Entropy ([9+, 5–]) = – 9/14 log2 (9/14) – 5/14 log2 (5/14) = 0.94
Entropy ([7+, 7– ]) = – 7/14 log2 (7/14) – 7/14 log2 (7/14) = 1/2 + 1/2 = 1
Note: the log of a number < 1 is negative, 0 p 1, 0 entropy 1](https://image.slidesharecdn.com/machinelearninganddecisiontrees-190516055411/85/Machine-learning-and-decision-trees-35-320.jpg)
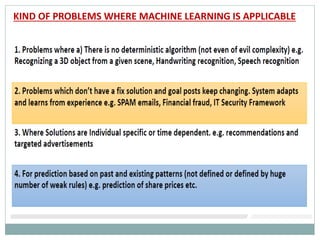
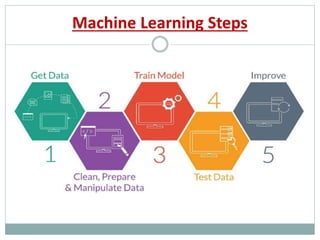
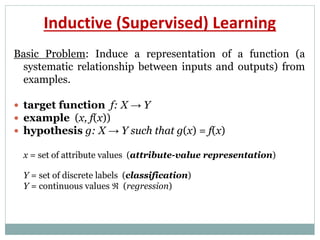
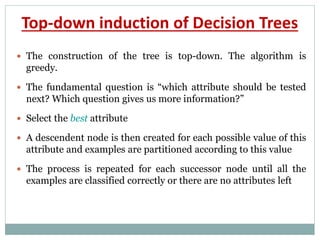
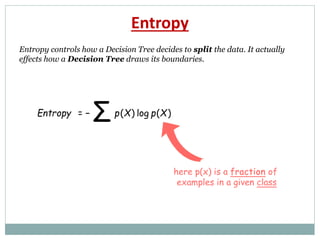
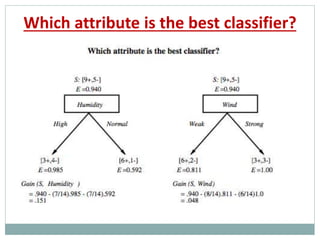
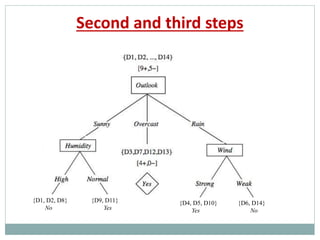
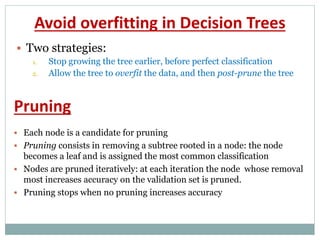
![Example: expected information gain
Let
Values(Wind) = {Weak, Strong}
S = [9+, 5−] |S|=14
SWeak = [6+, 2−] | SWeak |=8
SStrong = [3+, 3−] | SStrong|=6
Entropy(S)=-9/14 log2(9/14) – 5/14 log (5/14)=0.94
Entropy(SWeak)= -6/8 log2(6/8) – 2/8 log (2/8)=0.811
Entropy(SStrong)= -1/2 log2(1/2) – 1/2 log (1/2)=1
Information gain due to knowing Wind:
Gain(S, Wind) = Entropy(S) − 8/14 Entropy(SWeak) − 6/14 Entropy(SStrong)
= 0.94 − 8/14 0.811 − 6/14 1.00
= 0.048](https://image.slidesharecdn.com/machinelearninganddecisiontrees-190516055411/85/Machine-learning-and-decision-trees-38-320.jpg)


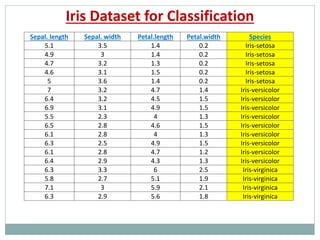
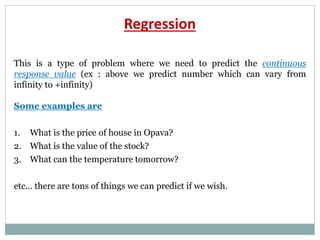
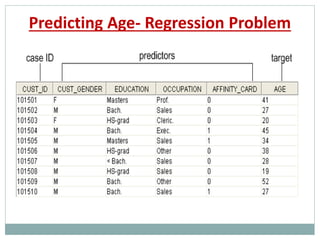
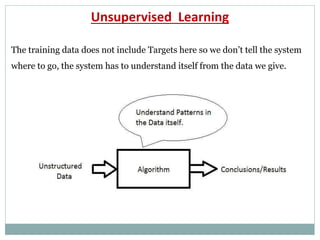
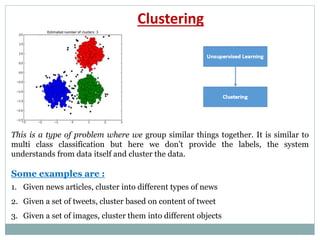
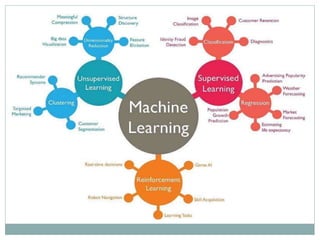
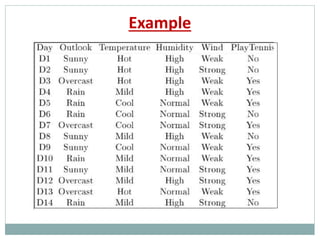
The document provides an overview of machine learning, defining it as the ability for computers to learn from data without explicit programming. It discusses various types of machine learning, including supervised, unsupervised, and reinforcement learning, along with examples and the importance of decision trees in classification tasks. The document also outlines how to prepare datasets, types of algorithms, and details the decision tree mechanism, including concepts of entropy and information gain to optimize classification results.


![7.__Developing_a_Research_Proposal[1].pptx](https://cdn.slidesharecdn.com/ss_thumbnails/7-260131073037-df92dd7d-thumbnail.jpg?width=640&height=640&fit=bounds)


