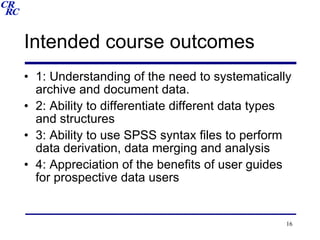
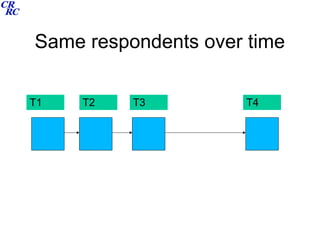
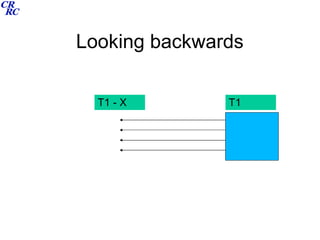
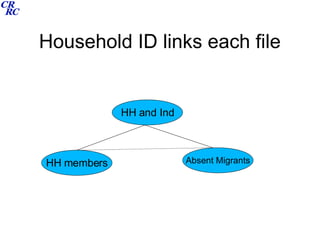
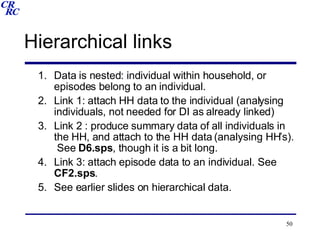
Data Archiving and Processing   Karine Sahakyan, MD, MPH American University of  Armenia June 26-27, 2008 Caucasus Research Resource Centers – Armenia A Program of the Eurasia Foundation
Overview Introduction, general archiving theory and practices Data structures and data processing Survey documentation User guides
Course schedule 26 th  June   Introduction and orientation General archiving theory and practices Data processing, data file structures,  deriving variables Practical exercises  and coursework
Course schedule 27 th  June   Data linkage Survey documentation Thematic user guides
Introduction
Data
Data Project
Data Project Documentation
Data Project Documentation Theory
Data User Documentation Theory Project
Data User Documentation Theory Project Data storage and preservation (official archives)
Data User Documentation Theory Project Data processing and analysis (personal archives)
Data User Documentation Theory Project Supporting documentation
Data User Documentation Theory Project User guides
Sources Elder, GH et al (1993) Working with Archival data: studying Lives, London, Sage. Dale, A et al (1988) Doing Secondary Analysis, London, Unwin Hyman. UK Data archive (www.data-archive.ac.uk) Royal Statistical Society (www.rss.org.uk) ESDS (www.esds.ac.uk) SPSS to process and analyse data www.spsstools.net/SampleSyntax.htm DI2007 and INTAS 2007 survey data sets and docs
Intended course outcomes 1: Understanding of the need to systematically archive and document data. 2: Ability to differentiate different data types and structures 3: Ability to use SPSS syntax files to perform data derivation, data merging and analysis 4: Appreciation of the benefits of user guides for prospective data users
Assessment User guide and codebook development for the DI 2007 on a specific thematic module. Testing ILO’s 1,2 and 4 Analysis of DI2007 or INTAS survey using SPSS syntax files to derive variables / merge files / produce tables/statistics. Testing ILO 3.
Assessment Course work sessions are timetabled so you expected to start both projects during this course Projects should be submitted 2 weeks after the end of the course I will be available by email to assist with any questions in this 2 week period
Data Archives
Data preservation- why? Scientific responsibility Costs Legal requirement Future use (secondary analysis)
Data preservation- what? Original digitised data Questionnaire forms (?) Explanatory documentation (purpose and technical) Unique identifiers (for future linkage and follow up) Data at risk of being lost
Data preservation- how? Design surveys with preservation in mind (consent forms, anonymisation) Use commonly used formats (eg SPSS) Collate developmental reports (track changes) Recognised archive sites (CRRC!)
Data preservation- threats Initial user needs delay access Ownership and copyright Confidentiality, disclosure, ethics, data protection Physical storage media Logical (digital) storage format Costs Organisational change Poor data infrastructure (funding and strategy)
Survey Data: ‘version’ control Early (pre-cleaning) release ‘ Final’ release Additional variables (derivations) Preserving the original codings through: 1. using syntax to process the original data 2. saving processed data with different file name 3. creating archive of derived data sets (possibly thematic)
Exercise What factors constitute the major threats to data preservation in the South Caucasus? 2. Using your list of threats formulate a ‘best practice’ guide for the preservation of data which aims to safeguard the future of statistical data in the region.
Data file structures
Simple one-off cross-sectional Simplest file structure Data arranged in a case/variables matrix Each case has a value on each variable Each case has a unique identifier Processing involves  Selecting sub-sets of cases Selecting sub-sets of variables Recoding original variables Deriving new variables from existing ones
.. .. .. .. .. .. .. .. .. .. .. .. .. 8 .. .. 2 73 3 1 7 .. .. 10 74 2 1 6 .. .. 6 72 1 2 5 .. .. 2 73 1 2 4 .. .. 4 73 2 2 3 .. .. 3 75 3 1 2 .. .. 6 70 3 1 1 .. .. V4 V3 V2 V1 ID
Repeated cross-sectional As above but the questionnaire, or a newer version of it is administered at different points in time (say annually) Respondents are sampled anew Data processing as above Comparisons over time are macro not micro. ie. They represent aggregate change over time and not individual change.
Different respondents, same questions T1 T2 .. .. .. .. .. .. 74 1 2 3 .. 71 3 1 2 .. 72 3 1 1 .. V3 V2 V1 ID .. .. .. .. .. .. 83 3 1 3 .. 80 1 2 2 .. 79 2 2 1 .. V3 V2 V1 ID
Hierarchical cross-sectional Similar to the above but now there is more than one structure in the data eg. Respondents within households. The case/variable matrix is now ‘nested’ ie some data is for the HH and some for the individual (this can be in the same data file or can be in separate files) Separate unique code numbers are needed. Data Processing involves Accurate separation of different levels  Suitable linkage where appropriate
Hierarchical structure #1 (people in households) .. .. .. .. .. .. .. .. .. .. 1 2 2 1 1 4 .. .. 2 1 1 1 1 4 .. .. 2 1 3 2 2 3 .. .. 1 1 2 2 2 3 .. .. 2 2 1 2 2 3 .. .. 2 2 1 1 1 2 .. .. 2 1 2 1 4 1 .. .. 1 2 1 1 4 1 .. .. P2 P1 PNO H2 H1 HHID
Hierarchical structure #2 (episodes of employment) .. .. .. .. .. .. .. -8 2005 2 2 4 .. 2005 2004 1 1 4 .. -8 2001 1 3 3 .. 2001 1998 1 2 3 .. 1998 1995 2 1 3 .. -8 2002 2 1 2 .. -8 2005 1 2 1 .. 2005 2001 2 1 1 .. P3 P2 P1 EMPNO PID
Panel Using the same sample of respondents over time Questions are often also repeated at different surveys Data structure can be a simple case/variable for each phase of data collection Unique identification for each respondent which remains for the life of the panel needed. Data processing Connecting variables for a single individual over successive waves of the survey (micro data analysis)
Same respondents over time T1 T3 T2 T4
Cohort Similar to Panel but each case is from a common cohort (where this is taken to be time related) Birth cohort studies for example – all babies born in a particular week during a particular year, traced through their lives Data structure and processing same as panel
Same respondents over time T1 T3 T2 T4
Retrospective Not really a survey type but a data collection tool Can be included in any of the surveys listed above Data is (retrospectively) longitudinal  Each retrospective element needs to have unique codings for different events or episodes Data structure is ‘relational’ each element relates to each respondent as well as to the respondents other retrospective elements Data processing Time sensitive linkages of different elements
Looking backwards T1 T1 - X
Exercise What type of survey design can help with the following ideas: Young people are taking longer to get married than they used to Fear of crime is highest in the urban environment Employment and income are generally under-reported The democrats will win the US presidency in 2008
Structure of DI2007 Cross-sectional Individuals within HH All HH members Absent HH migrants
Household ID links each file HH and Ind HH members Absent Migrants
Structure on INTAS 2007 Linked to DI 2005 so panel and hierarchical (though these properties not being used) Retrospective data collection main file and 8 retrospective modules relational structure
Each data file relates to each other (person ID) Education Marriage Leisure Employment Job Housing Cohabitation Core Children
Deriving variables
Coding and recoding Original codings (as in code book) Simplifications Dealing with DK / NA and Missing codes (tidying up) Collapsing categories (substantive and statistical) Improves analysis and presentation  See  D1.sps  – DI2007 and contributions of absent HH members
Creating analytic files Protects the original data from being deleted/overwritten Small files are processed faster Less scrolling through data/variables If syntax file used, it is easy to adapt (to include or delete variables) See  D2.sps
Deriving variables Combining variables to produce a hybrid Can be scale related to summarise a concept (ie where all response codes are of the same type – ‘safety’ example.  See  D3.sps )  Can relate to a broad conceptual category (social origins using parental education and employment. See  CF1.sps ) To adjust data where you have reason to suspect that one variable might help to improve another (using reported expenditure to adjust reported income. See  CF7.sps )
Data linkage
Hierarchical links Data is nested: individual within household, or episodes belong to an individual. Link 1: attach HH data to the individual (analysing individuals, not needed for DI as already linked) Link 2 : produce summary data of all individuals in the HH, and attach to the HH data (analysing HH’s).  See  D6.sps , though it is a bit long. Link 3: attach episode data to an individual. See  CF2.sps . See earlier slides on hierarchical data.
Longitudinal links The respondents’ data from successive surveys is joined together Cross-wave ID number used for both individual and family Panel surveys and cohort surveys
Relational links Linking an individuals marital statuses and fertility statuses Linking an individuals education / employment and job statuses Linking both of the above … adding housing and leisure (so-called ‘many to many’ links ie. one individual may have had 5 jobs, 4 different addresses, 2 marriages, 4 children and so on… others might have had much less. See  CF5.sps  and  CF6.sps
Data Processing Coursework
Survey Documentation
Survey Documentation exercise In groups detail exactly what is needed to effectively begin analysing a survey data set.  try to be as precise as possible about the  type  of documentation, its  content  and the  amount  of detail that is required. If you were to manage an archive of different social surveys, what would be on your check list of details to catalogue the surveys?
Survey Documentation (ESDS) all variables should be named . Ideally, variable names should not exceed 8 characters, which ensures compatibility between all current dissemination formats used by the ESDS. The absolute maximum is 32 characters, which ensures compatibility with recent versions of all major dissemination (SPSS, ver. 12 onwards; Stata, ver. 7 onwards; and SAS, ver. 8 onwards)  all variables should be labelled . Labels should be brief (preferably ‹ 80 characters), but precise and always make explicit the unit of measurement for continuous (interval) variables. Where possible, all variable labels should reference the question number (and if necessary questionnaire)  where possible, all data labelling should be created and supplied to the ESDS as part of the data file itself. This is the expectation with data supplied in one of the three major statistical packages - SPSS, Stata or SAS  if the package being used for data management does not allow such variable and code labelling it must be provided as part of the documentation - i.e. a comprehensive list of variable names, variable descriptions, code names and variable formatting information  the code used to create all derived variables (e.g. the SPSS syntax file or Stata do file) should be provided so that interested users can see exactly how these variables have arisen  See also ESDS ‘Research Management and Documentation’
Survey Documentation (Metadata) Rationale / purpose / history Questionnaires Code book Technical details (design issues, sampling, weighting, imputation etc) Technical details for users (user based examples) Publications (working papers / technical reports / academic papers)
Example www.iser.essex.ac.uk/ulsc/bhps/doc/
User Guides
What is a thematic data user guide? A tool to assist researchers in locating and using data ie. it is not meant to provide all answers, only to point to sources which contain more detail An up-to-date collation of research/publications on a particular topic A brief description of different data sources A brief description of different research projects, their aims, and design. A collation of different theoretical questions of relevance See ESDS Education / Social Capital
Examples www.esds.ac.uk/support/thematicguides.asp
Exercise Select a substantive topic of interest to you List current data sources / theories / publications Draft an introduction to this topic that would help a researcher to quickly learn the main issues.

Data Archiving and Processing

  • 1.
    Data Archiving andProcessing Karine Sahakyan, MD, MPH American University of Armenia June 26-27, 2008 Caucasus Research Resource Centers – Armenia A Program of the Eurasia Foundation
  • 2.
    Overview Introduction, generalarchiving theory and practices Data structures and data processing Survey documentation User guides
  • 3.
    Course schedule 26th June Introduction and orientation General archiving theory and practices Data processing, data file structures, deriving variables Practical exercises and coursework
  • 4.
    Course schedule 27th June Data linkage Survey documentation Thematic user guides
  • 5.
  • 6.
  • 7.
  • 8.
  • 9.
  • 10.
  • 11.
    Data User DocumentationTheory Project Data storage and preservation (official archives)
  • 12.
    Data User DocumentationTheory Project Data processing and analysis (personal archives)
  • 13.
    Data User DocumentationTheory Project Supporting documentation
  • 14.
    Data User DocumentationTheory Project User guides
  • 15.
    Sources Elder, GHet al (1993) Working with Archival data: studying Lives, London, Sage. Dale, A et al (1988) Doing Secondary Analysis, London, Unwin Hyman. UK Data archive (www.data-archive.ac.uk) Royal Statistical Society (www.rss.org.uk) ESDS (www.esds.ac.uk) SPSS to process and analyse data www.spsstools.net/SampleSyntax.htm DI2007 and INTAS 2007 survey data sets and docs
  • 16.
    Intended course outcomes1: Understanding of the need to systematically archive and document data. 2: Ability to differentiate different data types and structures 3: Ability to use SPSS syntax files to perform data derivation, data merging and analysis 4: Appreciation of the benefits of user guides for prospective data users
  • 17.
    Assessment User guideand codebook development for the DI 2007 on a specific thematic module. Testing ILO’s 1,2 and 4 Analysis of DI2007 or INTAS survey using SPSS syntax files to derive variables / merge files / produce tables/statistics. Testing ILO 3.
  • 18.
    Assessment Course worksessions are timetabled so you expected to start both projects during this course Projects should be submitted 2 weeks after the end of the course I will be available by email to assist with any questions in this 2 week period
  • 19.
  • 20.
    Data preservation- why?Scientific responsibility Costs Legal requirement Future use (secondary analysis)
  • 21.
    Data preservation- what?Original digitised data Questionnaire forms (?) Explanatory documentation (purpose and technical) Unique identifiers (for future linkage and follow up) Data at risk of being lost
  • 22.
    Data preservation- how?Design surveys with preservation in mind (consent forms, anonymisation) Use commonly used formats (eg SPSS) Collate developmental reports (track changes) Recognised archive sites (CRRC!)
  • 23.
    Data preservation- threatsInitial user needs delay access Ownership and copyright Confidentiality, disclosure, ethics, data protection Physical storage media Logical (digital) storage format Costs Organisational change Poor data infrastructure (funding and strategy)
  • 24.
    Survey Data: ‘version’control Early (pre-cleaning) release ‘ Final’ release Additional variables (derivations) Preserving the original codings through: 1. using syntax to process the original data 2. saving processed data with different file name 3. creating archive of derived data sets (possibly thematic)
  • 25.
    Exercise What factorsconstitute the major threats to data preservation in the South Caucasus? 2. Using your list of threats formulate a ‘best practice’ guide for the preservation of data which aims to safeguard the future of statistical data in the region.
  • 26.
  • 27.
    Simple one-off cross-sectionalSimplest file structure Data arranged in a case/variables matrix Each case has a value on each variable Each case has a unique identifier Processing involves Selecting sub-sets of cases Selecting sub-sets of variables Recoding original variables Deriving new variables from existing ones
  • 28.
    .. .. .... .. .. .. .. .. .. .. .. .. 8 .. .. 2 73 3 1 7 .. .. 10 74 2 1 6 .. .. 6 72 1 2 5 .. .. 2 73 1 2 4 .. .. 4 73 2 2 3 .. .. 3 75 3 1 2 .. .. 6 70 3 1 1 .. .. V4 V3 V2 V1 ID
  • 29.
    Repeated cross-sectional Asabove but the questionnaire, or a newer version of it is administered at different points in time (say annually) Respondents are sampled anew Data processing as above Comparisons over time are macro not micro. ie. They represent aggregate change over time and not individual change.
  • 30.
    Different respondents, samequestions T1 T2 .. .. .. .. .. .. 74 1 2 3 .. 71 3 1 2 .. 72 3 1 1 .. V3 V2 V1 ID .. .. .. .. .. .. 83 3 1 3 .. 80 1 2 2 .. 79 2 2 1 .. V3 V2 V1 ID
  • 31.
    Hierarchical cross-sectional Similarto the above but now there is more than one structure in the data eg. Respondents within households. The case/variable matrix is now ‘nested’ ie some data is for the HH and some for the individual (this can be in the same data file or can be in separate files) Separate unique code numbers are needed. Data Processing involves Accurate separation of different levels Suitable linkage where appropriate
  • 32.
    Hierarchical structure #1(people in households) .. .. .. .. .. .. .. .. .. .. 1 2 2 1 1 4 .. .. 2 1 1 1 1 4 .. .. 2 1 3 2 2 3 .. .. 1 1 2 2 2 3 .. .. 2 2 1 2 2 3 .. .. 2 2 1 1 1 2 .. .. 2 1 2 1 4 1 .. .. 1 2 1 1 4 1 .. .. P2 P1 PNO H2 H1 HHID
  • 33.
    Hierarchical structure #2(episodes of employment) .. .. .. .. .. .. .. -8 2005 2 2 4 .. 2005 2004 1 1 4 .. -8 2001 1 3 3 .. 2001 1998 1 2 3 .. 1998 1995 2 1 3 .. -8 2002 2 1 2 .. -8 2005 1 2 1 .. 2005 2001 2 1 1 .. P3 P2 P1 EMPNO PID
  • 34.
    Panel Using thesame sample of respondents over time Questions are often also repeated at different surveys Data structure can be a simple case/variable for each phase of data collection Unique identification for each respondent which remains for the life of the panel needed. Data processing Connecting variables for a single individual over successive waves of the survey (micro data analysis)
  • 35.
    Same respondents overtime T1 T3 T2 T4
  • 36.
    Cohort Similar toPanel but each case is from a common cohort (where this is taken to be time related) Birth cohort studies for example – all babies born in a particular week during a particular year, traced through their lives Data structure and processing same as panel
  • 37.
    Same respondents overtime T1 T3 T2 T4
  • 38.
    Retrospective Not reallya survey type but a data collection tool Can be included in any of the surveys listed above Data is (retrospectively) longitudinal Each retrospective element needs to have unique codings for different events or episodes Data structure is ‘relational’ each element relates to each respondent as well as to the respondents other retrospective elements Data processing Time sensitive linkages of different elements
  • 39.
  • 40.
    Exercise What typeof survey design can help with the following ideas: Young people are taking longer to get married than they used to Fear of crime is highest in the urban environment Employment and income are generally under-reported The democrats will win the US presidency in 2008
  • 41.
    Structure of DI2007Cross-sectional Individuals within HH All HH members Absent HH migrants
  • 42.
    Household ID linkseach file HH and Ind HH members Absent Migrants
  • 43.
    Structure on INTAS2007 Linked to DI 2005 so panel and hierarchical (though these properties not being used) Retrospective data collection main file and 8 retrospective modules relational structure
  • 44.
    Each data filerelates to each other (person ID) Education Marriage Leisure Employment Job Housing Cohabitation Core Children
  • 45.
  • 46.
    Coding and recodingOriginal codings (as in code book) Simplifications Dealing with DK / NA and Missing codes (tidying up) Collapsing categories (substantive and statistical) Improves analysis and presentation See D1.sps – DI2007 and contributions of absent HH members
  • 47.
    Creating analytic filesProtects the original data from being deleted/overwritten Small files are processed faster Less scrolling through data/variables If syntax file used, it is easy to adapt (to include or delete variables) See D2.sps
  • 48.
    Deriving variables Combiningvariables to produce a hybrid Can be scale related to summarise a concept (ie where all response codes are of the same type – ‘safety’ example. See D3.sps ) Can relate to a broad conceptual category (social origins using parental education and employment. See CF1.sps ) To adjust data where you have reason to suspect that one variable might help to improve another (using reported expenditure to adjust reported income. See CF7.sps )
  • 49.
  • 50.
    Hierarchical links Datais nested: individual within household, or episodes belong to an individual. Link 1: attach HH data to the individual (analysing individuals, not needed for DI as already linked) Link 2 : produce summary data of all individuals in the HH, and attach to the HH data (analysing HH’s). See D6.sps , though it is a bit long. Link 3: attach episode data to an individual. See CF2.sps . See earlier slides on hierarchical data.
  • 51.
    Longitudinal links Therespondents’ data from successive surveys is joined together Cross-wave ID number used for both individual and family Panel surveys and cohort surveys
  • 52.
    Relational links Linkingan individuals marital statuses and fertility statuses Linking an individuals education / employment and job statuses Linking both of the above … adding housing and leisure (so-called ‘many to many’ links ie. one individual may have had 5 jobs, 4 different addresses, 2 marriages, 4 children and so on… others might have had much less. See CF5.sps and CF6.sps
  • 53.
  • 54.
  • 55.
    Survey Documentation exerciseIn groups detail exactly what is needed to effectively begin analysing a survey data set. try to be as precise as possible about the type of documentation, its content and the amount of detail that is required. If you were to manage an archive of different social surveys, what would be on your check list of details to catalogue the surveys?
  • 56.
    Survey Documentation (ESDS)all variables should be named . Ideally, variable names should not exceed 8 characters, which ensures compatibility between all current dissemination formats used by the ESDS. The absolute maximum is 32 characters, which ensures compatibility with recent versions of all major dissemination (SPSS, ver. 12 onwards; Stata, ver. 7 onwards; and SAS, ver. 8 onwards) all variables should be labelled . Labels should be brief (preferably ‹ 80 characters), but precise and always make explicit the unit of measurement for continuous (interval) variables. Where possible, all variable labels should reference the question number (and if necessary questionnaire) where possible, all data labelling should be created and supplied to the ESDS as part of the data file itself. This is the expectation with data supplied in one of the three major statistical packages - SPSS, Stata or SAS if the package being used for data management does not allow such variable and code labelling it must be provided as part of the documentation - i.e. a comprehensive list of variable names, variable descriptions, code names and variable formatting information the code used to create all derived variables (e.g. the SPSS syntax file or Stata do file) should be provided so that interested users can see exactly how these variables have arisen See also ESDS ‘Research Management and Documentation’
  • 57.
    Survey Documentation (Metadata)Rationale / purpose / history Questionnaires Code book Technical details (design issues, sampling, weighting, imputation etc) Technical details for users (user based examples) Publications (working papers / technical reports / academic papers)
  • 58.
  • 59.
  • 60.
    What is athematic data user guide? A tool to assist researchers in locating and using data ie. it is not meant to provide all answers, only to point to sources which contain more detail An up-to-date collation of research/publications on a particular topic A brief description of different data sources A brief description of different research projects, their aims, and design. A collation of different theoretical questions of relevance See ESDS Education / Social Capital
  • 61.
  • 62.
    Exercise Select asubstantive topic of interest to you List current data sources / theories / publications Draft an introduction to this topic that would help a researcher to quickly learn the main issues.