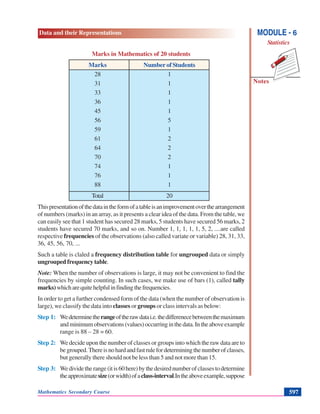
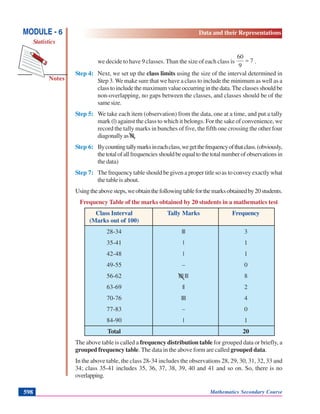
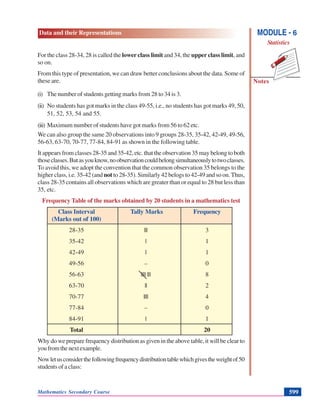
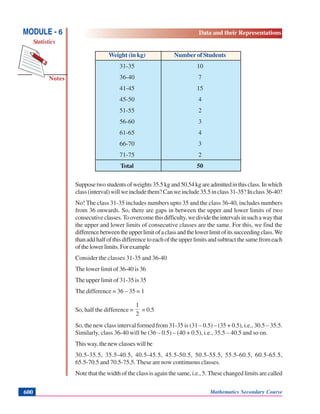
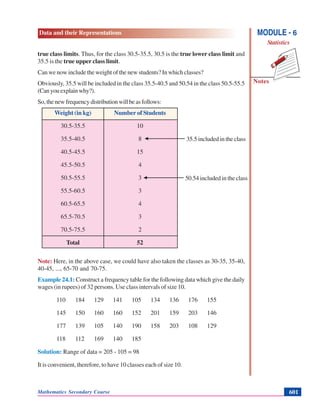
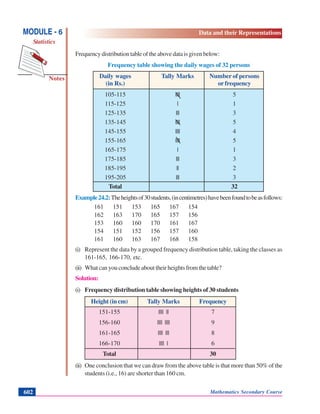
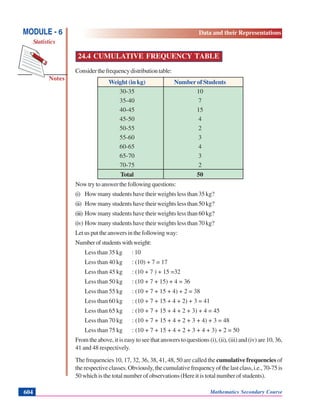
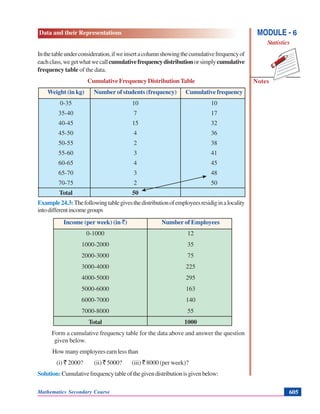
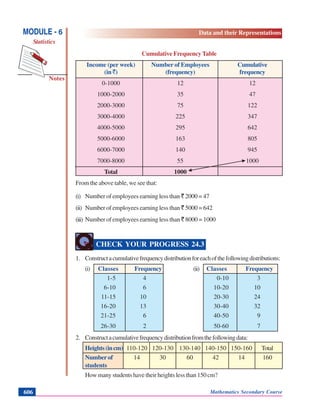
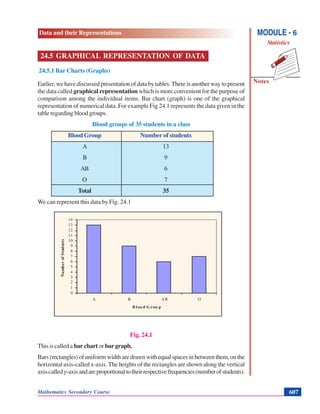
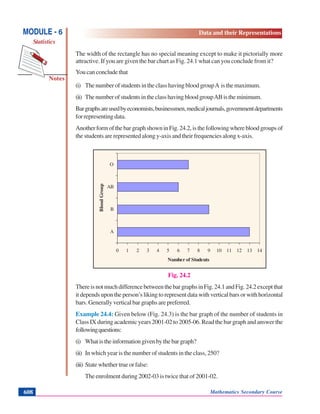
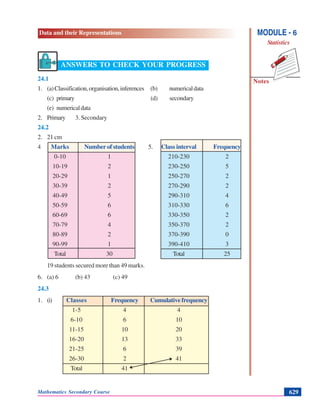
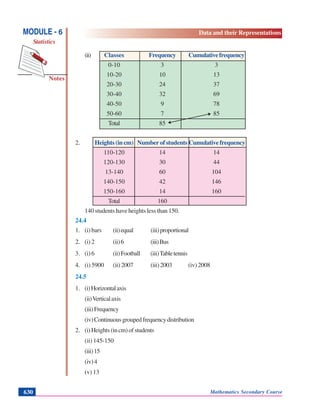
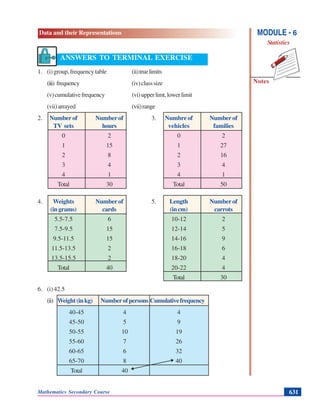
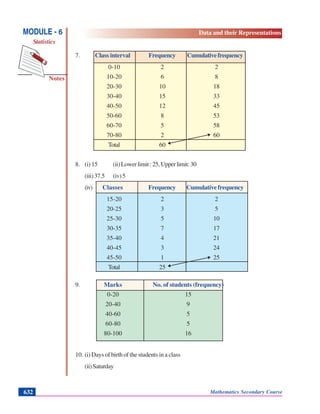
Model Call Girl in Tilak Nagar Delhi reach out to us at 🔝9953056974🔝
Data and their representations - statistics
1. Data and their Representations
Notes
MODULE - 6
Statistics
Mathematics Secondary Course 593
24
DATA AND THEIR REPRESENTATIONS
Statisticsisaspecialandanimportantbranchofmathematicswhichdealsmainlywithdata
and their representations. In this lesson, we shall make a beginning of this study of this
branch of mathematics with collection, classification, presentation and analysis of data.
Weshallstudyhowtoclassifythegivendataintoungroupedaswellasgroupedfrequency
distributions. We shall also learn about cumulative frequency of a class and cumulative
frequencytable.
Furtherweshalllearngraphicalrepresentationofdataintheformofbarcharts,histograms
andfrequencypolygons.
OBJECTIVES
Afterstudyingthislesson,youwillbeableto
• know meaning of ‘statistics’ in singular and plural form;
• differentiate between primary and secondary data;
• understand the meaning of a class, class mark, class limits, discrete and
continuous data, frequency of a class, class size or class width through examples;
• condense and represent data into a frequency table;
• form a cumulative frequency table of a frequency distribution;
• draw a bar chart or bar graph of a frequency distribution;
• draw a bar chart or bar graph for the given data;
• draw a histogram and frequency polygon for a given continuous data;
• read and interpret given bar graphs, histograms.
EXPECTED BACKGROUND KNOWLEDGE
• Writingofnumbersinincreasing/decreasingorder.
2. Notes
MODULE - 6
Statistics
Data and their Representations
Mathematics Secondary Course594
• Findingaverageoftwonumbers.
• Plotting of points in a plane with respect to two perpendicular axes
• Idea of ratio and proportion.
24.1 STATISTICS AND STATISTICAL DATA
In our day to day life, we come across statements such as:
1. This year the results of the school will be better.
2. The price of petrol/diesel may go up next month.
3. Thereislikelihoodofheavyrainsintheevening.
4. The patient may recover soon from illness, etc.
Concentrate on the above statements:
• Thefirststatementcanbefromateacherortheheadofaninstitution.Itshowsthathe/
shehasobservedtheperformanceofthepresentbatchofstudentsincomparisonwith
the earlier ones.
• The second statement may be from a person who has seen the trend of increasing of
oil prices from a newspaper.
• Thethirdstatementcanbefromapersonwhohasbeenobservingtheweatherreports
in meteorological department. If so, then one can expect that it is based on some
sound observations and analysis of the weather reports.
• The last statement can be from a doctor which is based on his/her observations and
analysis.
Thereliabilityofthestatementssuchasgivenabove,dependsupontheindividual’scapacity
for observation and analysis based on some numerical data. Statistics is the science
which deals with the collection, organisation, analysis and interpretation of the
numericaldata.
Collectionandanalysisofnumericaldataisessentialinstudyingmanyproblemssuchas
theproblemofeconomicdevelopmentofthecountry,educationaldevelopment,theproblem
ofhealthandpopulation,theproblemofagriculturaldevelopmentetc.
The word ‘statistics’has different meanings in different contexts. Obseve the following
sentences:
1. May I have the latest copy of “Educational Statistics of India”.
2. I like to study statistics. It is an interesting subject.
3. Data and their Representations
Notes
MODULE - 6
Statistics
Mathematics Secondary Course 595
In the first sentence, statistics is used in a plural sense, meaning numerical data. These
mayincludeanumberofschools/colleges/institutionsinIndia,literacyratesofstatesetc.
In the second sentence, the word ‘statistics’ is used as a singular noun, meaning the
subjectwhichdealswithclassification,tabulation/organisation,analysisofdataaswellas
drawingofmeaningfulconclusionsfromthedata.
24.2 COLLECTION OF DATA
In any field of investigation, the first step is to collect the data. It is these data that will be
analysedbytheinvestigatororthestatisticiantodrawinferences.Itis,therefore,ofutmost
importance that these data be reliable and relevant and collected according to a plan or
designwhichmustbelaidoutinadvance.
Dataaresaidtobe primary iftheinvestigatorhimselfisresponsibleforthecollectionof
data.Someexamplesofprimarydataare:voters’lists,datacollectedincensus-questionnaire
etc.
Itisnotalwayspossibleforaninvestigatortocollectdataduetolackoftimeandresources.
Inthatcase,he/hermayusedatacollectedbyothergovernmentalorprivateagencyinthe
formofpublishedreports.Theyarecalled secondarydata.Datamaybeprimaryforone
individual or agency but it becomes secondary for other using the same data.
Sincethesedataarecollectedforapurposeotherthanthatoftheoriginalinvestigators,the
usermaylosesomedetailsorthedatamaynotbeallthatrelevanttohis/herstudy.Therefore,
such data must be used with great care.
CHECK YOUR PROGRESS 24.1
1. Fillintheblankswithsuitableword(s)sothatthefollowingsentencesgivetheproper
meaning:
(a) Statistics,insingularsense,meansthesubjectwhichdealswith_______,_____,
analysis of data as well as drawing of meaningful _______ from the data.
(b) Statistics is used, in a plural sense, meaning _______________.
(c) Thedataaresaidtobe__________iftheinvestigatorhimselfisresponsiblefor
itscollection.
(d) Datatakenfromgovernmentalorprivateagenciesintheformofpublishedreports
are called __________ data.
(e) Statistics is the science which deals with collection, organisation, analysis and
interpretation of the ____________.
4. Notes
MODULE - 6
Statistics
Data and their Representations
Mathematics Secondary Course596
2. Javed wanted to know the size of shoes worn by the maximum number of persons in
a locality. So, he goes to each and every house and notes down the information on a
sheet. The data so collected is an example of ___________ data.
3. TofindthenumberofabsenteesineachdayofeachclassfromItoXII,youcollectthe
informationfromtheschoolrecords.Thedatasocollectedisanexampleof_______
data.
24.3 PRESENTATION OF DATA
Whentheworkofcollectionofdataisover,thenextsteptotheinvestigatoristofindways
tocondenseandorganisetheminordertostudytheirsalientfeatures.Suchanarrangement
of data is called presentation of data.
Suppose there are 20 students in a class. The marks obtained by the students in a
mathematics test (out of 100) are as follows:
45, 56, 61, 56, 31, 33, 70, 61, 76, 56,
36, 59, 64, 56, 88, 28, 56, 70, 64, 74
The data in this form is called raw data. Each entry such as 45, 56 etc. is called a value
or observation. By looking at it in this form, can you find the highest and the lowest
marks? What more information do you get?
Let us arrange these numbers in ascending order:
28, 31, 33, 36, 45, 56, 56, 56, 56, 56,
59, 61, 61, 64, 64, 70, 70, 74, 76, 88 ...(1)
Nowyoucangetthefollowinginformation:
(a) Highest marks obtained : 88
(b) Lowest marks obtained : 28
(c) Number of students who got 56 marks: 5
(d) Number of students who got marks more than 60 : 9
The data arranged in the form (1) above, are called arrayed data.
Presentation of data in this form is time cousuming, when the number of observations is
large.Tomakethedatamoreinformativewecanpresenttheseinatabularformasshown
below:
5. Data and their Representations
Notes
MODULE - 6
Statistics
Mathematics Secondary Course 597
Marks in Mathematics of 20 students
Marks Number of Students
28 1
31 1
33 1
36 1
45 1
56 5
59 1
61 2
64 2
70 2
74 1
76 1
88 1
Total 20
Thispresentationofthedataintheformofatableisanimprovementoverthearrangement
of numbers (marks) in an array, as it presents a clear idea of the data. From the table, we
can easily see that 1 student has secured 28 marks, 5 students have secured 56 marks, 2
students have secured 70 marks, and so on. Number 1, 1, 1, 1, 1, 5, 2, ....are called
respective frequencies of the observations (also called variate or variable) 28, 31, 33,
36, 45, 56, 70, ...
Such a table is claled a frequency distribution table for ungrouped data or simply
ungrouped frequency table.
Note: When the number of observations is large, it may not be convenient to find the
frequencies by simple counting. In such cases, we make use of bars (1), called tally
marks)whicharequitehelpfulinfindingthefrequencies.
In order to get a further condensed form of the data (when the number of observation is
large), we classify the data into classes or groups or class intervals as below:
Step 1: Wedeterminetherangeoftherawdatai.e.thedifferenecebetweenthemaximum
andminimumobservations(values)occurringinthedata.Intheaboveexample
range is 88 – 28 = 60.
Step 2: We decide upon the number of classes or groups into which the raw data are to
begrouped.Thereisnohardandfastrulefordeterminingthenumberofclasses,
but generally there should not be less than 5 and not more than 15.
Step 3: Wedividetherange(itis60here)bythedesirednumberofclassestodetermine
theapproximatesize(orwidth)ofaclass-interval.Intheaboveexample,suppose
6. Notes
MODULE - 6
Statistics
Data and their Representations
Mathematics Secondary Course598
we decide to have 9 classes. Than the size of each class is 7
9
60
≈ .
Step 4: Next, we set up the class limits using the size of the interval determined in
Step 3.We make sure that we have a class to include the minimum as well as a
classtoincludethemaximumvalueoccurringinthedata.Theclassesshouldbe
non-overlapping, no gaps between the classes, and classes should be of the
samesize.
Step 5: We take each item (observation) from the data, one at a time, and put a tally
mark (|) against the class to which it belongs. For the sake of convenience, we
record the tally marks in bunches of five, the fifth one crossing the other four
diagonallyas||||.
Step 6: Bycountingtallymarksineachclass,wegetthefrequencyofthatclass.(obviously,
thetotalofallfrequenciesshouldbeequaltothetotalnumberofobservationsin
the data)
Step 7: The frequency table should be given a proper title so as to convey exactly what
the table is about.
Usingtheabovesteps,weobtainthefollowingtableforthemarksobtainedby20students.
Frequency Table of the marks obtained by 20 students in a mathematics test
Class Interval Tally Marks Frequency
(Marks out of 100)
28-34 ||| 3
35-41 | 1
42-48 | 1
49-55 – 0
56-62 |||| ||| 8
63-69 || 2
70-76 |||| 4
77-83 – 0
84-90 | 1
Total 20
The above table is called a frequency distribution table for grouped data or briefly, a
grouped frequency table. The data in the above form are called grouped data.
In the above table, the class 28-34 includes the observations 28, 29, 30, 31, 32, 33 and
34; class 35-41 includes 35, 36, 37, 38, 39, 40 and 41 and so on. So, there is no
overlapping.
7. Data and their Representations
Notes
MODULE - 6
Statistics
Mathematics Secondary Course 599
For the class 28-34, 28 is called the lower class limit and 34, the upper class limit, and
so on.
From this type of presentation, we can draw better conclusions about the data. Some of
these are.
(i) The number of students getting marks from 28 to 34 is 3.
(ii) No students has got marks in the class 49-55, i.e., no students has got marks 49, 50,
51, 52, 53, 54 and 55.
(iii) Maximum number of students have got marks from 56 to 62 etc.
We can also group the same 20 observations into 9 groups 28-35, 35-42, 42-49, 49-56,
56-63, 63-70, 70-77, 77-84, 84-91 as shown in the following table.
It appears from classes 28-35 and 35-42, etc. that the observation 35 may belong to both
thoseclasses.Butasyouknow,noobservationcouldbelongsimultaneouslytotwoclasses.
To avoid this, we adopt the convention that the common observation 35 belongs to the
higher class, i.e. 35-42 (and not to 28-35). Similarly 42 belogs to 42-49 and so on. Thus,
class 28-35 contains all observations which are greater than or equal to 28 but less than
35, etc.
Frequency Table of the marks obtained by 20 students in a mathematics test
Class Interval Tally Marks Frequency
(Marks out of 100)
28-35 ||| 3
35-42 | 1
42-49 | 1
49-56 – 0
56-63 |||| ||| 8
63-70 || 2
70-77 |||| 4
77-84 – 0
84-91 | 1
Total 20
Why do we prepare frequency distribution as given in the above table, it will be clear to
youfromthenextexample.
Nowletusconsiderthefollowingfrequencydistributiontablewhichgivestheweightof50
students of a class:
8. Notes
MODULE - 6
Statistics
Data and their Representations
Mathematics Secondary Course600
Weight (in kg) Number of Students
31-35 10
36-40 7
41-45 15
45-50 4
51-55 2
56-60 3
61-65 4
66-70 3
71-75 2
Total 50
Supposetwostudentsofweights35.5kgand50.54kgareadmittedinthisclass.Inwhich
class(interval)willweincludethem?Canweinclude35.5inclass31-35?Inclass36-40?
No! The class 31-35 includes numbers upto 35 and the class 36-40, includes numbers
from 36 onwards. So, there are gaps in between the upper and lower limits of two
consecutiveclasses.Toovercomethisdifficulty,wedividetheintervalsinsuchawaythat
the upper and lower limits of consecutive classes are the same. For this, we find the
differencebetweentheupperlimitofaclassandthelowerlimitofitssucceedingclass.We
thanaddhalfofthisdifferencetoeachoftheupperlimitsandsubtractthesamefromeach
ofthelowerlimits.Forexample
Consider the classes 31-35 and 36-40
The lower limit of 36-40 is 36
The upper limit of 31-35 is 35
The difference = 36 – 35 = 1
So, half the difference =
2
1
= 0.5
So, the new class interval formed from 31-35 is (31 – 0.5) – (35 + 0.5), i.e., 30.5 – 35.5.
Similarly, class 36-40 will be (36 – 0.5) – (40 + 0.5), i.e., 35.5 – 40.5 and so on.
This way, the new classes will be
30.5-35.5, 35.5-40.5, 40.5-45.5, 45.5-50.5, 50.5-55.5, 55.5-60.5, 60.5-65.5,
65.5-70.5 and 70.5-75.5. These are now continuous classes.
Note that the width of the class is again the same, i.e., 5. These changed limits are called
9. Data and their Representations
Notes
MODULE - 6
Statistics
Mathematics Secondary Course 601
35.5 included in the class
50.54 included in the class
true class limits. Thus, for the class 30.5-35.5, 30.5 is the true lower class limit and
35.5 is the true upper class limit.
Can we now include the weight of the new students? In which classes?
Obviously, 35.5 will be included in the class 35.5-40.5 and 50.54 in the class 50.5-55.5
(Canyouexplainwhy?).
So,thenewfrequencydistributionwillbeasfollows:
Weight (in kg) Number of Students
30.5-35.5 10
35.5-40.5 8
40.5-45.5 15
45.5-50.5 4
50.5-55.5 3
55.5-60.5 3
60.5-65.5 4
65.5-70.5 3
70.5-75.5 2
Total 52
Note: Here, in the above case, we could have also taken the classes as 30-35, 35-40,
40-45, ..., 65-70 and 70-75.
Example 24.1: Construct a frequency table for the following data which give the daily
wages (in rupees) of 32 persons. Use class intervals of size 10.
110 184 129 141 105 134 136 176 155
145 150 160 160 152 201 159 203 146
177 139 105 140 190 158 203 108 129
118 112 169 140 185
Solution: Range of data = 205 - 105 = 98
It is convenient, therefore, to have 10 classes each of size 10.
10. Notes
MODULE - 6
Statistics
Data and their Representations
Mathematics Secondary Course602
Frequencydistributiontableoftheabovedataisgivenbelow:
Frequency table showing the daily wages of 32 persons
Daily wages Tally Marks Number of persons
(in Rs.) or frequency
105-115 |||| 5
115-125 | 1
125-135 ||| 3
135-145 |||| 5
145-155 |||| 4
155-165 |||| 5
165-175 | 1
175-185 ||| 3
185-195 || 2
195-205 ||| 3
Total 32
Example24.2:Theheightsof30students,(incentimetres)havebeenfoundtobeasfollows:
161 151 153 165 167 154
162 163 170 165 157 156
153 160 160 170 161 167
154 151 152 156 157 160
161 160 163 167 168 158
(i) Represent the data by a grouped frequency distribution table, taking the classes as
161-165, 166-170, etc.
(ii) What can you conclude about their heights from the table?
Solution:
(i) Frequency distribution table showing heights of 30 students
Height (in cm) Tally Marks Frequency
151-155 |||| || 7
156-160 |||| |||| 9
161-165 |||| ||| 8
166-170 |||| | 6
Total 30
(ii) One conclusion that we can draw from the above table is that more than 50% of the
students (i.e., 16) are shorter than 160 cm.
11. Data and their Representations
Notes
MODULE - 6
Statistics
Mathematics Secondary Course 603
CHECK YOUR PROGRESS 24.2
1. Give an example of a raw data and an arrayed data.
2. Heights(incm)of30girlsinClassIXaregivenbelow:
140 140 160 139 153 146 151 150 150 154
148 158 151 160 150 149 148 140 148 153
140 139 150 152 149 142 152 140 146 148
Determine the range of the data.
3. Differentiate between a primary data and secondary data.
4. 30 students of Class IX appeared for mathematics olympiad. The marks obtained by
themaregivenasfollows:
46 31 74 68 42 54 14 93 72 53
59 38 16 88 27 44 63 43 81 64
77 62 53 40 71 60 8 68 50 58
Construct a grouped frequency distribution of the data using the classes 0-9, 10-19
etc.Also, find the number of students who secured marks more than 49.
5. Constructafrequencytablewithclassintervalsofequalsizesusing250-270(270not
included)asoneoftheclassintervalforthefollowingdata:
268 230 368 248 242 310 272 342
310 300 300 320 315 304 402 316
406 292 355 248 210 240 330 316
406 215 262 238
6. Followingisthefrequencydistributionofages(inyears)of40teachersinaschool:
Age (in years) Number of teachers
25-31 12
31-37 15
37-43 7
43-49 5
49-55 1
Total 40
(i) What is the class size?
(ii) What is the upper class limit of class 37-43?
(iii) What is the lower class limit of class 49-55?
12. Notes
MODULE - 6
Statistics
Data and their Representations
Mathematics Secondary Course604
24.4 CUMULATIVE FREQUENCY TABLE
Considerthefrequencydistributiontable:
Weight (in kg) Number of Students
30-35 10
35-40 7
40-45 15
45-50 4
50-55 2
55-60 3
60-65 4
65-70 3
70-75 2
Total 50
Nowtrytoanswerthefollowingquestions:
(i) How many students have their weights less than 35 kg?
(ii) How many students have their weights less than 50 kg?
(iii) How many students have their weights less than 60 kg?
(iv) How many students have their weights less than 70 kg?
Letusputtheanswersinthefollowingway:
Numberofstudentswithweight:
Less than 35 kg : 10
Less than 40 kg : (10) + 7 = 17
Less than 45 kg : (10 + 7 ) + 15 =32
Less than 50 kg : (10 + 7 + 15) + 4 = 36
Less than 55 kg : (10 + 7 + 15 + 4) + 2 = 38
Less than 60 kg : (10 + 7 + 15 + 4 + 2) + 3 = 41
Less than 65 kg : (10 + 7 + 15 + 4 + 2 + 3) + 4 = 45
Less than 70 kg : (10 + 7 + 15 + 4 + 2 + 3 + 4) + 3 = 48
Less than 75 kg : (10 + 7 + 15 + 4 + 2 + 3 + 4 + 3) + 2 = 50
From the above, it is easy to see that answers to questions (i), (ii), (iii) and (iv) are 10, 36,
41 and 48 respectively.
The frequencies 10, 17, 32, 36, 38, 41, 48, 50 are called the cumulative frequencies of
therespectiveclasses.Obviously,thecumulativefrequencyofthelastclass,i.e.,70-75is
50 which is the total number of observations (Here it is total number of students).
13. Data and their Representations
Notes
MODULE - 6
Statistics
Mathematics Secondary Course 605
Inthetableunderconsideration,ifweinsertacolumnshowingthecumulativefrequencyof
eachclass,wegetwhatwecallcumulativefrequencydistributionorsimplycumulative
frequency table of the data.
Cumulative Frequency Distribution Table
Weight (in kg) Number of students (frequency) Cumulative frequency
0-35 10 10
35-40 7 17
40-45 15 32
45-50 4 36
50-55 2 38
55-60 3 41
60-65 4 45
65-70 3 48
70-75 2 50
Total 50
Example24.3:Thefollowingtablegivesthedistributionofemployeesresidiginalocality
intodifferentincomegroups
Income (per week) (in `) Number of Employees
0-1000 12
1000-2000 35
2000-3000 75
3000-4000 225
4000-5000 295
5000-6000 163
6000-7000 140
7000-8000 55
Total 1000
Form a cumulative frequency table for the data above and answer the question
given below.
Howmanyemployeesearnlessthan
(i) ` 2000? (ii) ` 5000? (iii) ` 8000 (per week)?
Solution:Cumulativefrequencytableofthegivendistributionisgivenbelow:
14. Notes
MODULE - 6
Statistics
Data and their Representations
Mathematics Secondary Course606
Cumulative Frequency Table
Income (per week) Number of Employees Cumulative
(in `) (frequency) frequency
0-1000 12 12
1000-2000 35 47
2000-3000 75 122
3000-4000 225 347
4000-5000 295 642
5000-6000 163 805
6000-7000 140 945
7000-8000 55 1000
Total 1000
From the above table, we see that:
(i) Number of employees earning less than ` 2000 = 47
(ii) Number of employees earning less than ` 5000 = 642
(iii) Number of employees earning less than ` 8000 = 1000
CHECK YOUR PROGRESS 24.3
1. Constructacumulativefrequencydistributionforeachofthefollowingdistributions:
(i) Classes Frequency (ii) Classes Frequency
1-5 4 0-10 3
6-10 6 10-20 10
11-15 10 20-30 24
16-20 13 30-40 32
21-25 6 40-50 9
26-30 2 50-60 7
2. Constructacumulativefrequencydistributionfromthefollowingdata:
Heights(incm) 110-120 120-130 130-140 140-150 150-160 Total
Number of 14 30 60 42 14 160
students
How many students have their heights less than 150 cm?
15. Data and their Representations
Notes
MODULE - 6
Statistics
Mathematics Secondary Course 607
0
1
2
3
4
5
6
7
8
9
10
11
12
13
14
A B AB O
B loo d G rou p
NumberofStudents
24.5 GRAPHICAL REPRESENTATION OF DATA
24.5.1 Bar Charts (Graphs)
Earlier,wehavediscussedpresentationofdatabytables.Thereisanotherwaytopresent
the data called graphical representation which is more convenient for the purpose of
comparison among the individual items. Bar chart (graph) is one of the graphical
representation of numerical data. For example Fig 24.1 represents the data given in the
table regarding blood groups.
Blood groups of 35 students in a class
BloodGroup Number of students
A 13
B 9
AB 6
O 7
Total 35
We can represent this data by Fig. 24.1
Fig. 24.1
This is called a bar chart or bar graph.
Bars (rectangles) of unifoirm width are drawn with equal spaces in between them, on the
horizontal axis-called x-axis. The heights of the rectangles are shown along the vertical
axis-calledy-axisandareproportionaltotheirrespectivefrequencies(numberofstudents).
16. Notes
MODULE - 6
Statistics
Data and their Representations
Mathematics Secondary Course608
The width of the rectangle has no special meaning except to make it pictorially more
attractive. If you are given the bar chart as Fig. 24.1 what can you conclude from it?
You can conclude that
(i) ThenumberofstudentsintheclasshavingbloodgroupA isthemaximum.
(ii) ThenumberofstudentsintheclasshavingbloodgroupABistheminimum.
Bargraphsareusedbyeconomists,businessmen,medicaljournals,governmentdepartments
for representing data.
AnotherformofthebargraphshowninFig.24.2,isthefollowingwherebloodgroupsof
the students are represented along y-axis and their frequencies along x-axis.
Fig. 24.2
ThereisnotmuchdifferencebetweenthebargraphsinFig.24.1andFig.24.2exceptthat
it depends upon the person’s liking to represent data with vertical bars or with horizontal
bars. Generally vertical bar graphs are preferred.
Example 24.4: Given below (Fig. 24.3) is the bar graph of the number of students in
Class IX during academic years 2001-02 to 2005-06. Read the bar graph and answer the
followingquestions:
(i) Whatistheinformationgivenbythebargraph?
(ii) In which year is the number of students in the class, 250?
(iii) State whether true or false:
The enrolment during 2002-03 is twice that of 2001-02.
0 1 2 3 4 5 6 7 8 9 10 11 12 13 14
A
B
AB
O
BloodGroup
Number of Students
17. Data and their Representations
Notes
MODULE - 6
Statistics
Mathematics Secondary Course 609
Fig. 24.3
Solution:
(i) ThebargraphrepresentsthenumberofstudentsinclassIXofaschoolduringacademic
year 2001-02 to 2005-06.
(ii) In 2003-04, the number of students in the class was 250.
(iii) Enrolment in 2002-03 = 200
Enrolment in 2001-02 = 150
2
3
1
1
3
4
150
200
<==
Therefore,thegivenstatementisfalse.
Example24.5: ThebargraphgiveninFig.24.4representsthecirculationofnewspapers
insixlanguagesinatown(thefiguresareinhundreds).Readthebargraphandanswerthe
followingquestions:
(i) FindthetotalnumberofnewspapersreadinHindi,EnglishandPunjabi.
(ii) FindtheexcessofthenumberofnewspapersreadinHindioverthoseofUrdu,Marathi
andTamiltogether.
(iii) In which language is the number of newspapers read the least?
(iv)Write,inincreasingorder,thenumberofnewspapersreadindifferentlanguages.
0
50
100
150
200
250
300
350
2001-02 2002-03 2003-04 2004-05 2005-06
Academic Year
NumberofStudents
18. Notes
MODULE - 6
Statistics
Data and their Representations
Mathematics Secondary Course610
Fig. 24.4
Solution:
(i) Number of newspapers (in hundreds) read in Hindi, English and
Punjabi = 800 + 700 + 400 = 1900
(ii) Number of newspapers (in hundreds) read in Hindi = 800
Number of newspapers (in hundreds) in Urdu,
Marathi and Tamil = 200 + 300 +100 = 600
So, difference (in hundreds) = 800 – 600) = 200
(iii) InTamil, the number of newspapers read is the least.
(iv) Tamil,Urdu,Marathi,Punjabi,English,Hindi
Construction of Bar Graphs
Wenowexplaintheconstructionofbargraphsthroughexamples:
Example24.6:Thefollowingdatagivetheamountofloans(incroresofrupees)givenby
a bank during the years 2000 to 2004:
Year Loan (in crores of rupees)
2000 25
2001 30
2002 40
2003 55
2004 60
0
100
200
300
400
500
600
700
800
English Hindi Punjabi Urdu Marathi Tamil
NumberofStudentsNewspapers(inhundred’s)
Language
19. Data and their Representations
Notes
MODULE - 6
Statistics
Mathematics Secondary Course 611
Constructionabargraphrepresentingtheaboveinformation.
Solution:
Step 1: Take a graph paper and draw two perpendicular lines and call them horizontal
and vertical axes (Fig. 24.5)
Step 2: Alongthehorizontalaxis,representtheinformation‘years’andalongthevertical
axis, represent the corresponding ‘loans (in crores of rupees)’.
Step 3: Alongthehorizontalaxis,chooseauniform(equal)widthofbarsandauniform
gap between them, according to the space available.
Step 4: Choose a suitable scale along the vertical axis in view of the data given to us.
Let us choose the scale:
1 unit of graph paper = 10 crore of rupees for the present data.
Step 5: Calculatetheheightsofthebarsfordifferentyearsasgivenbelow:
2000 :
10
1
× 25 = 2.5 units
2001 :
10
1
× 30 = 3 units
2002 :
10
1
× 40 = 4 units
2003 :
10
1
× 55 = 5.5 units
2004 :
10
1
× 60 = 6 units
Step 6: Draw five bars of equal width and heights obtained in Step 5 above, the
correspondingyearsmarkedonthehorizontalaxis,withequalspacingbetween
them as shown in Fig. 24.5.
20. Notes
MODULE - 6
Statistics
Data and their Representations
Mathematics Secondary Course612
0
10
20
30
40
50
60
70
2000 2001 2002 2003 2004
Years
Loan(incroresofrupees)
0
10
20
30
40
50
60
VI VII VIII IX X
Classes
Numberofstudentspresent
Bar graph of loans (in crores of rupees) given by a bank during the
years 2000 to 2004
Fig. 24.5
Thus, Fig. 24.5 gives the required bar graph.
Example24.7: Thedatabelowshowsthenumberofstudentspresentindifferentclasses
on a particular day.
Class VI VII VIII IX X
Number of students present 40 45 35 40 50
Represent the above data by a bar graph.
Solution: The bar graph for the above data is shown in Fig. 24.6.
Fig. 24.6
21. Data and their Representations
Notes
MODULE - 6
Statistics
Mathematics Secondary Course 613
0
5
10
15
20
25
30
35
40
45
50
55
60
Playing Reading story
books
Watching TV Listening to
music
Painting
Preferred activity
Numberofstudents
Example24.8: Asurveyof200studentsofaschoolwasdonetofindwhichactivitythey
prefertodointheirfreetimeandtheinformationthuscollectedisrecordedinthefollowing
table:
Preferred activity Number of students
Playing 60
Reading story books 45
WatchingTV 40
Listeningtomusic 25
Painting 30
Draw a bar graph for this data.
Solution: The bar graph representing the above data is shown in Fig. 24.7 below:
Fig. 24.7
CHECK YOUR PROGRESS 24.4
1. Fillintheblanks:
(i) A bar graph is a graphical representation of numerical data using _______ of
equal width.
(ii) In a bar graph, bars are drawn with _________ spaces in between them.
(iii) Inabargraph,heightsofrectanglesare_________totheirrespectivefrequencies.
2. The following bar graph shows how the members of the staff of a school come to
school.
22. Notes
MODULE - 6
Statistics
Data and their Representations
Mathematics Secondary Course614
Mode of transport of school staff
Fig. 24.8
Studythebargraphandanswerthefollowingquestions:
(i) How many members of staff come to school on bicycle?
(ii) How many member of staff come to school by bus?
(iii) What is the most common mode of transfport of the members of staff?
3. The bar graph given below shows the number of players in each team of 4 given
games:
Fig. 24.9
0
1
2
3
4
5
6
Bus Car Bicycle Foot
Mode of transport
Numberofstaffmembers
0 1 2 3 4 5 6 7 8 9 10 11 12
Basket ball
Football
Table Tennis
Volleyball
Games
Number of players
23. Data and their Representations
Notes
MODULE - 6
Statistics
Mathematics Secondary Course 615
0
200
400
600
800
1000
1200
1400
1600
2003 2004 2005 2006 2007 2008
Years
Numberoftreesplanted
Readthebargraphandanswerthefollowingquestions:
(i) Howmanyplayersplayinthevolleyballteam?
(ii) Whichgameisplayedbythemaximumnumberofplayers?
(iii) Which game is played by only 3 players?
4. The following bar graph shows the number of trees planted by an agency in different
years:
Fig. 24. 10
Study the above bar graph and answer the following questions:
(i) What is the total number of trees planted by the agency from 2003 to 2008?
(ii) Inwhichyearisthenumberoftreesplantedthemaximum?
(iii) Inwhichyearisthenumberoftreesplantedtheminimum?
(iv) In which year, the number of trees planted is less than the number of trees planted in
the year preceding it?
5. The expenditure of a company under different heads (in lakh of rupees) for a year is
givenbelow:
Head Expenditure (in lakhs of rupees)
Salaryofemployees 200
Travellingallowances 100
Electricityandwater 50
Rent 125
Others 150
Construct a bar chart to represent this data.
24. Notes
MODULE - 6
Statistics
Data and their Representations
Mathematics Secondary Course616
20 30 40 50 80 70 80
24.5.2 Histograms and Frequency Polygons
Earlier,wehavelearnttorepresentagiveninformationbymeansofabargraph.Now,we
will learn how to represent a continuous grouped frequency distribution graphically.A
continuousgroupedfrequencydistributioncanberepresentedgraphicallybyahistogram.
A histogram is a vertical bar graph with no space between the bars.
(i) The classes of the grouped data are taken along the horizontal axis and
(ii) therespectiveclassfrequenciesontheverticalaxis,usingasuitablescaleoneachaxis.
(iii) Foreachclassarectangleisconstructedwithbaseasthewidthoftheclassandheight
determinedfromtheclassfrequencies.Theareasofrectanglesareproportionaltothe
frequenciesoftheirrespectiveclasses.
Letusillustratethiswiththehelpofexamples.
Example24.9:Thefollowingisthefrequencydistributionofmarksobtainedby20students
in a class test.
Marks obtained 20-30 30-40 40-50 50-60 60-70 70-80
Number of students 1 3 1 6 4 5
Draw a histogram for the above data.
Solution: Wegothroughthefollowingstepsfordrawingahistogram.
Step 1:On a graph paper, draw two perpendicular lines and call them as horizontal and
verticalaxes.
Step 2:Along the horizontal axis, we take classes (marks) 20-30, 30-40, ... (Here each is
of equal width 10)
Step 3:Choose a suitable scale on the vertical axis to represent the frequencies (number
of students) of classes.
Step 4:Draw the rectangles as shown in Fig. 24.11.
Fig. 24.11
25. Data and their Representations
Notes
MODULE - 6
Statistics
Mathematics Secondary Course 617
20 30 40 50 80 70 80
A
B
C
D
E
F
G
H
125 130 135 140 145 150 155 160
Fig. 24.11 shows the histogram for the frequency distribution of marks obtained by 20
students in a class test.
Example 24.10: Draw a histogram for the following data:
Height 125-130 130-135 135-140 140-145 145-150 150-155 155-160
(incm)
Number of 1 2 3 5 4 3 2
students
Solution:Followingthestepsassuggestedintheaboveexample,thehistogramrepresenting
thegivendataisgivenbelow:
Fig. 24.12
Frequency Polygon
Thereisyetanotherwayofrepresentingagroupedfrequencydistributiongraphically.This
iscalled frequencypolygen.Toseewhatwemean,considerthehistograminFig.24.13.
Fig. 24.13
26. Notes
MODULE - 6
Statistics
Data and their Representations
Mathematics Secondary Course618
125 130 135 140 145 150 155 160 165
A
B
C
D
E
F
G
H
I
Let B, C, D, E, F and G be the mid points of the tops of the adjacent rectangles
(Fig.24.13).JoinBtoC,CtoD,DtoE,EtoFandFtoGbymeansoflinesegments(dotted).
To complete the polygon, join B toA(the mid point of class 10-20) and join G to H (the
mid point of the class 80-90).
Thus,ABCDEFGHisthefrequencypolygonrepresentingthedatagiveninExample24.9
Note: Although, there exists no class preceding the lowest class and no class succeeding
the highest class, we add the two classes each with zero frequency so that we can make
the area of the frequency polygon the same as the area of the histogram.
Example 24.11: Draw a frequency polygon for the data in Example 24.12.
Solution: Histogram representing the given data is shown in Fig. 24.12. For frequency
polygon,wefollowtheprocedureasgivenabove.ThefrequencypolygenABCDEFGHI
representingthegivendataisgivenbelow:
Fig. 24.14
Example 24.12: Marks (out of 50) obtained by 30 students of Class IX in a mathematics
testaregiveninthefollowingtable:
Marks 0-10 10-20 20-30 30-40 40-50
Numberofstudents 5 8 6 7 4
Draw a frequency polygon for this data.
Solution: Let us first draw a histogram for this data (Fig. 24.15)
MarkthemidpointsB,C,D,EandFof the topsof the rectanglesasshowninFig.24.15.
Here, the first class is 0-10. So, to find the class preceding 0-10, we extend the horizontal
axisinthenegativedirectionandfindthemidpointoftheimaginaryclass(–10)-0.Letus
27. Data and their Representations
Notes
MODULE - 6
Statistics
Mathematics Secondary Course 619
O 10 20 30 40 50 60
A
B
C
D
E
F
GH
Fig. 24.15
join B to the mid point of the class (015010)-0. LetAbe the mid point where this line
segment meets the vertial axis. Let G be the mid point of the class 50-60 (succeeding the
last class). Let the line segment FG intersects the length of the last rectangle at I (Fig.
24.15). Then OABCDEFIH is the required frequency polygen representing the given
data.
Note: Why have we not taken the points before O and G? This is so because marks
obtainedbythestudentscannotgobelow0andbeyondmaximummarks50.Inthefigure,
extremelinesegmentsareonlypartlydrawnandthenbroughtdownverticallyto0and50.
Frequencypolygoncanalsobedrawnindependentlywithoutdrawinghistogram.Wewill
illustrateitthroughthefollowingexample.
Example 24.13: Draw a frequency polygon for the data given in Example 24.9, without
drawing a histogram for the data.
Solution: Todrawafrequencypolygonwithoutdrawingahistogram,wegothroughthe
followingsteps.
Step 1: Draw two lines perpendicualar to each other.
Step 2: Find the class marks of the classes.
Here they are:
2
8070
and
2
7060
,
2
6050
,
2
5040
,
2
4030
,
2
3020 ++++++
i.e. the class marks are 25, 35, 45, 55, 65 and 75 respectively.
Step 3: Plot the points B (25, 1), C(35, 3), D(45, 1), E(55, 6), F(65, 4) and G(75, 5),
i.e., (class mark, frequency)
Step 4: Join the points B, C, D, E, F and G by line segments and complete the polygon
asexplainedearlier.
I
28. Notes
MODULE - 6
Statistics
Data and their Representations
Mathematics Secondary Course620
Thefrequencypolygon(ABCDEFGH)isgivenbelow:
Fig. 24.16
Reading a Histogram
Considerthefollowingexample:
Example24.14: Studythehistogramgivenbelowandanswerthefollowingquestions:
Fig. 24.17
(i) What is the number of teachers in the oldest and the youngest group in the school?
(ii) Inwhichagegroupisthenumberofteachersmaximum?
A
20 25 30 35 40 45 50 55
20 30 40 50 60 70 80
H
C (35, 3)
D (45, 1)
E (55, 6)
F (65, 4)
G (75, 5)
B (25, 1)
Frequency
29. Data and their Representations
Notes
MODULE - 6
Statistics
Mathematics Secondary Course 621
(iii) In which age group is the number of teachers 4?
(iv) In which two age groups, the number of teachers is the same?
Solution:
(i) Number of teachers in oldest and youngest group = 3 + 2 = 5
(ii) Number of teachers is the maximum in the age group 35-40.
(iii) In the age group 30-35, the number of teachers is 4.
(iv) Numberofteachersisthesameintheagegroups25-35and40-45.Itis4ineachgroup.
In age groups 20-25 and 50-55, the number of teachers is same i.e., 2
CHECK YOUR PROGRESS 24.5
1. Fillintheblanks:
(i) In a histogram, the class intervals are generally taken along ________.
(ii) In a histogram, the class frequencies are generally taken along _______.
(iii) In a histogram, the areas of rectangles are proportional to the _______ of the
respective classes.
(iv) A histogram is a graphical representation of a __________.
2. The daily earnings of 26 workers are given below:
Daily earnings 150-200 200-250 250-300 300-350 350-400
(in `)
Number of 4 8 5 6 3
workers
Draw a histogram to represent the data.
3. Draw a frequency polygon for the data in Question 2 above by
(i) drawingahistogram
(ii) withoutdrawingahistogram
4. Observethehistogramgivenbelowandanswerthefollowingquestions:
(i) Whatinformationisgivenbythehistogram?
(ii) Inwhichclass(group)isthenumberofstudentsmaximum?
(iii) How many students have the height of 145 cm and above?
(iv) How many students have the height less than 140 cm?
30. Notes
MODULE - 6
Statistics
Data and their Representations
Mathematics Secondary Course622
(v) How many students have the height more than or equal to 140 but less than 155?
Fig. 24.18
LET US SUM UP
• Statisticsisthatbranchofmathematicswhichdealswithcollection,organisation,analysis
and interpretation of data.
• Statisticsisusedinbothpluralandsingularsense.
• The data collected from the respondents “as it is” is called raw data.
• Data are said to be primary if the investigator himself collects it through his/her own
designedtools.
• Data taken from other sources such as printed reports, and not collected by the
experimenterhimself,iscalledsecondarydata.
• The raw data arranged in ascending or decending order is called “arrayed data”.
• Whenthearrayeddataarearrangedwithfrequencies,theyaresaidtoformafrequency
table for ungrouped data or a ungrouped frequency distribution table.
• When the data are divided into groups/classes, they are called grouped data.
• Thedifferencebetweenthemaximumandminimumobservationsoccuringinthedata
is called the range of the raw data.
• The number of classes have to be decided according to the range of the data and size
ofclass.
130 135 140 145 150 155 160 165 177
31. Data and their Representations
Notes
MODULE - 6
Statistics
Mathematics Secondary Course 623
• In a class say 10-15, 10 is called the lower limit and 15 is called the upper limit of the
class.
• The number of observations in a particualr class is called its frequency and the table
showingclasseswithfrequenciesiscalledafrequencytable.
• Sometimes, the classes have to be changed to make them continuous. In such case,
theclasslimitsarecalledtrueclasslimits.
• Thetotaloffrequencyofaparticularclassandfrequenciesofallotherclassespreceding
thatclassiscalledthecumulativefrequencyofthatclass.
• Thetableshowingcumulativefrequenciesiscalledcumulativefrequencytable.
• A bar graph is a graphical representation of the numerical data by a number of bars
(rectangles)ofuniformwidth,erectedhorizontallyorverticallywithequalspacebetween
them.
• A histogram is a graphical representation of a grouped frequency distribution with
continuous classes. In a histogram, the area of the rectangles are proportional to the
correspondingfrequencies.
• A frequency polygon is obtianed by first joining the mid points of the tops of the
adjacentrectanglesinthehistogramandthenjoiningthemidpointoffirstrectangleto
the mid point of the class preceding the lowest class and the the last mid point to the
midpointoftheclasssucceedingthehighestclass.
• A frequency polygon can also be drawn independently without drawing a histogram
by using the class marks of the classes and respective frequencies of the classes.
TERMINAL EXERCISE
1. Fillintheblanksbyappropriatewords/phrasestomakeeachofthefollowingstatements
true:
(i) Whenthedataarecondensedinclassesofequalsizewithfrequencies,theyare
called ________ data and the table is called _______ table.
(ii) Whentheclasslimitsareadjustedtomakethemcontinuous,theclasslimitsare
renamed as ________.
(iii) Thenumberofobservationsfallinginaparticularclassiscalledits_______.
(iv) The difference between the upper limit and lower limit of a class is called
_________.
(v) The sum of frequencies of a class and all classes prior to that class is called
________ frequency of that class.
32. Notes
MODULE - 6
Statistics
Data and their Representations
Mathematics Secondary Course624
(vi) Class size = Difference between ________ and _____ of the class.
(vii) The raw data arranged in ascending or descending order is called an _______
data.
(viii) Thedifferencebetweenthemaximumandminimumobservationsoccuringinthe
data is called the _________ of the raw data.
2. The number of TV sets in each of 30 households are given below:
1, 2, 2, 4, 2, 1, 1, 1, 2, 1, 3, 1, 1, 1, 3
1, 2, 2, 1, 2, 0, 3, 3, 1, 2, 1, ,1 0, 1, 1
Construct a frequency table for the data.
3. Thenumberofvehiclesownedbyeachof50familiesarelistedbelow:
2, 1, 2, 1, 1, 1, 2, 1, 2, 1, 0, 1, 1, 2, 3, 1, 1, 1,
2, 2, 1, 1, 3, 1, 1, 2, 1, 0, 1, 2, 1, 2, 1, 1, 4, 1
3, 1, 1, 1, 2, 2, 2, 2, 1, 1, 3, 2, 1, 2
Construct a frequency distribution table for the data.
4. The weight (in grams) of 40 NewYear’s cards were found as:
10.4 6.3 8.7 7.3 8.8 9.1 6.7 11.1 14.0 12.2
11.3 9.4 8.6 7.1 8.4 10.0 9.1 8.8 10.3 10.2
7.3 8.6 9.7 10.9 13.6 9.8 8.9 9.2 10.8 9.4
6.2 8.8 9.4 9.9 10.1 11.4 11.8 11.2 10.1 8.3
Prepare a grouped frequency distribution using the class 5.5-7.5, 7.5-9.5 etc.
5. The lengths, in centimetres, to the nearest centimeter of 30 carrots are given below:
15 21 20 10 18 18 16 18 20 20
18 16 13 15 15 16 13 14 14 16
12 15 17 12 14 15 13 11 14 17
Constructafrequencytableforthedatausingequalclasssizesandtakingoneclassas
10-12 (12 excluded).
6. Thefollowingisthedistributionofweights(inkg)of40persons:
33. Data and their Representations
Notes
MODULE - 6
Statistics
Mathematics Secondary Course 625
Weight Number of persons
40-45 4
45-50 5
50-55 10
55-60 7
60-65 6
65-70 8
Total 40
(i) Determine the class marks of the classes 40-45, 45-50 etc.
(ii) Constructacumulativefrequencytable.
7. Theclassmarksofadistributionandthecorrespondingfrequenciesaregivenbelow:
Class marks 5 15 25 35 45 55 65 75
Frequency 2 6 10 15 12 8 5 2
Determinethefrequencytableandconstructthecumulativefrequencytable.
8. Forthefollowingfrequencytable
Classes Frequency
15-20 2
20-25 3
25-30 5
30-35 7
35-40 4
40-45 3
45-50 1
Total 25
(i) Write the lower limit of the class 15-20.
(ii) Write the class limits of the class 25-30.
(iii) Find the class mark of the class 35-40.
(iv) Determinetheclasssize.
(v) Formacumulativefrequencytable.
34. Notes
MODULE - 6
Statistics
Data and their Representations
Mathematics Secondary Course626
9. Givenbelowisacumulativefrequencydistributiontableshowingmarksobtainedby
50 students of a class.
Marks Number of students
Below 20 15
Below 40 24
Below 60 29
Below 80 34
Below 100 50
Form a frequency table from the above data.
10. Draw a bar graph to represent the following data of sales of a shopkeeper:
Day Monday Tuesday Wednesday Thursday Friday Saturday
Sales (in `) 16000 18000 17500 9000 85000 16500
11. Studythefollowingbargraphandanswerthefollowingquestions:
Fig. 24.19
(i) Whatistheinformationgivenbythebargraph?
(ii) Onwhichdayisnumberofstudentsbornthemaximum?
(iii) How many more students were born onThursday than that onTuesday.
(iv) What is the total number of students in the class?
35. Data and their Representations
Notes
MODULE - 6
Statistics
Mathematics Secondary Course 627
10 15 20 25 30 35 40
12. The times (in minutes) taken to complete a crossword at a competition were noted
for 50 competitors are recorded in the following table:
Time (in minutes) Number of competitors
20-25 8
25-30 10
30-35 9
35-40 12
40-45 6
45-50 5
(i) Construct a histogram for the data.
(ii) Constructafrequencypolygon.
13. Constructafrequencypolygonforthadatainquestion12withoutdrawingahistogram.
14. The following histogram shows the number of literate females in the age group 10 to
40 (in years) in a town:
Fig. 24.20
Studytheabovehistogramandanswerthefollowingquestions:
(i) Whatwasthetotalnumberofliteratefemalesinthetownintheagegroup10to40?
(ii) Inwhichagegroup,thenumberofliteratefemaleswasthehighest?
(iii) In which two age groups was the number of literate females the same?
36. Notes
MODULE - 6
Statistics
Data and their Representations
Mathematics Secondary Course628
(iv) State true or false:
The number of literate females in the age group 25-30 is the sum of the numbers of
literate females in the age groups 20-25 and 35-40.
Write the correct option:
15. The sum of the class marks of the classes 90-120 and 120-150 is
(A) 210 (B) 220 (C) 240 (D) 270
16. The range of the data
28, 17, 20, 16, 19, 12, 30, 32, 10 is
(A) 22 (B) 28 (C) 30 (D) 32
17. Inafrequencydistribution,themid-valueofaclassis12anditswidthis6.Thelower
limitoftheclassis:
(A) 6 (B) 9 (C) 12 (D) 18
18. The width of each of five continuous classes in a frequency distribution is 5 and the
lowerlimitofthelowest(first)classis10.Theupperlimitofthehighest(last)classis
(A) 15 (B) 20 (C) 30 (D) 35
19. The class marks (in order) of a frequency distribution are 10, 15, 20, .... The class
corresponding to the class mark 15 is
(A) 11.5-18.5 (B) 17.5-22.5
(C) 12.5-17.5 (D) 13.5-16.5
20. Fordrawingafrequencypolygonofacontinuousfrequencydistribution,weplotthe
points whose ordinates are the frequencies of the respective classes and abcissae are
respectively:
(A) class marks of the classes (B)lowerlimitsoftheclasses
(C) upperlimitsoftheclasses (D)upperlimitsofprecedingclasses
37. Data and their Representations
Notes
MODULE - 6
Statistics
Mathematics Secondary Course 629
ANSWERS TO CHECK YOUR PROGRESS
24.1
1. (a)Classification,organisation,inferences (b) numericaldata
(c) primary (d) secondary
(e) numericaldata
2. Primary 3. Secondary
24.2
2. 21 cm
4 Marks Number of students 5. Class interval Frequency
0-10 1 210-230 2
10-19 2 230-250 5
20-29 1 250-270 2
30-39 2 270-290 2
40-49 5 290-310 4
50-59 6 310-330 6
60-69 6 330-350 2
70-79 4 350-370 2
80-89 2 370-390 0
90-99 1 390-410 3
Total 30 Total 25
19 students secured more than 49 marks.
6. (a) 6 (b) 43 (c) 49
24.3
1. (i) Classes Frequency Cumulative frequency
1-5 4 4
6-10 6 10
11-15 10 20
16-20 13 33
21-25 6 39
26-30 2 41
Total 41
38. Notes
MODULE - 6
Statistics
Data and their Representations
Mathematics Secondary Course630
(ii) Classes Frequency Cumulativefrequency
0-10 3 3
10-20 10 13
20-30 24 37
30-40 32 69
40-50 9 78
50-60 7 85
Total 85
2. Heights (in cm) Number of students Cumulativefrequency
110-120 14 14
120-130 30 44
13-140 60 104
140-150 42 146
150-160 14 160
Total 160
140 students have heights less than 150.
24.4
1. (i) bars (ii)equal (iii)proportional
2. (i) 2 (ii)6 (iii)Bus
3. (i) 6 (ii)Football (iii)Tabletennis
4. (i) 5900 (ii)2007 (iii)2003 (iv) 2008
24.5
1. (i)Horizontalaxis
(ii)Verticalaxis
(iii)Frequency
(iv)Continuousgroupedfrequencydistribution
2. (i)Heights(incm)ofstudents
(ii) 145-150
(iii)15
(iv)4
(v) 13
39. Data and their Representations
Notes
MODULE - 6
Statistics
Mathematics Secondary Course 631
ANSWERS TO TERMINAL EXERCISE
1. (i)group,frequencytable (ii)truelimits
(iii) frequency (iv)classsize
(v)cumulativefrequency (vi)upperlimt,lowerlimit
(vii)arrayed (vii)range
2. Number of Number of 3. Numbre of Number of
TV sets hours vehicles families
0 2 0 2
1 15 1 27
2 8 2 16
3 4 3 4
4 1 4 1
Total 30 Total 50
4. Weights Number of 5. Length Number of
(ingrams) cards (incm) carrots
5.5-7.5 6 10-12 2
7.5-9.5 15 12-14 5
9.5-11.5 15 14-16 9
11.5-13.5 2 16-18 6
13.5-15.5 2 18-20 4
Total 40 20-22 4
Total 30
6. (i) 42.5
(ii) Weight(inkg) Numberofpersons Cumulativefrequency
40-45 4 4
45-50 5 9
50-55 10 19
55-60 7 26
60-65 6 32
65-70 8 40
Total 40
40. Notes
MODULE - 6
Statistics
Data and their Representations
Mathematics Secondary Course632
7. Class interval Frequency Cumulativefrequency
0-10 2 2
10-20 6 8
20-30 10 18
30-40 15 33
40-50 12 45
50-60 8 53
60-70 5 58
70-80 2 60
Total 60
8. (i) 15 (ii)Lowerlimit:25,Upperlimit:30
(iii)37.5 (iv)5
(iv) Classes Frequency Cumulative frequency
15-20 2 2
20-25 3 5
25-30 5 10
30-35 7 17
35-40 4 21
40-45 3 24
45-50 1 25
Total 25
9. Marks No. of students (frequency)
0-20 15
20-40 9
40-60 5
60-80 5
80-100 16
10. (i) Days of birth of the students in a class
(ii)Saturday
41. Data and their Representations
Notes
MODULE - 6
Statistics
Mathematics Secondary Course 633
(iii) 1
(iv) 31
11. (i) 2250 (ii) 25-30
(iii) 10-15 and 30-35 (iv)True
12. (C)
13. (A)
14. (B)
15. (D)
16. (C)
17. (A)