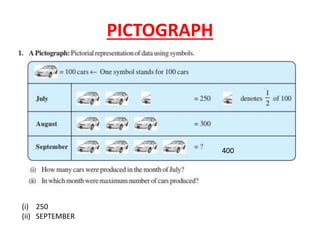
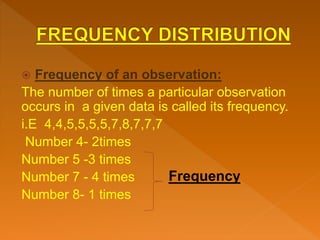
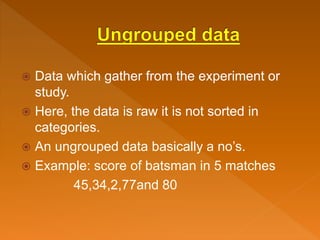
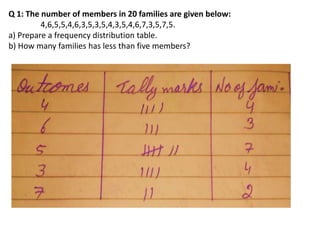
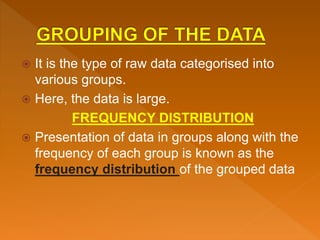
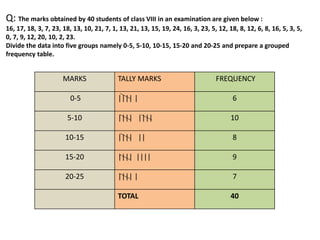
DATA - HANDLING
By Ms Geetanjali
youtube channel-
Geetanjali Adhikari
https://www.youtube.co
m/watch?v=g5JTMQEg
 Statistics is the branch of science which deals
with the collection, classification , tabulation
and interpretation of numerical data
 Collection of Raw facts and figures is called
data.
 i.e 2,4,56,anil, amul, 78, etc
 Each numerical facts of this type is known as
an observation/numerical data.
 Pictograph
 Bar graph
 Double bar graph
 Pie chart
 Histogram
 polygon
PICTOGRAPH
(i) 250
(ii) SEPTEMBER
400
ANS: (i) No. of students in each year in class 8th
(II) 2003-2004
(III)2007-2008
(IV) yes
ANS: (i) marks obtained by students in maths and science
(ii)maths
(iii)english
 Frequency of an observation:
The number of times a particular observation
occurs in a given data is called its frequency.
i.E 4,4,5,5,5,5,7,8,7,7,7
Number 4- 2times
Number 5 -3 times
Number 7 - 4 times
Number 8- 1 times
Frequency
 Data which gather from the experiment or
study.
 Here, the data is raw it is not sorted in
categories.
 An ungrouped data basically a no’s.
 Example: score of batsman in 5 matches
45,34,2,77and 80
Q 1: The number of members in 20 families are given below:
4,6,5,5,4,6,3,5,3,5,4,3,5,4,6,7,3,5,7,5.
a) Prepare a frequency distribution table.
b) How many families has less than five members?
 It is the type of raw data categorised into
various groups.
 Here, the data is large.
FREQUENCY DISTRIBUTION
 Presentation of data in groups along with the
frequency of each group is known as the
frequency distribution of the grouped data
Q: The marks obtained by 40 students of class VIII in an examination are given below :
16, 17, 18, 3, 7, 23, 18, 13, 10, 21, 7, 1, 13, 21, 13, 15, 19, 24, 16, 3, 23, 5, 12, 18, 8, 12, 6, 8, 16, 5, 3, 5,
0, 7, 9, 12, 20, 10, 2, 23.
Divide the data into five groups namely 0-5, 5-10, 10-15, 15-20 and 20-25 and prepare a grouped
frequency table.
MARKS TALLY MARKS FREQUENCY
0-5 |||| | 6
5-10 |||| |||| 10
10-15 |||| || 8
15-20 |||| |||| 9
20-25 |||| | 7
TOTAL 40
Data handling class 8

Data handling class 8

  • 1.
    DATA - HANDLING ByMs Geetanjali youtube channel- Geetanjali Adhikari https://www.youtube.co m/watch?v=g5JTMQEg
  • 2.
     Statistics isthe branch of science which deals with the collection, classification , tabulation and interpretation of numerical data
  • 3.
     Collection ofRaw facts and figures is called data.  i.e 2,4,56,anil, amul, 78, etc  Each numerical facts of this type is known as an observation/numerical data.
  • 5.
     Pictograph  Bargraph  Double bar graph  Pie chart  Histogram  polygon
  • 6.
  • 8.
    ANS: (i) No.of students in each year in class 8th (II) 2003-2004 (III)2007-2008 (IV) yes
  • 9.
    ANS: (i) marksobtained by students in maths and science (ii)maths (iii)english
  • 10.
     Frequency ofan observation: The number of times a particular observation occurs in a given data is called its frequency. i.E 4,4,5,5,5,5,7,8,7,7,7 Number 4- 2times Number 5 -3 times Number 7 - 4 times Number 8- 1 times Frequency
  • 11.
     Data whichgather from the experiment or study.  Here, the data is raw it is not sorted in categories.  An ungrouped data basically a no’s.  Example: score of batsman in 5 matches 45,34,2,77and 80
  • 12.
    Q 1: Thenumber of members in 20 families are given below: 4,6,5,5,4,6,3,5,3,5,4,3,5,4,6,7,3,5,7,5. a) Prepare a frequency distribution table. b) How many families has less than five members?
  • 13.
     It isthe type of raw data categorised into various groups.  Here, the data is large. FREQUENCY DISTRIBUTION  Presentation of data in groups along with the frequency of each group is known as the frequency distribution of the grouped data
  • 14.
    Q: The marksobtained by 40 students of class VIII in an examination are given below : 16, 17, 18, 3, 7, 23, 18, 13, 10, 21, 7, 1, 13, 21, 13, 15, 19, 24, 16, 3, 23, 5, 12, 18, 8, 12, 6, 8, 16, 5, 3, 5, 0, 7, 9, 12, 20, 10, 2, 23. Divide the data into five groups namely 0-5, 5-10, 10-15, 15-20 and 20-25 and prepare a grouped frequency table. MARKS TALLY MARKS FREQUENCY 0-5 |||| | 6 5-10 |||| |||| 10 10-15 |||| || 8 15-20 |||| |||| 9 20-25 |||| | 7 TOTAL 40