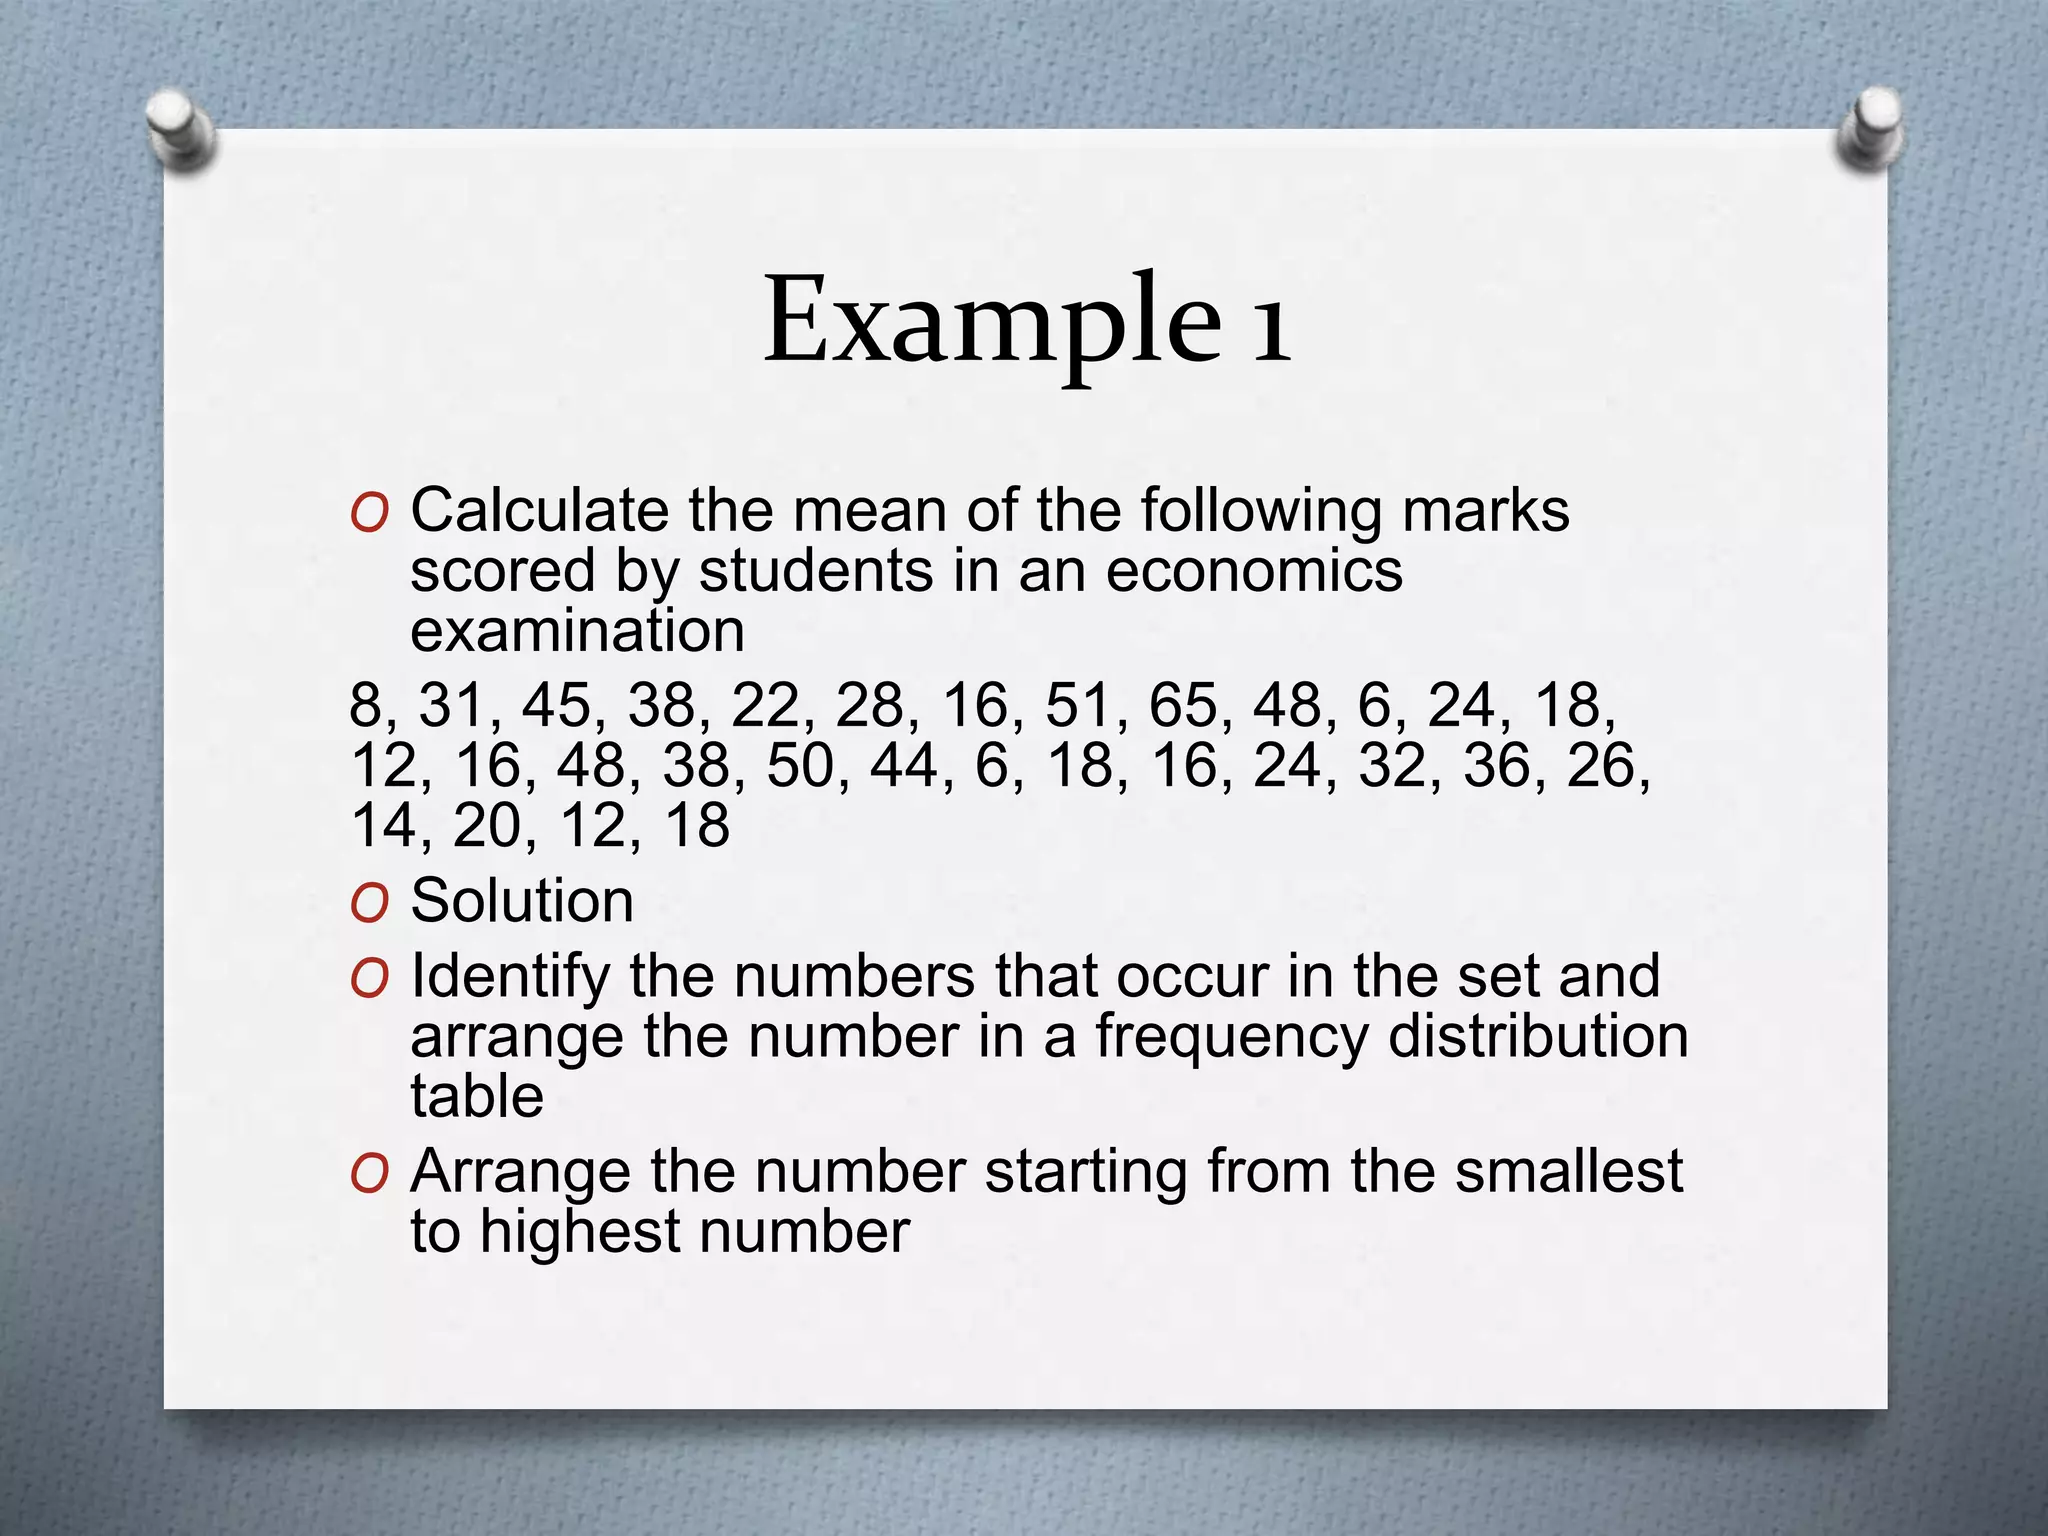
Measurement of
Central Tendency
Arithmetic Mean, Median,
Mode, Geometric mean,
Harmonic mean
Arithmetic Mean
O Definition: The Arithmetic mean also
popularly referred to as the ‘mean’ is
the average series of figures or values.
O It is obtained by dividing the sum of
these figures by the total number
figures or values.
O It is also the average of a collection of
observation.
O It is the most popularly used measure
of central tendency.
Formula for calculating arithmetic
meanOArithmetic mean 𝑥 =
Σ𝑥
𝑛
where
OX = arithmetic mean
O∑ =represents a Greek letter denoting ‘sum of’
OX = a series of figures in a given data
On = number of figures or elements
Mean of grouped data
O The arithmetic mean can also be
prepared for grouped data. In this
case, the class mark (mid points) of
the individual class interval can be
used for the x-column.
O Formula: Arithmetic mean 𝑥 =
Σ𝑓𝑥
Σ𝑓
Example 1
O Calculate the mean of the following marks
scored by students in an economics
examination
8, 31, 45, 38, 22, 28, 16, 51, 65, 48, 6, 24, 18,
12, 16, 48, 38, 50, 44, 6, 18, 16, 24, 32, 36, 26,
14, 20, 12, 18
O Solution
O Identify the numbers that occur in the set and
arrange the number in a frequency distribution
table
O Arrange the number starting from the smallest
to highest number
Continued from last slide
OUse a class interval of 0 – 9, 10 – 19, 20 – 29,
etc.
OPrepare a frequency table.
Scores
(Grouping
s)
x
Class
Mark
Tally or
Events
f
Frequenc
y
(fx)
0 – 9 4.5 ||| 3 13.5
10 – 19 14.5 |||| |||| 9 130.5
20 – 29 24.5 |||| | 6 147.0
30 – 39 34.5 |||| 5 172.5
40 – 49 44.5 |||| 4 178.0
50 – 59 54.5 || 2 109.0
60 – 69 64.5 | 1 64.5
⅀f = 30 ⅀fx =815
Contd.
Σ𝑓𝑥
Σ𝑓
=
815
30
= 27.2
The median
O The median is defined as an average
which is the middle value when figures are
arranged in order of magnitude.
O In an even distribution, the median is the
average of two middle numbers i.e. the
median of a distribution is the middle
value when the observations are arranged
in other of magnitude starting with either
the smallest or the largest number.
O The median is therefore the value of the
middle item.
Median of grouped data
O When a grouped data is involved,
cumulative frequency is used.
O This is used when items or values are
large and arranging them in ascending
order may not work. The formula would
now be
O Median = 𝑁+1
2
th member for odd number
of items where N is odd.
O Median =
𝑁
2
𝑡ℎ+
𝑁
2
+1
2
member for even
number of items i.e. where N is even.

Measurement of central tendency

  • 1.
    Measurement of Central Tendency ArithmeticMean, Median, Mode, Geometric mean, Harmonic mean
  • 2.
    Arithmetic Mean O Definition:The Arithmetic mean also popularly referred to as the ‘mean’ is the average series of figures or values. O It is obtained by dividing the sum of these figures by the total number figures or values. O It is also the average of a collection of observation. O It is the most popularly used measure of central tendency.
  • 3.
    Formula for calculatingarithmetic meanOArithmetic mean 𝑥 = Σ𝑥 𝑛 where OX = arithmetic mean O∑ =represents a Greek letter denoting ‘sum of’ OX = a series of figures in a given data On = number of figures or elements
  • 4.
    Mean of groupeddata O The arithmetic mean can also be prepared for grouped data. In this case, the class mark (mid points) of the individual class interval can be used for the x-column. O Formula: Arithmetic mean 𝑥 = Σ𝑓𝑥 Σ𝑓
  • 5.
    Example 1 O Calculatethe mean of the following marks scored by students in an economics examination 8, 31, 45, 38, 22, 28, 16, 51, 65, 48, 6, 24, 18, 12, 16, 48, 38, 50, 44, 6, 18, 16, 24, 32, 36, 26, 14, 20, 12, 18 O Solution O Identify the numbers that occur in the set and arrange the number in a frequency distribution table O Arrange the number starting from the smallest to highest number
  • 6.
    Continued from lastslide OUse a class interval of 0 – 9, 10 – 19, 20 – 29, etc. OPrepare a frequency table. Scores (Grouping s) x Class Mark Tally or Events f Frequenc y (fx) 0 – 9 4.5 ||| 3 13.5 10 – 19 14.5 |||| |||| 9 130.5 20 – 29 24.5 |||| | 6 147.0 30 – 39 34.5 |||| 5 172.5 40 – 49 44.5 |||| 4 178.0 50 – 59 54.5 || 2 109.0 60 – 69 64.5 | 1 64.5 ⅀f = 30 ⅀fx =815
  • 7.
  • 8.
    The median O Themedian is defined as an average which is the middle value when figures are arranged in order of magnitude. O In an even distribution, the median is the average of two middle numbers i.e. the median of a distribution is the middle value when the observations are arranged in other of magnitude starting with either the smallest or the largest number. O The median is therefore the value of the middle item.
  • 9.
    Median of groupeddata O When a grouped data is involved, cumulative frequency is used. O This is used when items or values are large and arranging them in ascending order may not work. The formula would now be O Median = 𝑁+1 2 th member for odd number of items where N is odd. O Median = 𝑁 2 𝑡ℎ+ 𝑁 2 +1 2 member for even number of items i.e. where N is even.