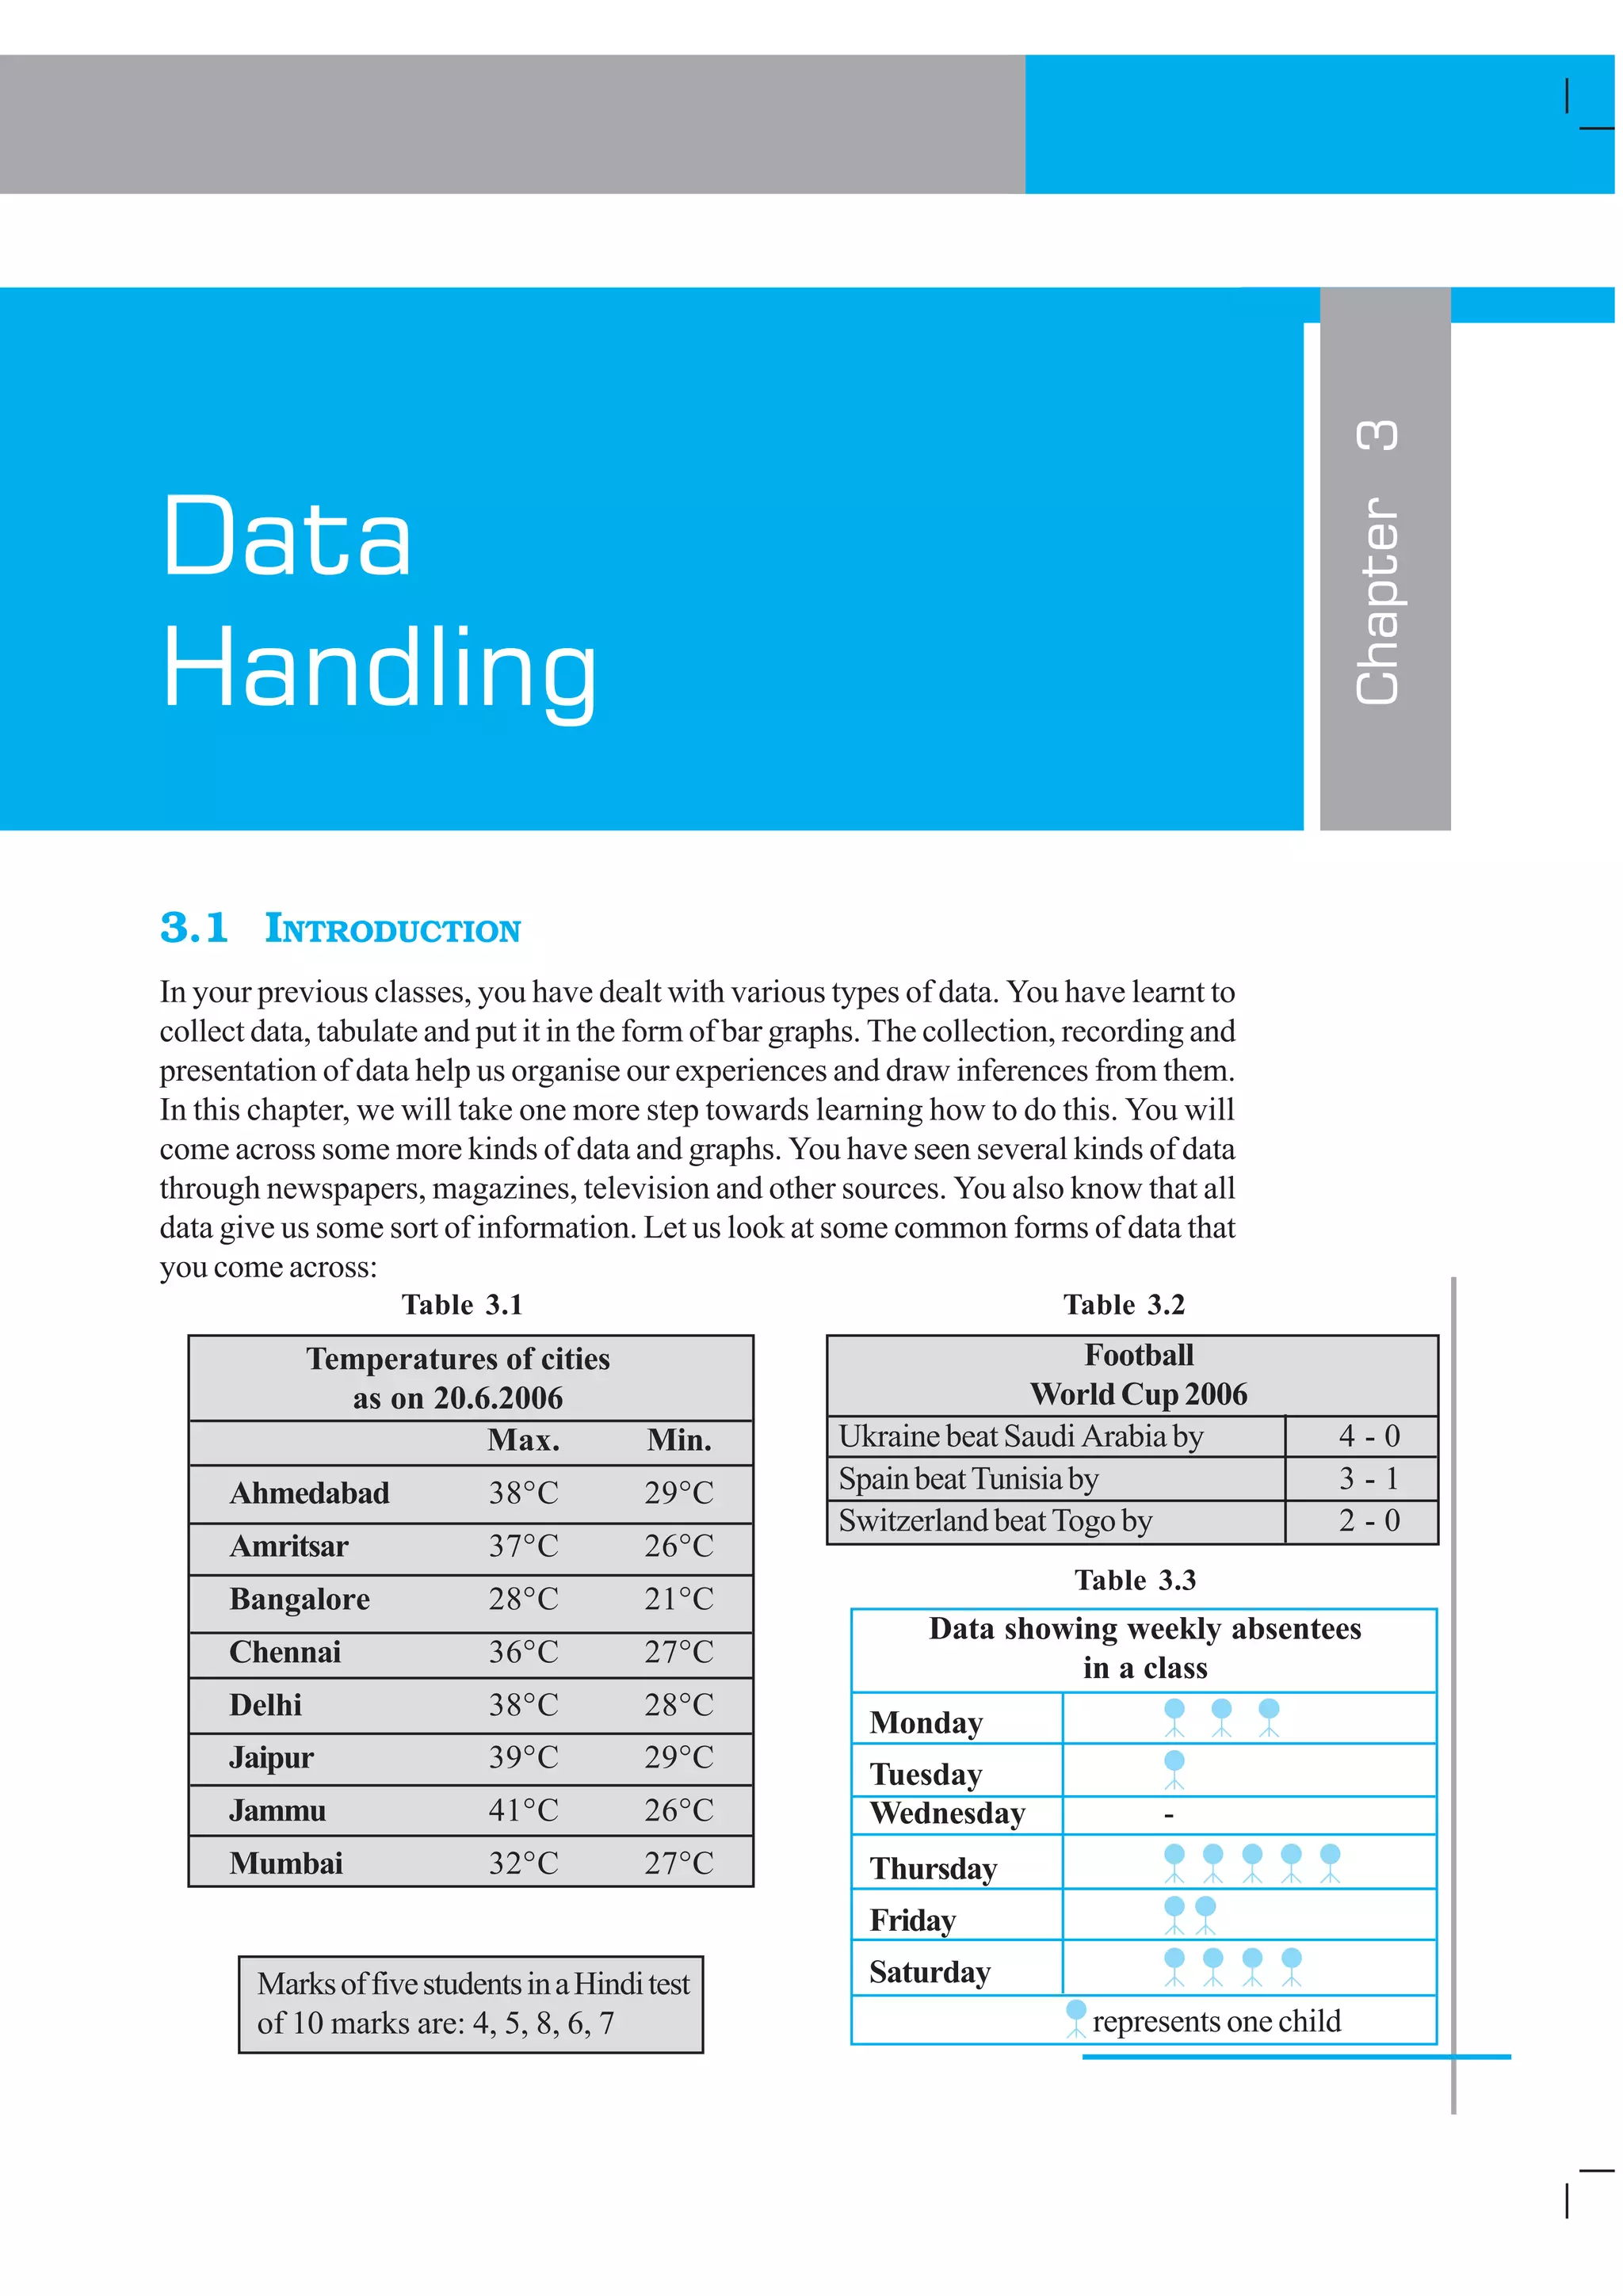
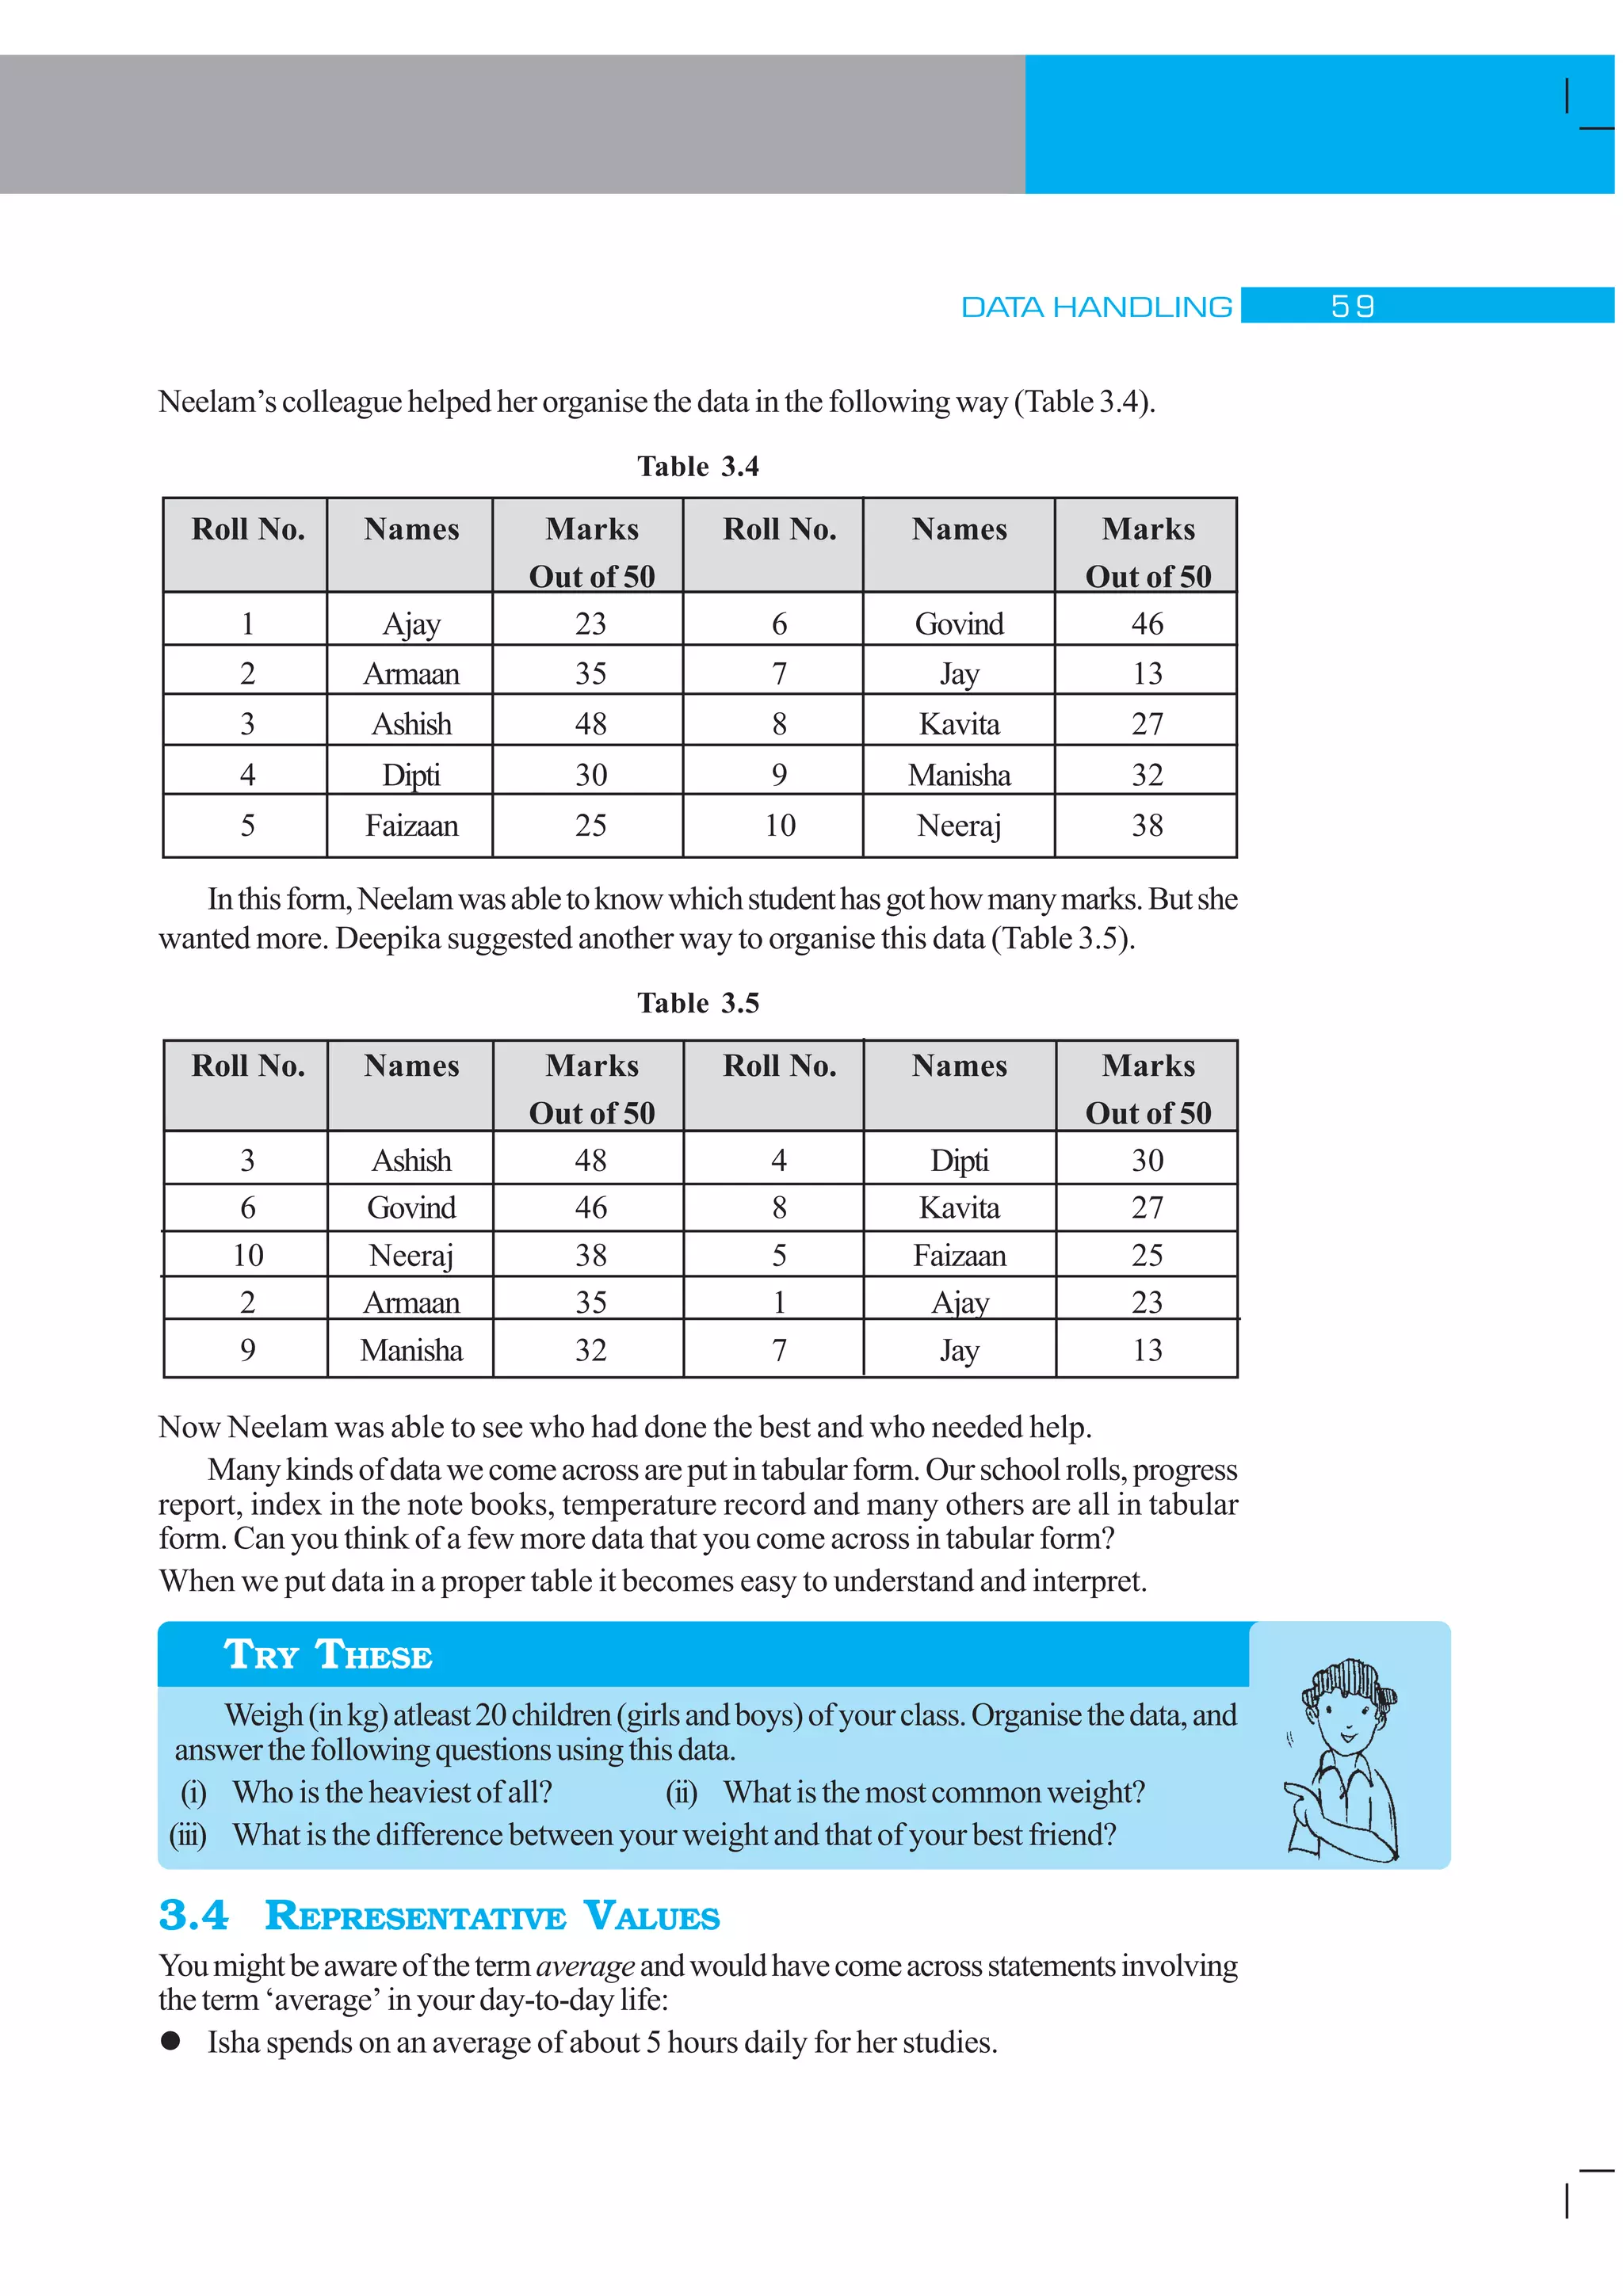
DATA HANDLING # %
3.1 INTRODUCTION
In your previous classes, you have dealt with various types of data. You have learnt to
collect data, tabulate and put it in the form of bar graphs. The collection, recording and
presentation of data help us organise our experiences and draw inferences from them.
In this chapter, we will take one more step towards learning how to do this. You will
come across some more kinds of data and graphs. You have seen several kinds of data
through newspapers, magazines, television and other sources. You also know that all
data give us some sort of information. Let us look at some common forms of data that
you come across:
Chapter3
Data
Handling
Temperatures of cities
as on 20.6.2006
Max. Min.
Ahmedabad 38°C 29°C
Amritsar 37°C 26°C
Bangalore 28°C 21°C
Chennai 36°C 27°C
Delhi 38°C 28°C
Jaipur 39°C 29°C
Jammu 41°C 26°C
Mumbai 32°C 27°C
Table 3.1
MarksoffivestudentsinaHinditest
of 10 marks are: 4, 5, 8, 6, 7
Table 3.2
Table 3.3
Football
World Cup 2006
Ukraine beat Saudi Arabia by 4 - 0
SpainbeatTunisiaby 3 - 1
Switzerland beat Togo by 2 - 0
Data showing weekly absentees
in a class
Monday
Tuesday
Wednesday -
Thursday
Friday
Saturday
represents one child
MATHEMATICS# &
What do these collections of data tell you?
For example you can say that the highest maximum temperature was in Jammu on
20.06.2006 (Table 3.1) or we can say that, on Wednesday, no child was absent.
(Table 3.3)
Can we organise and present these data in a different way, so that their analysis and
interpretation becomes better? We shall address such questions in this chapter.
3.2 COLLECTING DATA
Thedataaboutthetemperaturesofcities(Table3.1)cantellusmanythings,butitcannot
tellusthecitywhichhadthehighestmaximumtemperatureduringtheyear.Tofindthat,we
needtocollectdataregardingthehighestmaximumtemperaturereachedineachofthese
citiesduringtheyear.Inthatcase,thetemperaturechartofoneparticulardateoftheyear,
asgiveninTable3.1willnotbesufficient.
Thisshowsthatagivencollectionofdatamaynotgiveusaspecificinformationrelated
to that data. For this we need to collect data keeping in mind that specific information. In
the above case the specific information needed by us, was about the highest maximum
temperature of the cities during the year, which we could not get from Table 3.1
Thus, before collecting data, we need to know what we would use it for.
Givenbelowareafewsituations.
You want to study the
– PerformanceofyourclassinMathematics.
– PerformanceofIndiainfootballorincricket.
– Female literacy rate in a given area, or
– Numberofchildrenbelowtheageoffiveinthefamiliesaroundyou..
Whatkindofdatawouldyouneedintheabovesituations?Unlessanduntilyoucollect
appropriate data, you cannot know the desired information. What is the appropriate data
for each?
Discuss with your friends and identify the data you would need for each.
Some of this data is easy to collect and some difficult.
3.3 ORGANISATION OF DATA
When we collect data, we have to record and organise it. Why do we need to
dothat?Considerthefollowingexample.
Ms Neelam, class teacher wanted to find how children had performed
in English. She writes down the marks obtained by the students in the
followingway:
23, 35, 48, 30, 25, 46, 13, 27, 32, 38
In this form, the data was not easy to understand. She also did not know whether her
impressionofthestudentsmatchedtheirperformance.
DATA HANDLING # '
Neelam’scolleague helped her organise the data in the following way (Table 3.4).
Table 3.4
Roll No. Names Marks Roll No. Names Marks
Out of 50 Out of 50
1 Ajay 23 6 Govind 46
2 Armaan 35 7 Jay 13
3 Ashish 48 8 Kavita 27
4 Dipti 30 9 Manisha 32
5 Faizaan 25 10 Neeraj 38
Inthisform,Neelamwasabletoknowwhichstudenthasgothowmanymarks.Butshe
wanted more. Deepika suggested another way to organise this data (Table 3.5).
Table 3.5
Roll No. Names Marks Roll No. Names Marks
Out of 50 Out of 50
3 Ashish 48 4 Dipti 30
6 Govind 46 8 Kavita 27
10 Neeraj 38 5 Faizaan 25
2 Armaan 35 1 Ajay 23
9 Manisha 32 7 Jay 13
Now Neelam was able to see who had done the best and who needed help.
Manykindsofdatawecomeacrossareputintabularform.Ourschoolrolls,progress
report, index in the note books, temperature record and many others are all in tabular
form. Can you think of a few more data that you come across in tabular form?
When we put data in a proper table it becomes easy to understand and interpret.
Weigh(inkg)atleast20children(girlsandboys)ofyourclass.Organisethedata,and
answerthefollowingquestionsusingthisdata.
(i) Whoistheheaviestofall? (ii) Whatisthemostcommonweight?
(iii) What is the difference between your weight and that of your best friend?
3.4 REPRESENTATIVE VALUES
Youmightbeawareofthetermaverageandwouldhavecomeacrossstatementsinvolving
theterm‘average’inyourday-to-daylife:
l Isha spends on an average of about 5 hours daily for her studies.
TRY THESE
MATHEMATICS$ 
l The average temperature at this time of the year is about 40 degree Celsius.
l The average age of pupils in my class is 12 years.
l The average attendance of students in a school during its final examination was
98 per cent.
Manymoreofsuchstatementscouldbethere.Thinkaboutthestatementsgivenabove.
Doyouthinkthatthechildinthefirststatementstudiesexactlyfor5hoursdaily?
Or,isthetemperatureofthegivenplaceduringthatparticulartimealways40degrees?
Or, is the age of each pupil in that class 12 years? Obviously not.
Then what do these statements tell you?
By average we understand that Isha, usually, studies for 5 hours. On some days,
she may study for less number of hours and on the other days she may study longer.
Similarly, the average temperature of 40 degree celsius, means that, very often,
thetemperatureatthistimeoftheyearisaround40degreecelsius.Sometimes,itmay
be less than 40 degree celsius and at other times, it may be more than 40°C.
Thus,werealisethataverageisanumberthatrepresentsorshowsthecentraltendency
of a group of observations or data. Since average lies between the highest and the lowest
valueofthegivendataso,wesayaverageisameasureofthecentraltendencyofthegroup
of data. Different forms of data need different forms of representative or central value to
describe it. One of these representative values is the “Arithmetic Mean”. You will learn
about the other representative values in the later of the chapter.
3.5 ARITHMETIC MEAN
The most common representative value of a group of data is the arithmetic mean or the
mean.To understand this in a better way, let us look at the following example:
Twovesselscontain20litresand60litresofmilkrespectively.Whatistheamountthat
eachvesselwouldhave,if bothsharethemilkequally?Whenweaskthisquestionweare
seekingthearithmeticmean.
In the above case, the average or the arithmetic mean would be
Total quantity of milk
Number of vessels
=
20 60
2
+
litres = 40 litres.
Thus,eachvesselswouldhave 40litresof milk.
TheaverageorArithmeticmean(A.M.)orsimplymeanisdefinedasfollows:
mean =
Sum of all observations
number of observations
Consider these examples.
EXAMPLE 1 Ashish studies for 4 hours, 5 hours and 3 hours respectively on three
consecutive days. How many hours does he study daily on an average?
DATA HANDLING $ 
SOLUTION TheaveragestudytimeofAshishwouldbe
Total number of study hours
Number of days for which he studdied
=
4 5 3
3
+ +
hours = 4 hours per day
Thus, we can say that Ashish studies for 4 hours daily on an average.
EXAMPLE 2 Abatsmanscoredthefollowingnumberofrunsinsixinnings:
36, 35, 50, 46, 60, 55
Calculatethemeanrunsscoredbyhiminaninning.
SOLUTION Total runs = 36 + 35 + 50 + 46 + 60 + 55 = 282.
Tofindthemean,wefindthesumofalltheobservationsanddivideitbythenumberof
observations.
Therefore,inthiscase,mean=
282
6
=47.Thus,themeanrunsscoredinaninningare47.
Where does the arithmetic mean lie
TRY THESE
How would you find the average of your study hours for the whole week?
THINK, DISCUSS AND WRITE
Considerthedataintheaboveexamplesandthinkonthefollowing:
l Is the mean bigger than each of the observations?
l Isitsmallerthaneachobservation?
Discuss with your friends. Frame one more example of this type and answer the
samequestions.
Youwillfindthatthemeanliesinbetweenthegreatestandthesmallestobservations.
In particular, the mean of two numbers will always lie between the two numbers.
For example the mean of 5 and 11 is
5 11
2
8
+
= , which lies between 5 and 11.
Can you use this idea to show that between any two fractional numbers, you can find
as many fractional numbers as you like. For example between
1
2
and
1
4
you have their
average
1
2
1
4
2
+
=
3
8
and then between
1
2
and
3
8
, you have their average
7
16
and so on.
1. Find the mean of your sleeping hours during one week.
2. Find atleast 5 numbers between
1
2
and
1
3
.
TRY THESE
MATHEMATICS$
3.5.1 Range
The difference between the highest and the lowest observation gives us an idea of the
spread of the observations. This can be found by subtracting the lowest observation from
the highest observation. We call the result the range of the observation. Look at the
followingexample:
EXAMPLE 3 The ages in years of 10 teachers of a school are:
32, 41, 28, 54, 35, 26, 23, 33, 38, 40
(i) What is the age of the oldest teacher and that of the youngest teacher?
(ii) What is the range of the ages of the teachers?
(iii) What is the mean age of these teachers?
SOLUTION
(i) Arrangingtheagesinascendingorder,weget:
23, 26, 28, 32, 33, 35, 38, 40, 41, 54
We find that the age of the oldest teacher is 54 years and the age of the youngest
teacher is 23 years.
(ii) Range of the ages of the teachers = (54 – 23) years = 31 years
(iii) Mean age of the teachers
=
23 26 28 32 33 35 38 40 41 54
10
+ + + + + + + + +
years
=
350
10
years = 35 years
EXERCISE 3.1
1. Find the range of heights of any ten students of your class.
2. Organisethefollowingmarksinaclassassessment,inatabularform.
4 6 7 5 3 5 4 5 2 6
2 5 1 9 6 5 8 4 6 7
(i) Whichnumber isthehighest? (ii) Whichnumberisthelowest?
(iii) What is the range of the data? (iv) Findthearithmeticmean.
3. Findthemeanofthefirstfivewholenumbers.
4. Acricketerscoresthefollowingrunsineightinnings:
58, 76, 40, 35, 46, 45, 0, 100.
Find the mean score.
DATA HANDLING $ !
5. Following table shows the points of each player scored in four games:
Player Game Game Game Game
1 2 3 4
A 14 16 10 10
B 0 8 6 4
C 8 11 Didnot 13
Play
Nowanswerthefollowingquestions:
(i) Find the mean to determine A’s average number of points scored per game.
(ii) To find the mean number of points per game for C, would you divide the total
points by 3 or by 4? Why?
(iii) Bplayed in all the four games. How would you find the mean?
(iv) Who is the best performer?
6. The marks (out of 100) obtained by a group of students in a science test are 85, 76,
90, 85, 39, 48, 56, 95, 81 and 75. Find the:
(i) Highest and the lowest marks obtained by the students.
(ii) Range of the marks obtained.
(iii) Mean marks obtained by the group.
7. Theenrolmentinaschoolduringsixconsecutiveyearswasasfollows:
1555, 1670, 1750, 2013, 2540, 2820
Find the mean enrolment of the school for this period.
8. The rainfall (in mm) in a city on 7 days of a certain week was recorded as follows:
Day Mon Tue Wed Thurs Fri Sat Sun
Rainfall 0.0 12.2 2.1 0.0 20.5 5.5 1.0
(inmm)
(i) Find the range of the rainfall in the above data.
(ii) Findthemeanrainfallfortheweek.
(iii) Onhowmanydayswastherainfalllessthanthemeanrainfall.
9. The heights of 10 girls were measured in cm and the results are as follows:
135, 150, 139, 128, 151, 132, 146, 149, 143, 141.
(i) Whatistheheightofthetallestgirl? (ii) Whatistheheightoftheshortestgirl?
(iii) What is the range of the data? (iv) Whatisthemeanheightofthegirls?
(v) Howmanygirlshaveheightsmorethanthemeanheight.
MATHEMATICS$ 
3.6 MODE
As we have said Mean is not the only measure of Central tendency or the only form of
representative value. For different requirements from a data other measures of Central
tendencies are used.
Look at the following example
Tofindouttheweeklydemandfordifferentsizesofshirt,ashopkeeperkeptrecordsofsales
of sizes 90 cm, 95 cm, 100 cm, 105 cm, 110 cm.. Following is the record for a week:
Size (in inches) 90 cm 95 cm 100 cm 105 cm 110 cm Total
Number of shirts sold 8 22 32 37 6 105
If he found the mean number of shirts sold, do you think that he would be able to
decide which shirt sizes to keep in stock?
Mean of total shirts sold =
Total number of shirts sold
Number of different sizes of shiirts
= =
105
5
21
Should he obtain 21 shirts of each size? If he does so, will he be able to cater to the
needs of the customers?
The shopkeeper, on looking at the record, decides to procure shirts of sizes 95cm,
100cm, 105cm. He decided to postpone the procurement of the shirts of other sizes
becauseoftheirsmallnumberofbuyers.
Look at another example
The owner of a readymade dress shop says, “The most popular size of dress I sell is the
size90cm.
Observe that here also, the owner is concerned about the number
of shirts of different sizes sold. She is however looking at the shirt size
that is sold the most. This is another representative value for the data.
Thehighestoccuringeventisthesaleofsize90cm.Thisrepresentative
value is called the mode of the data.
The mode of a set of observations is the observation that occurs
most often.
EXAMPLE 4 Find the mode of the given set of numbers: 1, 1, 2, 4, 3, 2, 1, 2, 2, 4
SOLUTION Arrangingthenumberswithsamevaluestogether,weget
1, 1, 1, 2, 2, 2, 2, 3, 4, 4
Mode of this data is 2 because it occurs more frequently than other observations.
3.6.1 Mode of Large Data
Putting the same observations together and counting them is not easy if the number of
observations is large. In such cases we tabulate the data. Tabulation can begin by putting
tallymarksandfindingthefrequency,asyoudidinyourpreviousclass.
DATA HANDLING $ #
Lookatthefollowingexample:
EXAMPLE 5 Followingarethemarginsofvictoryinthefootball
matches of a league.
1, 3, 2, 5, 1, 4, 6, 2, 5, 2, 2, 2, 4, 1, 2, 3, 1, 1, 2, 3, 2,
6, 4, 3, 2, 1, 1, 4, 2, 1, 5, 3, 3, 2, 3, 2, 4, 2, 1, 2
Find the mode of this data.
SOLUTION Let us put the data in a tabular form:
Margins of victory Tallybars Number of matches
1 9
2 14
3 7
4 5
5 3
6 2
Total 40
Looking at the table, we can quickly say that 2 is the ‘mode’ since 2 has occured the
highestnumberoftimes.Thus,mostofthematcheshavebeenwonwithavictorymargin
of 2 goals.
THINK, DISCUSS AND WRITE
Can a set of numbers have more than one mode?
EXAMPLE 6 Find the mode of the numbers: 2, 2, 2, 3, 3, 4, 5, 5, 5, 6, 6, 8
SOLUTION Here, 2 and 5 both occur three times. Therefore, they both are modes of
the data.
1. Rec ordtheageinyearsofallyourclassmates.Tabulatethedataandfindthemode.
2. Record the heights in centimetres of your classmates and find the mode.
1. Findthemodeofthefollowingdata:
12, 14, 12, 16, 15, 13, 14, 18, 19, 12, 14, 15, 16, 15, 16, 16, 15,
17, 13, 16, 16, 15, 15, 13, 15, 17, 15, 14, 15, 13, 15, 14
Find the mode of
(i) 2, 6, 5, 3, 0, 3, 4, 3, 2, 4, 5,
2, 4,
(ii) 2, 14, 16, 12, 14, 14, 16,
14, 10, 14, 18, 14
TRY THESE
DO THIS
TRY THESE
MATHEMATICS$ $
2. Heights(incm)of25childrenaregivenbelow:
168, 165, 163, 160, 163, 161, 162, 164, 163, 162, 164, 163, 160, 163, 16, 165,
163, 162, 163, 164, 163, 160, 165, 163, 162
What is the mode of their heights? What do we understand by Mode here?
Whereasmeangivesustheaverageofallobservationsofthedata,themodegivesthat
observationwhichoccursmostfrequentlyinthedata.
Letusconsiderthefollowingexamples:
(a) You have to decide upon the number of chapattis needed for 25 people called for a
feast.
(b) A shopkeeper selling shirts has decided to replenish her stock.
(c) We need to find the height of the door needed in our house.
(d) When going on a picnic, if only one fruit can be bought for everyone, which is the
fruitthatwewouldget.
In which of these situations can we use the mode as a good estimate?
Considerthefirststatement.Supposethenumberofchapattisneededbyeachperson
is 2, 3, 2, 3, 2, 1, 2, 3, 2, 2, 4, 2, 2, 3, 2, 4, 4, 2, 3, 2, 4, 2, 4, 3, 5
Themodeofthedatais2chapattis.Ifweusemodeastherepresentativevalueforthis
data, then we need 50 chapattis only, 2 for each of the 25 persons. However the total
numberwouldclearlybeinadequate.Wouldmeanbeanappropriaterepresentativevalue?
For the third statement the height of the door is related to the height of the persons
usingthatdoor.Supposethereare5childrenand4adultsusingthedoorandtheheightof
each of 5 children is around 135 cm. The mode for the heights is 135
cm. Should we get a door that is 144 cm high? Would all the adults be
abletogothroughthatdoor?Itisclearthatmodeisnottheappropriate
representative value for this data. Would mean be an appropriate
representativevaluehere?
Why not? Which representative value of height should be used to
decidethedoorheight?
Similarlyanalysetherestofthestatementsandfindtherepresentative
valueusefulforthatissue.
Discusswithyourfriendsandgive
(a) Two situations where mean would be an appropriate representative value to
use, and
(b) Twosituationswheremodewouldbe andappropriaterepresentativevaluetouse.
TRY THESE
DATA HANDLING $ %
3.7 MEDIAN
Wehaveseenthatinsomesituations,arithmeticmeanisanappropriatemeasureofcentral
tendency whereas in some other situations, mode is the appropriate measure of central
tendency.
Let us now look at another example. Consider a group of 17 students with the following
heights (in cm): 106, 110, 123, 125, 117, 120, 112, 115, 110, 120, 115, 102, 115, 115,
109, 115, 101.
The games teacher wants to divide the class into two groups so that each group has
equalnumberofstudents,onegrouphasstudentswithheightlesserthanaparticularheight
andtheothergrouphasstudentwithheightsgreaterthantheparticularheight.Howwould
she do that?
Let us see the various options she has:
(i) She can find the mean. The mean is
Yourfriendfoundthemedianandthe
mode of a given data. Describe and
correctyourfriendserrorifany:
35, 32, 35, 42, 38, 32, 34
Median = 42, Mode = 32
TRY THESE
= =
1930
17
113 5.
106 110 123 125 117 120 112 115 110 120 115 102 115 115 10+ + + + + + + + + + + + + + 99 115 101
17
+ +
So,iftheteacherdividesthestudentsintotwogroupsonthebasisofthismeanheight,
such that one group has students of height less than the mean height and the other group
hasstudentswithheightmorethanthemeanheight,thenthegroupswouldbeofunequal
size. They would have 7 and 10 members respectively.
(ii) Thesecondoptionforheristofindmode.Theobservationwithhighestfrequencyis
115 cm, which would be taken as mode.
There are 7 children below the mode and 10 children at the mode and above the
mode. Therefore, we cannot divide the group into equal parts.
Let us therefore think of an alternative representative value or measure of central
tendency. For doing this we again look at the given heights (in cm) of students arrange
theminascendingorder.Wehavethefollowingobservations:
101, 102, 106, 109, 110, 110, 112, 115, 115, 115, 115, 115, 117, 120, 120, 123, 125
The middle value in this data is 115 because this value divides the students into two
equal groups of 8 students each. This value is called as Median. Median refers to the
value which lies in the middle of the data (when arranged in an
increasing or decreasing order) with half of the observations
above it and the other half below it. The games teacher decides
to keep the middle student as a refree in the game.
Here, we consider only those cases where number of
observations is odd.
Thus, in a given data, arranged in ascending or descending
order, the median gives us the middle observation.
MATHEMATICS$ 
Note that in general, we may not get the same value for median and mode.
Thuswerealisethatmean,modeandmedianarethenumbersthataretherepresentative
values of a group of observations or data. They lie between the minimum and maximum
values of the data. They are also called the measures of the central tendency.
EXAMPLE 7 Find the median of the data: 24, 36, 46, 17, 18, 25, 35
SOLUTION We arrange the data in ascending order, we get 17, 18, 24, 25, 35, 36, 46
Median is the middle observation. Therefore 25 is the median.
EXERCISE 3.2
1. The scores in mathematics test (out of 25) of 15 students is as follows:
19, 25, 23, 20, 9, 20, 15, 10, 5, 16, 25, 20, 24, 12, 20
Find the mode and median of this data. Are they same?
2. The runs scored in a cricket match by 11 players is as follows:
6, 15, 120, 50, 100, 80, 10, 15, 8, 10, 15
Find the mean, mode and median of this data. Are the three same?
3. The weights (in kg.) of 15 students of a class are:
38, 42, 35, 37, 45, 50, 32, 43, 43, 40, 36, 38, 43, 38, 47
(i) Find the mode and median of this data.
(ii) Is there more than one mode?
4. Find the mode and median of the data: 13, 16, 12, 14, 19, 12, 14, 13, 14
5. Tellwhetherthestatementistrueorfalse:
(i) The mode is always one of the numbers in a data.
(ii) The mean can be one of the numbers in a data.
(iii) The median is always one of the numbers in a data.
(iv) A data always has a mode.
(v) The data 6, 4, 3, 8, 9, 12, 13, 9 has mean 9.
3.8 USE OF BAR GRAPHS WITH A DIFFERENT PURPOSE
We have seen last year how information collected could be first arranged in a frequency
distribution table and then this information could be put as a visual representation in the
form of pictographs or bar graphs. You can look at the bar graphs and make deductions
aboutthedata.Youcanalsogetinformationbasedonthesebargraphs.Forexample,you
can say that the mode is the longest bar if the bar represents the frequency.
3.8.1 Choosing a Scale
We know that a bar graph is a representation of numbers using bars of uniform width and
the lengths of the bars depend upon the frequency and the scale you have chosen. For
example,inabargraphwherenumbersinunitsaretobeshown,thegraphrepresentsone
unitlengthforoneobservationandifithastoshownumbersintensorhundreds,oneunit
length can represent 10 or 100 observations. Consider the following examples:
DATA HANDLING $ '
EXAMPLE 8 Twohundredstudentsof6th
and7th
classwereaskedtonametheirfavourite
colour so as to decide upon what should be the colour of their School
Building.Theresultsareshowninthefollowingtable.Representthegiven
data on a bar graph.
FavouriteColour Red Green Blue Yellow Orange
Number of Students 43 19 55 49 34
Answerthefollowingquestionswiththehelpofthebargraph:
(i) Which is the most preferred colour and which is the least preferred?
(ii) Howmanycoloursarethereinall?Whatare
they?
SOLUTION Choose a suitable scale as follows:
Startthescaleat0.Thegreatestvalueinthedatais
55, so end the scale at a value greater than 55,
suchas60.Useequaldivisionsalongtheaxes,such
as increments of 10. You know that all the bars
would lie between 0 and 60. We choose the scale
such that the length between 0 and 60 is neither
too long nor too small. Here we take 1 unit for 10
students.
We then draw and label the graph as shown.
From the bar graph we conclude that
(i) Blue is the most preferred colour (Because the bar representing Blue is the tallest).
(ii) Green is the least preferred colour. (Because the bar representing Green is the
shortest).
(iii) There are five colours. They are Red, Green, Blue, Yellow and Orange. (These are
observedonthehorizontalline)
EXAMPLE 9 Following data gives total marks (out of 600) obtained by six children of
a particular class. Represent the data on a bar graph.
Students Ajay Bali Dipti Faiyaz Geetika Hari
Marks Obtained 450 500 300 360 400 540
SOLUTION
(i) To choose an appropriate scale we make equal divisions taking increments of 100.
Thus1unitwillrepresent100marks.(Whatwouldbethedifficultyifwechooseone
unit to represent 10 marks?)
Scale : 1 unit = 10 students
0
10
20
30
40
50
60
Red
Green
Blue
Yellow
Orange
Students
MATHEMATICS% 
0
100
200
300
400
500
600
Ajay
Bali
Dipti
Faiyaz
Geetika
Marksoutof600
Hari
Students
Scale : 1 unit = 100 marks
(ii) Now represent the data on the bar graph.
Drawing Double Bar Graph
Considerthefollowingtwocollectionsdatagivingtheaveragedailyhoursofsunshinein
two cities Aberdeen and Margate for all the twelve months of the year. These cities are
near the south pole and hence have only a few hourse of sunshine each day.
In Margate
Jan Feb Mar April May June July Aug Sept. Oct. Nov. Dec.
Average
hours of 2 4 4 8 7 6 4 2
Sunshine
In Aberdeen
Average
hours of 3 6 5 4 3
Sunshine
Bydrawingindividualbargraphsyoucouldanswerquestionslike
(i) Inwhichmonthdoeseachcityhasmaximumsunlight? or
(ii) Inwhichmonthsdoeseachcityhasminimumsunlight?
However,toanswerquestionslike“Inaparticularmonth,whichcityhasmoresunshine
hours”,weneedtocomparetheaveragehoursofsunshineofboththecities.Todothiswe
will learn to draw what is called a double bar graph giving the information of both cities
side by side.
This bar graph (Fig 3.1) shows the average sunshine of both the cities.
For each month we have two bars, the heights of which give the average hours of
sunshine in each city. From this we can infer that except for the month of April, there is
alwaysmoresunshineinMargatethaninAberdeen.Youcouldputtogetherasimiliarbar
graph for your area or for your city.
1
3
4
3
7
4
1
7
2
1
6
4
1
1
2
1
3
2
1
5
2
1
5
2
1
6
2
1
4
2
3
1
4
DATA HANDLING % 
Let us look at another example more related to us.
EXAMPLE 10 Amathematicsteacherwantstosee,whetherthenewtechniqueofteach-
ing she applied after quarterly test was effective or not. She takes the
scores of the 5 weakest children in the quarterly test (out of 25) and in
the half yearly test (out of 25):
Students Ashish Arun Kavish Maya Rita
Quarterly 10 15 12 20 9
Half yearly 15 18 16 21 15
SOLUTION Since there seems to be a marked improvement in most of
thestudents,theteacherdecidesthatsheshouldcontinueto
usethenewtechniqueofteaching.
Can you think of a few more situtions where you could use double
bar graphs?
1. The bar chart (Fig 3.2) shows the result of a survey to test water resistant watches
madebydifferentcompanies.
Each of these companies claimed that their watches were water resistant. After a
test the above results were revealed.
0
2
Jan
Feb.
March
April
May
Scale : 1 unit = 1 hour of sunshine
4
6
8
June
July
August
Sept.
Oct.
Nov.
Dec.
Aberdeen
Margate
Houseofsunshine
Fig 3.1
TRY THESE
MATHEMATICS%
(a) Can you work a fraction of the number of watches that
leaked to the number tested for each company?
(b) Could you tell on this basis which company has better
watches?
2. Sale of English and Hindi books in the years 1995, 1996,
1997 and 1998 are given below:
Fig 3.2
1995 1996 1997 1998
English 350 400 450 620
Hindi 500 525 600 650
Drawadoublebargraphandanswerthefollowingquestions:
(a) In which year was the difference in the sale of the two
language books least?.
(b) Can you say that the demand for English books rose
faster?Justify.
EXERCISE 3.3
1. Use the bar graph (Fig 3.3) to answer the following questions.
(a) Which is the most popular pet? (b) Howmanychildrenhavedogasapet?
Fig 3.3
2. Read the bar graph (Fig 3.4) and answer the questions that follow:
Number of books sold by a bookstore during five consecutive years.
(i) About how many books were sold in 1989? 1990? 1992?
(ii) In which year were about 475 books sold? About 225 books sold?
Fig 3.4
Scale : 1cm = 100 books
DATA HANDLING % !
(iii) In which years were fewer than 250 books sold?
(iv) Can you explain how you would estimate the number of books sold in 1989?
3. Number of children in six different classes are given below. Represent the data on a
bar graph.
Class Fifth Sixth Seventh Eighth Ninth Tenth
NumberofChildren 135 120 95 100 90 80
(a) How would you choose a scale.
(b) Answerthefollowingquestions:
(i) Whichclasshasthemaximumnumberofchildren?Andtheminimum?
(ii) Find the ratio of students of class sixth to the students of class eight.
4. The performance of students in 1st
Term and 2nd
Term is given. Draw a double bar
graphchoosingappropriatescaleandanswerthefollowing:
Subject English Hindi Maths Science S. Science
1st
Term (M.M. 100) 67 72 88 81 73
2nd
Term (M.M. 100) 70 65 95 85 75
(i) Inwhichsubject,hasthechildimprovedhisperformancethemost?
(ii) Inwhichsubjectistheimprovementtheleast?
(iii) Has the performance gone down in any subject?.
5. Consider this data collected from a survey of a colony.
Favourite Sport Cricket Basket Ball Swimming Hockey Athletics
Watching 1240 470 510 423 250
Participating 620 320 320 250 105
(i) Draw a double bar graph choosing an appropriate scale.
What do you infer from the bar graph?
(ii) Which sport is most popular?
(iii) Whichismorepreferred,watchingorparticipatinginsports?
6. Take the data giving the minimum and the maximum temperature of various cities
given in the beginning of this chapter (Table 3.1). Plot a double bar graph using the
dataandanswerthefollowing:
(i) Whichcityhasthelargestdifferenceintheminimumandmaximumtemperature
on the given date?
(ii) Which is the hottest city and which is the coldest city?
(iii) Nametwocitieswheremaximumtemperatureofonewaslessthantheminimum
temperature of the other.
(iv) Name the city which has the least difference between its minimum and the
maximumtemperature.
MATHEMATICS% 
3.9 CHANCE AND PROBABILITY
These words often come up in our daily life. We often say, “there is no chance of it
raining today” and also say things like “it is quite probable that India will win the
WorldCup.”Letustryandunderstandthesetermsabitmore.Considerthestatements;
(i) The Sun coming up from the West (ii) Anantgrowingto3mheight.
(iii) If you take a cube of larger volume its side will also be larger.
(iv) If you take a circle with larger area then it’s radius will also be larger.
(v) Indiawinningthenexttestseries.
If welookatthestatementsgivenaboveyouwouldsaythattheSuncomingupfrom
theWestisimpossible,anantgrowingto3m isalsonotpossible.Ontheotherhandif
thecircleisofalargerareaitiscertainthatitwillhavealargerradius.Youcansaythesame
aboutthelargervolumeof thecubeandthelargerside.OntheotherhandIndiacanwin
thenexttestseriesorloseit.Botharepossible.
3.9.1 Chance
If you toss a coin, can you always correctly predict what you will get? Try tossing
a coin and predicting the outcome each time. Write your observations in the
followingtable:
Toss number Prediction Outcome
Do this 10 times. Look at the observed outcomes. Can you see a pattern in
them? What do you get after each head? Is it that you get head all the time? Repeat the
observation for another 10 tosses and write the observations in the table.
You will find that the observations show no clear pattern. In the table below we give
you observations generated in 25 tosses by Sushila and Salma. Here H represents Head
and T represents Tail.
No. 1 2 3 4 5 6 7 8 9 10 11 12 13 14 15
Outcome H T T H T T T H T T H H H H H
No. 16 17 18 19 20 21 22 23 24 25
Outcome T T H T T T T T T T
What does this data tell you? Can you find a predictable pattern for head and tail?
Clearly there is no fixed pattern of occurrence of head and tail. When you throw the coin
each time the outcome of every throw can be either head or tail. It is a matter of chance
that in one particular throw you get either of these.
In the above data, count the number of heads and the number of tails. Throw the coin
somemoretimesandkeeprecordingwhatyouobtain.Findoutthe totalnumber of times
you get a head and the total number of times you get a tail.
You also might have played with a die. The die has six faces. When you throw a die, can
you predict the number that will be obtained? While playing Ludo or Snake and ladders
you may have often wished that in a throw you get a particular outcome.
Think of
some
situations,
atleast 3
examples of
each, that are
certain to
happen, some
that are
impossible
and some that
may or may
not happen
i.e., situations
thathave
some chance
of happening.
TRY THESE
DATA HANDLING % #
|||| |||| |||| |||| |||| |||||||
|||| |||| |||| |||| |||| |||| |||| |||||
|||| |||| |||| |||| |||| |||| |||| |||| ||||||
|||| |||| |||| |||| ||||| |||| |||| |||| |||| ||||||
|||| |||| |||| |||| |||| |||| |||||||
||||| |||| |||| |||| |||| |||| |||| ||||
Does the die always fall according to your wishes? Take a die and throw it 150
timesandfillthedatainthefollowingtable:
Number on Die Tally Marks Number of times it occured
1
2
Makeatallymarkeachtimeyougettheoutcome,againsttheappropriatenumber.
Forexampleinthefirstthrowyouget5.Putatallyinfrontof5.Thenextthrowgivesyou
1. Make a tally for 1. Keep on putting tally marks for the appropriate number. Repeat
this exercise for 150 throws and find out the number of each outcome for 150 throws.
Make bar graph using the above data showing the number of times 1, 2, 3, 4, 5, 6
have occured in the data.
(Do in a group)
1. Tossacoin100timesandrecordthedata.Findthenumberoftimesheadsandtails
occurinit.
2. Aftaabthrewadie250timesandgotthefollowingtable.Drawabargraphforthisdata.
Number on the Die Tally Marks
1
2
3
4
5
6
3. Throw a die 100 times and record the data. Find the number of times 1, 2, 3, 4, 5,
6 occur.
What is probability?
We knowthatwhenacoinisthrown,ithastwopossibleoutcomes,Head orTailandfor
adiewehave6possibleoutcomes.We alsoknowfromexperience thatfor a coin,Head
orTailisequallylikelytobeobtained.WesaythattheprobabilityofgettingHeadorTail
is equal and is
1
2
for each.
For a die, possibility of getting either of 1, 2, 3, 4, 5 or 6 is equal. That is for a die
there are 6 equally likely possible outcomes. We say each of 1, 2, 3, 4, 5, 6 has one-
sixth(
1
6
)probability.Wewilllearnaboutthisinthelaterclasses.Butfromwhatwehave
done,itmayperhapsbeobviousthateventsthathavemanypossibilitiescanhaveprobability
TRY THESE
MATHEMATICS% $
between 0 and 1. Those which have no chance of happening have probability 0 and
those that are bound to happen have probability 1.
Given any situation we need to understand the different possible outcomes
and study the possible chances for each outcome. It may be possible that the
outcomes may not have equal chance of occuring unlike the cases of the coin and
die. For example if a container has 5 red balls and 9 white balls and if a ball is
pulled out without seeing, the chances of getting a red ball are much more. Can
you see why? How many times are the chances of getting a red ball than getting
a white ball, probabilities for both being between 0 and 1.
EXERCISE 3.4
1. Tellwhetherthefollowingiscertaintohappen,impossible,canhappenbutnotcertain.
(i) You are older today than yesterday. (ii) Atossedcoinwilllandheadsup.
(iii) A die when tossed shall land up with 8 on top.
(iv) Thenexttrafficlightseenwillbegreen. (v) Tomorrow will be a cloudy day.
2. There are 6 marbles in a box with numbers from 1 to 6 marked on each of them.
(i) Whatistheprobabilityofdrawingamarblewithnumber2?
(ii) Whatistheprobabilityofdrawingamarblewithnumber5?
3. A coin is flipped to decide which team starts the game. What is the probability that
yourteamwillstart?
4. A box contains pairs of socks of two colours (black and white). I have picked out a
white sock. I pick out one more with my eyes closed. What is the probability that it
willmakeapair?
WHAT HAVE WE DISCUSSED?
1. The collection, recording and presentation of data help us organise our experiences
anddrawinferencesfromthem.
2. Before collecting data we need to know what we would use it for.
3. The data that is collected needs to be organised in a proper table, so that it becomes
easy to understand and interpret.
4. Average is a number that represents or shows the central tendency of a group of
observations or data.
5. Arithmeticmeanisoneoftherepresentativevaluesofdata.
6. Modeisanotherformofcentraltendencyorrepresentativevalue.Themodeofaset
of observations is the observation that occurs most often.
7. Median is also a form of representative value. It refers to the value which lies in the
middle of the data with half of the observations above it and the other half below it.
8. Abargraphisarepresentationofnumbersusingbarsofuniformwidths.
9. Double bar graphs help to compare two collections of data at a glance.
10. There are situations in our life, that are certain to happen, some that are impossible
andsomethatmayormaynothappen.Thesituationthatmayormaynothappenhas
achanceofhappening.
Construct or
thinkoffive
situationswhere
outcomes do not
haveequal
chances.
TRY THESE

Ch 3 data handling

  • 1.
    DATA HANDLING #% 3.1 INTRODUCTION In your previous classes, you have dealt with various types of data. You have learnt to collect data, tabulate and put it in the form of bar graphs. The collection, recording and presentation of data help us organise our experiences and draw inferences from them. In this chapter, we will take one more step towards learning how to do this. You will come across some more kinds of data and graphs. You have seen several kinds of data through newspapers, magazines, television and other sources. You also know that all data give us some sort of information. Let us look at some common forms of data that you come across: Chapter3 Data Handling Temperatures of cities as on 20.6.2006 Max. Min. Ahmedabad 38°C 29°C Amritsar 37°C 26°C Bangalore 28°C 21°C Chennai 36°C 27°C Delhi 38°C 28°C Jaipur 39°C 29°C Jammu 41°C 26°C Mumbai 32°C 27°C Table 3.1 MarksoffivestudentsinaHinditest of 10 marks are: 4, 5, 8, 6, 7 Table 3.2 Table 3.3 Football World Cup 2006 Ukraine beat Saudi Arabia by 4 - 0 SpainbeatTunisiaby 3 - 1 Switzerland beat Togo by 2 - 0 Data showing weekly absentees in a class Monday Tuesday Wednesday - Thursday Friday Saturday represents one child
  • 2.
    MATHEMATICS# & What dothese collections of data tell you? For example you can say that the highest maximum temperature was in Jammu on 20.06.2006 (Table 3.1) or we can say that, on Wednesday, no child was absent. (Table 3.3) Can we organise and present these data in a different way, so that their analysis and interpretation becomes better? We shall address such questions in this chapter. 3.2 COLLECTING DATA Thedataaboutthetemperaturesofcities(Table3.1)cantellusmanythings,butitcannot tellusthecitywhichhadthehighestmaximumtemperatureduringtheyear.Tofindthat,we needtocollectdataregardingthehighestmaximumtemperaturereachedineachofthese citiesduringtheyear.Inthatcase,thetemperaturechartofoneparticulardateoftheyear, asgiveninTable3.1willnotbesufficient. Thisshowsthatagivencollectionofdatamaynotgiveusaspecificinformationrelated to that data. For this we need to collect data keeping in mind that specific information. In the above case the specific information needed by us, was about the highest maximum temperature of the cities during the year, which we could not get from Table 3.1 Thus, before collecting data, we need to know what we would use it for. Givenbelowareafewsituations. You want to study the – PerformanceofyourclassinMathematics. – PerformanceofIndiainfootballorincricket. – Female literacy rate in a given area, or – Numberofchildrenbelowtheageoffiveinthefamiliesaroundyou.. Whatkindofdatawouldyouneedintheabovesituations?Unlessanduntilyoucollect appropriate data, you cannot know the desired information. What is the appropriate data for each? Discuss with your friends and identify the data you would need for each. Some of this data is easy to collect and some difficult. 3.3 ORGANISATION OF DATA When we collect data, we have to record and organise it. Why do we need to dothat?Considerthefollowingexample. Ms Neelam, class teacher wanted to find how children had performed in English. She writes down the marks obtained by the students in the followingway: 23, 35, 48, 30, 25, 46, 13, 27, 32, 38 In this form, the data was not easy to understand. She also did not know whether her impressionofthestudentsmatchedtheirperformance.
  • 3.
    DATA HANDLING #' Neelam’scolleague helped her organise the data in the following way (Table 3.4). Table 3.4 Roll No. Names Marks Roll No. Names Marks Out of 50 Out of 50 1 Ajay 23 6 Govind 46 2 Armaan 35 7 Jay 13 3 Ashish 48 8 Kavita 27 4 Dipti 30 9 Manisha 32 5 Faizaan 25 10 Neeraj 38 Inthisform,Neelamwasabletoknowwhichstudenthasgothowmanymarks.Butshe wanted more. Deepika suggested another way to organise this data (Table 3.5). Table 3.5 Roll No. Names Marks Roll No. Names Marks Out of 50 Out of 50 3 Ashish 48 4 Dipti 30 6 Govind 46 8 Kavita 27 10 Neeraj 38 5 Faizaan 25 2 Armaan 35 1 Ajay 23 9 Manisha 32 7 Jay 13 Now Neelam was able to see who had done the best and who needed help. Manykindsofdatawecomeacrossareputintabularform.Ourschoolrolls,progress report, index in the note books, temperature record and many others are all in tabular form. Can you think of a few more data that you come across in tabular form? When we put data in a proper table it becomes easy to understand and interpret. Weigh(inkg)atleast20children(girlsandboys)ofyourclass.Organisethedata,and answerthefollowingquestionsusingthisdata. (i) Whoistheheaviestofall? (ii) Whatisthemostcommonweight? (iii) What is the difference between your weight and that of your best friend? 3.4 REPRESENTATIVE VALUES Youmightbeawareofthetermaverageandwouldhavecomeacrossstatementsinvolving theterm‘average’inyourday-to-daylife: l Isha spends on an average of about 5 hours daily for her studies. TRY THESE
  • 4.
    MATHEMATICS$ l Theaverage temperature at this time of the year is about 40 degree Celsius. l The average age of pupils in my class is 12 years. l The average attendance of students in a school during its final examination was 98 per cent. Manymoreofsuchstatementscouldbethere.Thinkaboutthestatementsgivenabove. Doyouthinkthatthechildinthefirststatementstudiesexactlyfor5hoursdaily? Or,isthetemperatureofthegivenplaceduringthatparticulartimealways40degrees? Or, is the age of each pupil in that class 12 years? Obviously not. Then what do these statements tell you? By average we understand that Isha, usually, studies for 5 hours. On some days, she may study for less number of hours and on the other days she may study longer. Similarly, the average temperature of 40 degree celsius, means that, very often, thetemperatureatthistimeoftheyearisaround40degreecelsius.Sometimes,itmay be less than 40 degree celsius and at other times, it may be more than 40°C. Thus,werealisethataverageisanumberthatrepresentsorshowsthecentraltendency of a group of observations or data. Since average lies between the highest and the lowest valueofthegivendataso,wesayaverageisameasureofthecentraltendencyofthegroup of data. Different forms of data need different forms of representative or central value to describe it. One of these representative values is the “Arithmetic Mean”. You will learn about the other representative values in the later of the chapter. 3.5 ARITHMETIC MEAN The most common representative value of a group of data is the arithmetic mean or the mean.To understand this in a better way, let us look at the following example: Twovesselscontain20litresand60litresofmilkrespectively.Whatistheamountthat eachvesselwouldhave,if bothsharethemilkequally?Whenweaskthisquestionweare seekingthearithmeticmean. In the above case, the average or the arithmetic mean would be Total quantity of milk Number of vessels = 20 60 2 + litres = 40 litres. Thus,eachvesselswouldhave 40litresof milk. TheaverageorArithmeticmean(A.M.)orsimplymeanisdefinedasfollows: mean = Sum of all observations number of observations Consider these examples. EXAMPLE 1 Ashish studies for 4 hours, 5 hours and 3 hours respectively on three consecutive days. How many hours does he study daily on an average?
  • 5.
    DATA HANDLING $ SOLUTION TheaveragestudytimeofAshishwouldbe Total number of study hours Number of days for which he studdied = 4 5 3 3 + + hours = 4 hours per day Thus, we can say that Ashish studies for 4 hours daily on an average. EXAMPLE 2 Abatsmanscoredthefollowingnumberofrunsinsixinnings: 36, 35, 50, 46, 60, 55 Calculatethemeanrunsscoredbyhiminaninning. SOLUTION Total runs = 36 + 35 + 50 + 46 + 60 + 55 = 282. Tofindthemean,wefindthesumofalltheobservationsanddivideitbythenumberof observations. Therefore,inthiscase,mean= 282 6 =47.Thus,themeanrunsscoredinaninningare47. Where does the arithmetic mean lie TRY THESE How would you find the average of your study hours for the whole week? THINK, DISCUSS AND WRITE Considerthedataintheaboveexamplesandthinkonthefollowing: l Is the mean bigger than each of the observations? l Isitsmallerthaneachobservation? Discuss with your friends. Frame one more example of this type and answer the samequestions. Youwillfindthatthemeanliesinbetweenthegreatestandthesmallestobservations. In particular, the mean of two numbers will always lie between the two numbers. For example the mean of 5 and 11 is 5 11 2 8 + = , which lies between 5 and 11. Can you use this idea to show that between any two fractional numbers, you can find as many fractional numbers as you like. For example between 1 2 and 1 4 you have their average 1 2 1 4 2 + = 3 8 and then between 1 2 and 3 8 , you have their average 7 16 and so on. 1. Find the mean of your sleeping hours during one week. 2. Find atleast 5 numbers between 1 2 and 1 3 . TRY THESE
  • 6.
    MATHEMATICS$ 3.5.1 Range The differencebetween the highest and the lowest observation gives us an idea of the spread of the observations. This can be found by subtracting the lowest observation from the highest observation. We call the result the range of the observation. Look at the followingexample: EXAMPLE 3 The ages in years of 10 teachers of a school are: 32, 41, 28, 54, 35, 26, 23, 33, 38, 40 (i) What is the age of the oldest teacher and that of the youngest teacher? (ii) What is the range of the ages of the teachers? (iii) What is the mean age of these teachers? SOLUTION (i) Arrangingtheagesinascendingorder,weget: 23, 26, 28, 32, 33, 35, 38, 40, 41, 54 We find that the age of the oldest teacher is 54 years and the age of the youngest teacher is 23 years. (ii) Range of the ages of the teachers = (54 – 23) years = 31 years (iii) Mean age of the teachers = 23 26 28 32 33 35 38 40 41 54 10 + + + + + + + + + years = 350 10 years = 35 years EXERCISE 3.1 1. Find the range of heights of any ten students of your class. 2. Organisethefollowingmarksinaclassassessment,inatabularform. 4 6 7 5 3 5 4 5 2 6 2 5 1 9 6 5 8 4 6 7 (i) Whichnumber isthehighest? (ii) Whichnumberisthelowest? (iii) What is the range of the data? (iv) Findthearithmeticmean. 3. Findthemeanofthefirstfivewholenumbers. 4. Acricketerscoresthefollowingrunsineightinnings: 58, 76, 40, 35, 46, 45, 0, 100. Find the mean score.
  • 7.
    DATA HANDLING $! 5. Following table shows the points of each player scored in four games: Player Game Game Game Game 1 2 3 4 A 14 16 10 10 B 0 8 6 4 C 8 11 Didnot 13 Play Nowanswerthefollowingquestions: (i) Find the mean to determine A’s average number of points scored per game. (ii) To find the mean number of points per game for C, would you divide the total points by 3 or by 4? Why? (iii) Bplayed in all the four games. How would you find the mean? (iv) Who is the best performer? 6. The marks (out of 100) obtained by a group of students in a science test are 85, 76, 90, 85, 39, 48, 56, 95, 81 and 75. Find the: (i) Highest and the lowest marks obtained by the students. (ii) Range of the marks obtained. (iii) Mean marks obtained by the group. 7. Theenrolmentinaschoolduringsixconsecutiveyearswasasfollows: 1555, 1670, 1750, 2013, 2540, 2820 Find the mean enrolment of the school for this period. 8. The rainfall (in mm) in a city on 7 days of a certain week was recorded as follows: Day Mon Tue Wed Thurs Fri Sat Sun Rainfall 0.0 12.2 2.1 0.0 20.5 5.5 1.0 (inmm) (i) Find the range of the rainfall in the above data. (ii) Findthemeanrainfallfortheweek. (iii) Onhowmanydayswastherainfalllessthanthemeanrainfall. 9. The heights of 10 girls were measured in cm and the results are as follows: 135, 150, 139, 128, 151, 132, 146, 149, 143, 141. (i) Whatistheheightofthetallestgirl? (ii) Whatistheheightoftheshortestgirl? (iii) What is the range of the data? (iv) Whatisthemeanheightofthegirls? (v) Howmanygirlshaveheightsmorethanthemeanheight.
  • 8.
    MATHEMATICS$ 3.6 MODE Aswe have said Mean is not the only measure of Central tendency or the only form of representative value. For different requirements from a data other measures of Central tendencies are used. Look at the following example Tofindouttheweeklydemandfordifferentsizesofshirt,ashopkeeperkeptrecordsofsales of sizes 90 cm, 95 cm, 100 cm, 105 cm, 110 cm.. Following is the record for a week: Size (in inches) 90 cm 95 cm 100 cm 105 cm 110 cm Total Number of shirts sold 8 22 32 37 6 105 If he found the mean number of shirts sold, do you think that he would be able to decide which shirt sizes to keep in stock? Mean of total shirts sold = Total number of shirts sold Number of different sizes of shiirts = = 105 5 21 Should he obtain 21 shirts of each size? If he does so, will he be able to cater to the needs of the customers? The shopkeeper, on looking at the record, decides to procure shirts of sizes 95cm, 100cm, 105cm. He decided to postpone the procurement of the shirts of other sizes becauseoftheirsmallnumberofbuyers. Look at another example The owner of a readymade dress shop says, “The most popular size of dress I sell is the size90cm. Observe that here also, the owner is concerned about the number of shirts of different sizes sold. She is however looking at the shirt size that is sold the most. This is another representative value for the data. Thehighestoccuringeventisthesaleofsize90cm.Thisrepresentative value is called the mode of the data. The mode of a set of observations is the observation that occurs most often. EXAMPLE 4 Find the mode of the given set of numbers: 1, 1, 2, 4, 3, 2, 1, 2, 2, 4 SOLUTION Arrangingthenumberswithsamevaluestogether,weget 1, 1, 1, 2, 2, 2, 2, 3, 4, 4 Mode of this data is 2 because it occurs more frequently than other observations. 3.6.1 Mode of Large Data Putting the same observations together and counting them is not easy if the number of observations is large. In such cases we tabulate the data. Tabulation can begin by putting tallymarksandfindingthefrequency,asyoudidinyourpreviousclass.
  • 9.
    DATA HANDLING $# Lookatthefollowingexample: EXAMPLE 5 Followingarethemarginsofvictoryinthefootball matches of a league. 1, 3, 2, 5, 1, 4, 6, 2, 5, 2, 2, 2, 4, 1, 2, 3, 1, 1, 2, 3, 2, 6, 4, 3, 2, 1, 1, 4, 2, 1, 5, 3, 3, 2, 3, 2, 4, 2, 1, 2 Find the mode of this data. SOLUTION Let us put the data in a tabular form: Margins of victory Tallybars Number of matches 1 9 2 14 3 7 4 5 5 3 6 2 Total 40 Looking at the table, we can quickly say that 2 is the ‘mode’ since 2 has occured the highestnumberoftimes.Thus,mostofthematcheshavebeenwonwithavictorymargin of 2 goals. THINK, DISCUSS AND WRITE Can a set of numbers have more than one mode? EXAMPLE 6 Find the mode of the numbers: 2, 2, 2, 3, 3, 4, 5, 5, 5, 6, 6, 8 SOLUTION Here, 2 and 5 both occur three times. Therefore, they both are modes of the data. 1. Rec ordtheageinyearsofallyourclassmates.Tabulatethedataandfindthemode. 2. Record the heights in centimetres of your classmates and find the mode. 1. Findthemodeofthefollowingdata: 12, 14, 12, 16, 15, 13, 14, 18, 19, 12, 14, 15, 16, 15, 16, 16, 15, 17, 13, 16, 16, 15, 15, 13, 15, 17, 15, 14, 15, 13, 15, 14 Find the mode of (i) 2, 6, 5, 3, 0, 3, 4, 3, 2, 4, 5, 2, 4, (ii) 2, 14, 16, 12, 14, 14, 16, 14, 10, 14, 18, 14 TRY THESE DO THIS TRY THESE
  • 10.
    MATHEMATICS$ $ 2. Heights(incm)of25childrenaregivenbelow: 168,165, 163, 160, 163, 161, 162, 164, 163, 162, 164, 163, 160, 163, 16, 165, 163, 162, 163, 164, 163, 160, 165, 163, 162 What is the mode of their heights? What do we understand by Mode here? Whereasmeangivesustheaverageofallobservationsofthedata,themodegivesthat observationwhichoccursmostfrequentlyinthedata. Letusconsiderthefollowingexamples: (a) You have to decide upon the number of chapattis needed for 25 people called for a feast. (b) A shopkeeper selling shirts has decided to replenish her stock. (c) We need to find the height of the door needed in our house. (d) When going on a picnic, if only one fruit can be bought for everyone, which is the fruitthatwewouldget. In which of these situations can we use the mode as a good estimate? Considerthefirststatement.Supposethenumberofchapattisneededbyeachperson is 2, 3, 2, 3, 2, 1, 2, 3, 2, 2, 4, 2, 2, 3, 2, 4, 4, 2, 3, 2, 4, 2, 4, 3, 5 Themodeofthedatais2chapattis.Ifweusemodeastherepresentativevalueforthis data, then we need 50 chapattis only, 2 for each of the 25 persons. However the total numberwouldclearlybeinadequate.Wouldmeanbeanappropriaterepresentativevalue? For the third statement the height of the door is related to the height of the persons usingthatdoor.Supposethereare5childrenand4adultsusingthedoorandtheheightof each of 5 children is around 135 cm. The mode for the heights is 135 cm. Should we get a door that is 144 cm high? Would all the adults be abletogothroughthatdoor?Itisclearthatmodeisnottheappropriate representative value for this data. Would mean be an appropriate representativevaluehere? Why not? Which representative value of height should be used to decidethedoorheight? Similarlyanalysetherestofthestatementsandfindtherepresentative valueusefulforthatissue. Discusswithyourfriendsandgive (a) Two situations where mean would be an appropriate representative value to use, and (b) Twosituationswheremodewouldbe andappropriaterepresentativevaluetouse. TRY THESE
  • 11.
    DATA HANDLING $% 3.7 MEDIAN Wehaveseenthatinsomesituations,arithmeticmeanisanappropriatemeasureofcentral tendency whereas in some other situations, mode is the appropriate measure of central tendency. Let us now look at another example. Consider a group of 17 students with the following heights (in cm): 106, 110, 123, 125, 117, 120, 112, 115, 110, 120, 115, 102, 115, 115, 109, 115, 101. The games teacher wants to divide the class into two groups so that each group has equalnumberofstudents,onegrouphasstudentswithheightlesserthanaparticularheight andtheothergrouphasstudentwithheightsgreaterthantheparticularheight.Howwould she do that? Let us see the various options she has: (i) She can find the mean. The mean is Yourfriendfoundthemedianandthe mode of a given data. Describe and correctyourfriendserrorifany: 35, 32, 35, 42, 38, 32, 34 Median = 42, Mode = 32 TRY THESE = = 1930 17 113 5. 106 110 123 125 117 120 112 115 110 120 115 102 115 115 10+ + + + + + + + + + + + + + 99 115 101 17 + + So,iftheteacherdividesthestudentsintotwogroupsonthebasisofthismeanheight, such that one group has students of height less than the mean height and the other group hasstudentswithheightmorethanthemeanheight,thenthegroupswouldbeofunequal size. They would have 7 and 10 members respectively. (ii) Thesecondoptionforheristofindmode.Theobservationwithhighestfrequencyis 115 cm, which would be taken as mode. There are 7 children below the mode and 10 children at the mode and above the mode. Therefore, we cannot divide the group into equal parts. Let us therefore think of an alternative representative value or measure of central tendency. For doing this we again look at the given heights (in cm) of students arrange theminascendingorder.Wehavethefollowingobservations: 101, 102, 106, 109, 110, 110, 112, 115, 115, 115, 115, 115, 117, 120, 120, 123, 125 The middle value in this data is 115 because this value divides the students into two equal groups of 8 students each. This value is called as Median. Median refers to the value which lies in the middle of the data (when arranged in an increasing or decreasing order) with half of the observations above it and the other half below it. The games teacher decides to keep the middle student as a refree in the game. Here, we consider only those cases where number of observations is odd. Thus, in a given data, arranged in ascending or descending order, the median gives us the middle observation.
  • 12.
    MATHEMATICS$ Note thatin general, we may not get the same value for median and mode. Thuswerealisethatmean,modeandmedianarethenumbersthataretherepresentative values of a group of observations or data. They lie between the minimum and maximum values of the data. They are also called the measures of the central tendency. EXAMPLE 7 Find the median of the data: 24, 36, 46, 17, 18, 25, 35 SOLUTION We arrange the data in ascending order, we get 17, 18, 24, 25, 35, 36, 46 Median is the middle observation. Therefore 25 is the median. EXERCISE 3.2 1. The scores in mathematics test (out of 25) of 15 students is as follows: 19, 25, 23, 20, 9, 20, 15, 10, 5, 16, 25, 20, 24, 12, 20 Find the mode and median of this data. Are they same? 2. The runs scored in a cricket match by 11 players is as follows: 6, 15, 120, 50, 100, 80, 10, 15, 8, 10, 15 Find the mean, mode and median of this data. Are the three same? 3. The weights (in kg.) of 15 students of a class are: 38, 42, 35, 37, 45, 50, 32, 43, 43, 40, 36, 38, 43, 38, 47 (i) Find the mode and median of this data. (ii) Is there more than one mode? 4. Find the mode and median of the data: 13, 16, 12, 14, 19, 12, 14, 13, 14 5. Tellwhetherthestatementistrueorfalse: (i) The mode is always one of the numbers in a data. (ii) The mean can be one of the numbers in a data. (iii) The median is always one of the numbers in a data. (iv) A data always has a mode. (v) The data 6, 4, 3, 8, 9, 12, 13, 9 has mean 9. 3.8 USE OF BAR GRAPHS WITH A DIFFERENT PURPOSE We have seen last year how information collected could be first arranged in a frequency distribution table and then this information could be put as a visual representation in the form of pictographs or bar graphs. You can look at the bar graphs and make deductions aboutthedata.Youcanalsogetinformationbasedonthesebargraphs.Forexample,you can say that the mode is the longest bar if the bar represents the frequency. 3.8.1 Choosing a Scale We know that a bar graph is a representation of numbers using bars of uniform width and the lengths of the bars depend upon the frequency and the scale you have chosen. For example,inabargraphwherenumbersinunitsaretobeshown,thegraphrepresentsone unitlengthforoneobservationandifithastoshownumbersintensorhundreds,oneunit length can represent 10 or 100 observations. Consider the following examples:
  • 13.
    DATA HANDLING $' EXAMPLE 8 Twohundredstudentsof6th and7th classwereaskedtonametheirfavourite colour so as to decide upon what should be the colour of their School Building.Theresultsareshowninthefollowingtable.Representthegiven data on a bar graph. FavouriteColour Red Green Blue Yellow Orange Number of Students 43 19 55 49 34 Answerthefollowingquestionswiththehelpofthebargraph: (i) Which is the most preferred colour and which is the least preferred? (ii) Howmanycoloursarethereinall?Whatare they? SOLUTION Choose a suitable scale as follows: Startthescaleat0.Thegreatestvalueinthedatais 55, so end the scale at a value greater than 55, suchas60.Useequaldivisionsalongtheaxes,such as increments of 10. You know that all the bars would lie between 0 and 60. We choose the scale such that the length between 0 and 60 is neither too long nor too small. Here we take 1 unit for 10 students. We then draw and label the graph as shown. From the bar graph we conclude that (i) Blue is the most preferred colour (Because the bar representing Blue is the tallest). (ii) Green is the least preferred colour. (Because the bar representing Green is the shortest). (iii) There are five colours. They are Red, Green, Blue, Yellow and Orange. (These are observedonthehorizontalline) EXAMPLE 9 Following data gives total marks (out of 600) obtained by six children of a particular class. Represent the data on a bar graph. Students Ajay Bali Dipti Faiyaz Geetika Hari Marks Obtained 450 500 300 360 400 540 SOLUTION (i) To choose an appropriate scale we make equal divisions taking increments of 100. Thus1unitwillrepresent100marks.(Whatwouldbethedifficultyifwechooseone unit to represent 10 marks?) Scale : 1 unit = 10 students 0 10 20 30 40 50 60 Red Green Blue Yellow Orange Students
  • 14.
    MATHEMATICS% 0 100 200 300 400 500 600 Ajay Bali Dipti Faiyaz Geetika Marksoutof600 Hari Students Scale :1 unit = 100 marks (ii) Now represent the data on the bar graph. Drawing Double Bar Graph Considerthefollowingtwocollectionsdatagivingtheaveragedailyhoursofsunshinein two cities Aberdeen and Margate for all the twelve months of the year. These cities are near the south pole and hence have only a few hourse of sunshine each day. In Margate Jan Feb Mar April May June July Aug Sept. Oct. Nov. Dec. Average hours of 2 4 4 8 7 6 4 2 Sunshine In Aberdeen Average hours of 3 6 5 4 3 Sunshine Bydrawingindividualbargraphsyoucouldanswerquestionslike (i) Inwhichmonthdoeseachcityhasmaximumsunlight? or (ii) Inwhichmonthsdoeseachcityhasminimumsunlight? However,toanswerquestionslike“Inaparticularmonth,whichcityhasmoresunshine hours”,weneedtocomparetheaveragehoursofsunshineofboththecities.Todothiswe will learn to draw what is called a double bar graph giving the information of both cities side by side. This bar graph (Fig 3.1) shows the average sunshine of both the cities. For each month we have two bars, the heights of which give the average hours of sunshine in each city. From this we can infer that except for the month of April, there is alwaysmoresunshineinMargatethaninAberdeen.Youcouldputtogetherasimiliarbar graph for your area or for your city. 1 3 4 3 7 4 1 7 2 1 6 4 1 1 2 1 3 2 1 5 2 1 5 2 1 6 2 1 4 2 3 1 4
  • 15.
    DATA HANDLING % Let us look at another example more related to us. EXAMPLE 10 Amathematicsteacherwantstosee,whetherthenewtechniqueofteach- ing she applied after quarterly test was effective or not. She takes the scores of the 5 weakest children in the quarterly test (out of 25) and in the half yearly test (out of 25): Students Ashish Arun Kavish Maya Rita Quarterly 10 15 12 20 9 Half yearly 15 18 16 21 15 SOLUTION Since there seems to be a marked improvement in most of thestudents,theteacherdecidesthatsheshouldcontinueto usethenewtechniqueofteaching. Can you think of a few more situtions where you could use double bar graphs? 1. The bar chart (Fig 3.2) shows the result of a survey to test water resistant watches madebydifferentcompanies. Each of these companies claimed that their watches were water resistant. After a test the above results were revealed. 0 2 Jan Feb. March April May Scale : 1 unit = 1 hour of sunshine 4 6 8 June July August Sept. Oct. Nov. Dec. Aberdeen Margate Houseofsunshine Fig 3.1 TRY THESE
  • 16.
    MATHEMATICS% (a) Can youwork a fraction of the number of watches that leaked to the number tested for each company? (b) Could you tell on this basis which company has better watches? 2. Sale of English and Hindi books in the years 1995, 1996, 1997 and 1998 are given below: Fig 3.2 1995 1996 1997 1998 English 350 400 450 620 Hindi 500 525 600 650 Drawadoublebargraphandanswerthefollowingquestions: (a) In which year was the difference in the sale of the two language books least?. (b) Can you say that the demand for English books rose faster?Justify. EXERCISE 3.3 1. Use the bar graph (Fig 3.3) to answer the following questions. (a) Which is the most popular pet? (b) Howmanychildrenhavedogasapet? Fig 3.3 2. Read the bar graph (Fig 3.4) and answer the questions that follow: Number of books sold by a bookstore during five consecutive years. (i) About how many books were sold in 1989? 1990? 1992? (ii) In which year were about 475 books sold? About 225 books sold? Fig 3.4 Scale : 1cm = 100 books
  • 17.
    DATA HANDLING %! (iii) In which years were fewer than 250 books sold? (iv) Can you explain how you would estimate the number of books sold in 1989? 3. Number of children in six different classes are given below. Represent the data on a bar graph. Class Fifth Sixth Seventh Eighth Ninth Tenth NumberofChildren 135 120 95 100 90 80 (a) How would you choose a scale. (b) Answerthefollowingquestions: (i) Whichclasshasthemaximumnumberofchildren?Andtheminimum? (ii) Find the ratio of students of class sixth to the students of class eight. 4. The performance of students in 1st Term and 2nd Term is given. Draw a double bar graphchoosingappropriatescaleandanswerthefollowing: Subject English Hindi Maths Science S. Science 1st Term (M.M. 100) 67 72 88 81 73 2nd Term (M.M. 100) 70 65 95 85 75 (i) Inwhichsubject,hasthechildimprovedhisperformancethemost? (ii) Inwhichsubjectistheimprovementtheleast? (iii) Has the performance gone down in any subject?. 5. Consider this data collected from a survey of a colony. Favourite Sport Cricket Basket Ball Swimming Hockey Athletics Watching 1240 470 510 423 250 Participating 620 320 320 250 105 (i) Draw a double bar graph choosing an appropriate scale. What do you infer from the bar graph? (ii) Which sport is most popular? (iii) Whichismorepreferred,watchingorparticipatinginsports? 6. Take the data giving the minimum and the maximum temperature of various cities given in the beginning of this chapter (Table 3.1). Plot a double bar graph using the dataandanswerthefollowing: (i) Whichcityhasthelargestdifferenceintheminimumandmaximumtemperature on the given date? (ii) Which is the hottest city and which is the coldest city? (iii) Nametwocitieswheremaximumtemperatureofonewaslessthantheminimum temperature of the other. (iv) Name the city which has the least difference between its minimum and the maximumtemperature.
  • 18.
    MATHEMATICS% 3.9 CHANCEAND PROBABILITY These words often come up in our daily life. We often say, “there is no chance of it raining today” and also say things like “it is quite probable that India will win the WorldCup.”Letustryandunderstandthesetermsabitmore.Considerthestatements; (i) The Sun coming up from the West (ii) Anantgrowingto3mheight. (iii) If you take a cube of larger volume its side will also be larger. (iv) If you take a circle with larger area then it’s radius will also be larger. (v) Indiawinningthenexttestseries. If welookatthestatementsgivenaboveyouwouldsaythattheSuncomingupfrom theWestisimpossible,anantgrowingto3m isalsonotpossible.Ontheotherhandif thecircleisofalargerareaitiscertainthatitwillhavealargerradius.Youcansaythesame aboutthelargervolumeof thecubeandthelargerside.OntheotherhandIndiacanwin thenexttestseriesorloseit.Botharepossible. 3.9.1 Chance If you toss a coin, can you always correctly predict what you will get? Try tossing a coin and predicting the outcome each time. Write your observations in the followingtable: Toss number Prediction Outcome Do this 10 times. Look at the observed outcomes. Can you see a pattern in them? What do you get after each head? Is it that you get head all the time? Repeat the observation for another 10 tosses and write the observations in the table. You will find that the observations show no clear pattern. In the table below we give you observations generated in 25 tosses by Sushila and Salma. Here H represents Head and T represents Tail. No. 1 2 3 4 5 6 7 8 9 10 11 12 13 14 15 Outcome H T T H T T T H T T H H H H H No. 16 17 18 19 20 21 22 23 24 25 Outcome T T H T T T T T T T What does this data tell you? Can you find a predictable pattern for head and tail? Clearly there is no fixed pattern of occurrence of head and tail. When you throw the coin each time the outcome of every throw can be either head or tail. It is a matter of chance that in one particular throw you get either of these. In the above data, count the number of heads and the number of tails. Throw the coin somemoretimesandkeeprecordingwhatyouobtain.Findoutthe totalnumber of times you get a head and the total number of times you get a tail. You also might have played with a die. The die has six faces. When you throw a die, can you predict the number that will be obtained? While playing Ludo or Snake and ladders you may have often wished that in a throw you get a particular outcome. Think of some situations, atleast 3 examples of each, that are certain to happen, some that are impossible and some that may or may not happen i.e., situations thathave some chance of happening. TRY THESE
  • 19.
    DATA HANDLING %# |||| |||| |||| |||| |||| ||||||| |||| |||| |||| |||| |||| |||| |||| ||||| |||| |||| |||| |||| |||| |||| |||| |||| |||||| |||| |||| |||| |||| ||||| |||| |||| |||| |||| |||||| |||| |||| |||| |||| |||| |||| ||||||| ||||| |||| |||| |||| |||| |||| |||| |||| Does the die always fall according to your wishes? Take a die and throw it 150 timesandfillthedatainthefollowingtable: Number on Die Tally Marks Number of times it occured 1 2 Makeatallymarkeachtimeyougettheoutcome,againsttheappropriatenumber. Forexampleinthefirstthrowyouget5.Putatallyinfrontof5.Thenextthrowgivesyou 1. Make a tally for 1. Keep on putting tally marks for the appropriate number. Repeat this exercise for 150 throws and find out the number of each outcome for 150 throws. Make bar graph using the above data showing the number of times 1, 2, 3, 4, 5, 6 have occured in the data. (Do in a group) 1. Tossacoin100timesandrecordthedata.Findthenumberoftimesheadsandtails occurinit. 2. Aftaabthrewadie250timesandgotthefollowingtable.Drawabargraphforthisdata. Number on the Die Tally Marks 1 2 3 4 5 6 3. Throw a die 100 times and record the data. Find the number of times 1, 2, 3, 4, 5, 6 occur. What is probability? We knowthatwhenacoinisthrown,ithastwopossibleoutcomes,Head orTailandfor adiewehave6possibleoutcomes.We alsoknowfromexperience thatfor a coin,Head orTailisequallylikelytobeobtained.WesaythattheprobabilityofgettingHeadorTail is equal and is 1 2 for each. For a die, possibility of getting either of 1, 2, 3, 4, 5 or 6 is equal. That is for a die there are 6 equally likely possible outcomes. We say each of 1, 2, 3, 4, 5, 6 has one- sixth( 1 6 )probability.Wewilllearnaboutthisinthelaterclasses.Butfromwhatwehave done,itmayperhapsbeobviousthateventsthathavemanypossibilitiescanhaveprobability TRY THESE
  • 20.
    MATHEMATICS% $ between 0and 1. Those which have no chance of happening have probability 0 and those that are bound to happen have probability 1. Given any situation we need to understand the different possible outcomes and study the possible chances for each outcome. It may be possible that the outcomes may not have equal chance of occuring unlike the cases of the coin and die. For example if a container has 5 red balls and 9 white balls and if a ball is pulled out without seeing, the chances of getting a red ball are much more. Can you see why? How many times are the chances of getting a red ball than getting a white ball, probabilities for both being between 0 and 1. EXERCISE 3.4 1. Tellwhetherthefollowingiscertaintohappen,impossible,canhappenbutnotcertain. (i) You are older today than yesterday. (ii) Atossedcoinwilllandheadsup. (iii) A die when tossed shall land up with 8 on top. (iv) Thenexttrafficlightseenwillbegreen. (v) Tomorrow will be a cloudy day. 2. There are 6 marbles in a box with numbers from 1 to 6 marked on each of them. (i) Whatistheprobabilityofdrawingamarblewithnumber2? (ii) Whatistheprobabilityofdrawingamarblewithnumber5? 3. A coin is flipped to decide which team starts the game. What is the probability that yourteamwillstart? 4. A box contains pairs of socks of two colours (black and white). I have picked out a white sock. I pick out one more with my eyes closed. What is the probability that it willmakeapair? WHAT HAVE WE DISCUSSED? 1. The collection, recording and presentation of data help us organise our experiences anddrawinferencesfromthem. 2. Before collecting data we need to know what we would use it for. 3. The data that is collected needs to be organised in a proper table, so that it becomes easy to understand and interpret. 4. Average is a number that represents or shows the central tendency of a group of observations or data. 5. Arithmeticmeanisoneoftherepresentativevaluesofdata. 6. Modeisanotherformofcentraltendencyorrepresentativevalue.Themodeofaset of observations is the observation that occurs most often. 7. Median is also a form of representative value. It refers to the value which lies in the middle of the data with half of the observations above it and the other half below it. 8. Abargraphisarepresentationofnumbersusingbarsofuniformwidths. 9. Double bar graphs help to compare two collections of data at a glance. 10. There are situations in our life, that are certain to happen, some that are impossible andsomethatmayormaynothappen.Thesituationthatmayormaynothappenhas achanceofhappening. Construct or thinkoffive situationswhere outcomes do not haveequal chances. TRY THESE