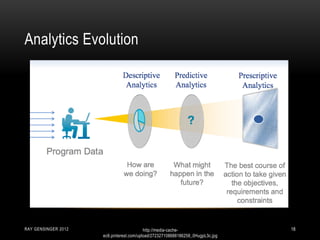
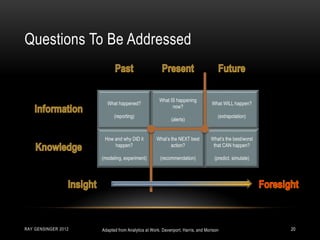
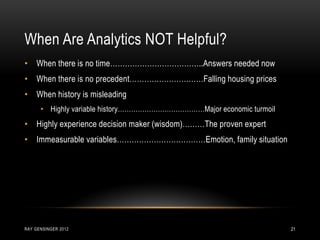
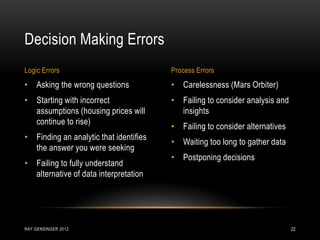
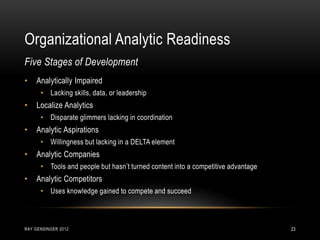
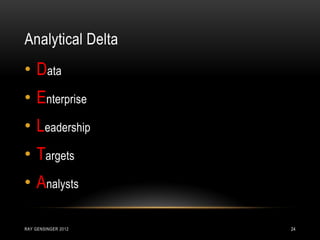
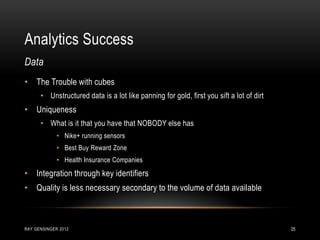
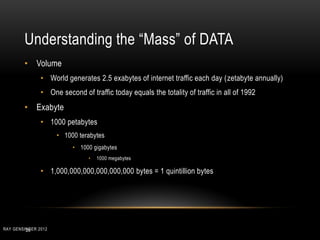
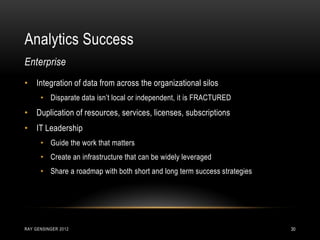
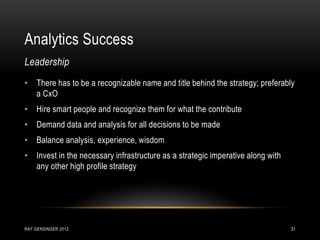
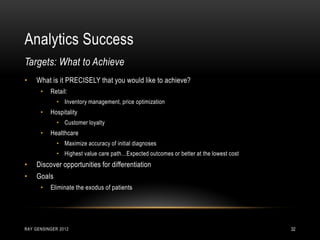
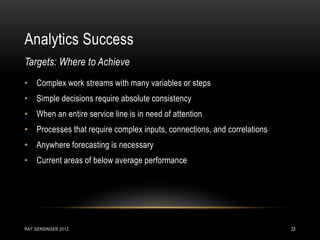
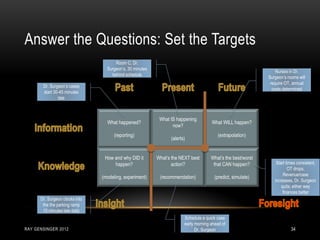
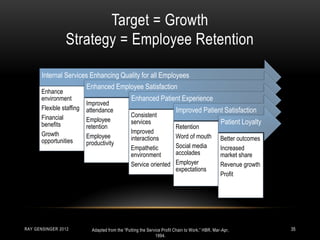
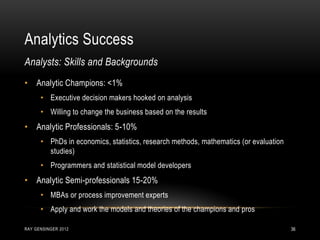
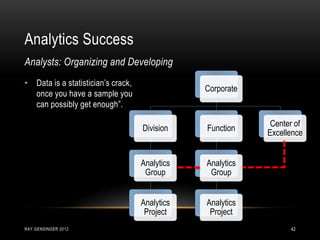
This document is a presentation by Raymond Gensinger on data analytics in healthcare. It discusses examples of analytics used in baseball to improve performance, the different types of analytics including descriptive, predictive, and prescriptive. It also covers how analytics have evolved, organizational readiness for analytics, and key factors for analytics success including data, enterprise integration, leadership, targets, and having the right analysts. The presentation provides a framework for healthcare to apply analytics and examples of how different types of analytics could be used.
Gain insights from data analytics and take action! Learn why everyone is making a big deal about big data in healthcare and how data analytics creates action.
Understand what healthcare analytics is.
Identify the 5-stage Analytics Program Lifecycle (APL).
Understand how data analytics can be used in healthcare.
Check it on Experfy: https://www.experfy.com/training/courses/introduction-to-healthcare-analytics.
Large amounts of heterogeneous medical data have become available in various healthcare organizations (payers, providers, pharmaceuticals). Those data could be an enabling resource for deriving insights for improving care delivery and reducing waste. The enormity and complexity of these datasets present great challenges in analyses and subsequent applications to a practical clinical environment. More details are available here http://dmkd.cs.wayne.edu/TUTORIAL/Healthcare/
By leveraging Big Data, the healthcare industry has an incredible potential to improve lives. This session will give examples of how data volume, velocity and variety is transforming the “art” of a doctor to the science of care. It will describe how the use of machine learning and massive amount of data will drive the new Consumer Drive healthcare movement.
This presentation is about basics of Big data Analytics along with Characteristics,Challenges,Structures,Differences between Traditional and Big data,How Big data is getting benefited in Healthcare Industry,Big data in Real time
Big Data Analytics for Smart Health CareEshan Bhuiyan
Healthcare big data refers to the vast quantities of data that is now available to healthcare providers.
As a response to the digitization of healthcare information and the rise of value-based care, the industry has taken advantage of big data and analytics to make strategic business decisions.
Health Care Analytics
Table of Content:
What is Healthcare Analytics
Objectives of Healthcare Analytics
Types of Analytics
Source of Data
What do Healthcare companies achieve with healthcare analytics
Booming technologies in the Healthcare Industries with some of their uses
Existing Healthcare analytics tool in the market
-----------------------------------------------------------------------
Objectives of Healthcare Analytics
The fundamental objective of healthcare analytics is to help people make and execute rational decisions.
Data - Driven
Analytics in healthcare can help ensure that all decisions are made based on the best possible evidence derived from accurate and verified sources of information.
Transparent
Healthcare analytics can break down silos based on program, department or even facility by promoting the sharing of accurate, timely and accessible information
Verifiable
The selected option can be tested and verified, based on the available data and decision-making model, to be as good as or better than other alternatives.
Robust
Healthcare is a dynamic environment; decisions making models must be robust enough to perform in non-optimal conditions such as missing data, calculation error, failure to consider all available options and other issues.
-------------------------------------------------------------------------------
Types of Analytics
Descriptive Analytics
Uses business Intelligence and data mining to ask: “What has Happened”
Diagnostics Analytics
Examines data to answer, “Why did it happen ?”
Predictive Analytics
Uses optimization and simulation to ask: “What should we do”
Prescriptive Analytics
Uses optimization and simulation to ask: “What should we do”
----------------------------------------------------------------------------------
Sources of Data
Human Generated data
Web and social media data
Machine to Machine data
Transaction data
Biometric data
---------------------------------------------------------------------------------
What do Healthcare companies achieve with healthcare analytics
Hospitals
Reducing Cost
Reducing cost of analytics by building an easy-to-use analytics platform
Identifying and preventing anomalies such as fraud
Automating external and internal reporting
Improving patient outcomes
Clinical decision support
Pharmacy
Randomized clinical trials are expensive to conduct and are not effective at identifying rare events, heterogeneous treatment effects, long-term outcomes. Pharma companies rely on healthcare analytics to identify such relationships. However, inferring causal relations can be difficult as data can be easily misinterpreted to view unrelated factors as inter-dependent.
Presented at the 7th Healthcare CIO Program, Hospital Administration School, Faculty of Medicine Ramathibodi Hospital, Mahidol University, Thailand on July 8, 2016
This webinar will focus on the technical and practical aspects of creating and deploying predictive analytics. We have seen an emerging need for predictive analytics across clinical, operational, and financial domains. One pitfall we’ve seen with predictive analytics is that while many people with access to free tools can develop predictive models, many organizations fail to provide a sufficient infrastructure in which the models are deployed in a consistent, reliable way and truly embedded into the analytics environment. We will survey techniques that are used to get better predictions at scale. This webinar won’t be an intense mathematical treatment of the latest predictive algorithms, but will rather be a guide for organizations that want to embed predictive analytics into their technical and operational workflows.
Topics will include:
Reducing the time it takes to develop a model
Automating model training and retraining
Feature engineering
Deploying the model in the analytics environment
Deploying the model in the clinical environment
Data Mining in Healthcare: How Health Systems Can Improve Quality and Reduce...Health Catalyst
This is the complete 4-part series demonstrating real-world examples of the power of data mining in healthcare. Effective data mining requires a three-system approach: the analytics system (including an EDW), the content system (and systematically applying evidence-based best practices to care delivery), and the deployment system (driving change management throughout the organization and implementing a dedicated team structure). Here, we also show organizations with successful data-mining-application in critical areas such as: tracking fee-for-service and value-based payer contracts, population health management initiatives involving primary care reporting, and reducing hospital readmissions. Having the data and tools to use data mining and predict trends is giving these health systems a big advantage.
Presentation on Predictive modeling in Health-care at San Jose, Ca 2015. This presentation talks about healthcare industry in US, provides stats and forecasts. It then discusses a few use cases in health care and goes into detail on a kaggle example.
This presentation addresses
*Why do we need access to Health Data and Information?
*What are the challenges we have?
*What are the possible interventions that can be made so that access becomes easy for patients and doctors?
5 Reasons Why Healthcare Data is Unique and Difficult to MeasureHealth Catalyst
Healthcare data is not linear. It is a complex, diverse beast unlike the data of any other industry. There are five ways in particular that make healthcare data unique:
1. Much of the data is in multiple places.
2. The data is structured and unstructured.
3. It has inconsistent and variable definitions; evidence-based practice and new research is coming out every day. 4. The data is complex.
5. Changing regulatory requirements.
The answer for this unpredictability and complexity is the agility of a late-binding Data Warehouse.
Evolution of the healthcare industry in India and the potential impact of the...Harshit Jain
2014 looks to be a positive but challenging year for the Indian health care sector; one in which many historic business models and operating processes will no longer suffice amid rising demand, continued cost pressures, lack of or inadequate care facilities, and rapidly evolving market conditions. India, likely will be dominated by the “Modi-care” –Health assurance for all.
Data science and the use of big data in healthcare delivery could revolutionize the field by decreasing costs and vastly improving efficiency and outcomes. There is an abundance of healthcare data in Canada, but it is mostly siloed and difficult to access due to privacy and security challenges. This session will offer insights into best practices for healthcare analytics programs, as well as use cases that demonstrate the potential benefits that can be realized through this work.
An Introduction to Business Intelligence for HealthcarePerficient, Inc.
BI is rapidly advancing as a tool for getting the right information to the right people at the right time, streamline processes, and ultimately drive better interactions with patients, members, physicians, and partners. Join Perficient as Health BI Practice Manager, Mike Jenkins, discusses:
The Basics of Business Intelligence
BI Concepts and Definitions in the Healthcare Industry
The BI Maturity Model
This is an insightful introduction to business intelligence for healthcare.
Business Intelligence Solution in the Health Insurance CompanyThuy Tran
It is the small project of the subject Data Warehousing and Business Intelligence of the course Business Consultant Master in Hochschule Furtwange. The purpose of this project is helping students understand more about Data Warehouse and Data Analytics, able to use SAP BI-DW and Qlik View to create dashboard, reports
Big Data Analytics for Healthcare Decision Support- Operational and ClinicalAdrish Sannyasi
Splunk’s data analytics platform could be utilized to solve many high impact business problems in healthcare delivery systems to reduce cost, improve patient outcome and safety, and enhance care coordination experience. Analyze observed behavior from healthcare event data and metadata to discover patterns, monitor compliance, and optimize the workflow. Furthermore 80% of healthcare data is unstructured (clinical free text and documentation), or semi-structured and many new data sources are such as tele health, mobile health, sensors, and devices are getting integrated in many healthcare systems specifically in the area of chronic disease management. So, one need analytics software that can harvest, interpret, enrich, normalize, and model diverse structured and unstructured data and analytics approaches that embrace the “data turmoil” by relying less on standardized data items and more on the capability to process data in any format.
Healthcare Business Intelligence & Analytics – A Dose of WellnessSPEC INDIA
As the Healthcare industry moves to the next level of offerings, data captured coupled with business intelligence & data analytics provides innovative solutions for this very dynamic industry relying heavily on contemporary techniques like mobile technologies, the Cloud and the IoT. Special solutions to cater to the mobile device management for healthcare too gain growing importance.
The need for cost optimizations all across, the requirements to gain insights into the very detailed parameters related to treatment plans and the administrative efforts to co-ordinate and keep these in sync is managed by Healthcare Business Intelligence solutions.
Get More Details on Business Intelligence for Healthcare Industry Here: http://blog.spec-india.com/healthcare-business-intelligence-analytics-dose-wellness/
Material for the 26 Oct 2015 lecture I held for Aalto University business students. The lecture focuses on the high level topics in analytics and Big Data that are either central to the subject or just highly visible in the media.
The main messages of the lecture are:
- The purpose of analytics and of the data analyst is to solve business problems
- Big Data brings over some very special traits to doing analytics that don't exist when working working with smaller datasets. Understanding these traits is a must for successful analytics.
- Deploying analytics is more dependent on humans than on technology
- Data and analytics are nowadays significant assets to many companies. Therefore they need their own strategy and need to be managed just like any other business critical assets.
Business Analytics for the Broadcasting IndustryFarzad Minooei
Digital age poses new challenges to broadcast industry. The market has become more fragmented. The behavior of consumers has been dramatically changed. New content creation models has been emerged. As a result, this environment created a fierce competition across media and broadcast agencies to attract the audience’s attention. Although new technologies brought challenges to the industry, they promise new opportunities to tackle these challenges. In this presentation, I discuss the application of business analytics for broadcast industry and showcase some examples of successful implementation of business analytics in broadcast agencies.
Business analytics is the scientific process of transforming data into insight for making better decisions. By employing different data sources, business analytics can help broadcast agencies to better understand their consumers, identify opportunities for increasing their engagement with the content, target different segments more accurately, and predict consumers’ behavior and optimize allocation of resources across different media channels.
As an example, Entravision, a media company targeting US Latinos, provides a platform which gives its clients access to Latino persona models and analytics. It helps provide clients with a clearer understanding of how Latino consumers behave. The Real‐Time Cloud Insights is another platform created by Entravision, which takes a client's data and integrates near real-time insights to build predictable, relevant models and can improve business efficiencies in real time. Another example is partnership between FOX Networks Group and Facebook to broadcast OUTCAST show in Facebook live and analyze the reaction of the audience behavior in social media.
These examples illustrates the applications of analytics in the broadcast industry. It also indicates a new area has started in which the media agencies have no longer faced mass consumers. Instead, they need to treat them as individuals.
Waterstons’ Business analytics specialists Dan, Chris and Michael will present Waterstons’ latest thinking and experience around the drivers behind analytics and intelligence in the business environment, and the current business analytics marketplace.
They will discuss Waterstons’ Business Insights Maturity Model, which sets out the methodology we use to help our customers derive competitive advantage, improve productivity and management control, and provide support for better business decision making, before using case studies to explain how real businesses are leveraging the power of modern analytics tools.
#MITXData "Leveraging Data and Analytics for Your Marketing Strategy" present...MITX
-Jesse Harriott, Ph.D., Chief Analytics Officer, Constant Contact
-Dave Krupinksi, Co-Founder & Chief Technology Officer, Care.com
You may remember the days before the Web, social media, mobile, and Big Data. Instinct was a prized business characteristic and it, rather than data, drove many corporate marketing decisions.Companies now say that they are "data-driven" and only make quantitative marketing decisions. But these same companies are also overwhelmed by the sheer volume of data at their disposal and how to best analyze it to shape critical marketing questions. The issue today is not the lack of data, but rather how to prioritize, access, and use data in real time so it has the greatest impact on your business.
During this opening keynote, two top analytic leaders from major brands, Constant Contact and Care.com, will share best practices and proven strategies for incorporating analytics into your marketing strategy. Join Jesse Harriott, Chief Analytics Officer at Constant Contact, and Dave Krupinski, Co-founder and Chief Technology Officer at Care.com, as they discuss strategies to leverage data and analytics tools to inform marketing decisions and realize substantial ROI.
This presentation shows how Big Data impacts business and technology and asks (and maybe answers) the question: how new is Big Data and the effects it causes... ?
The big-data explosion is driving a shift away from gut-based decision making. Marketing, in particular, is feeling the pressure to embrace new data-driven customer intelligence capabilities.
Marketers working 70-80 hours a week is not a great thing to hear.
But the requirement for them to have such a large amount of work time causes problems in the data selection and filtering.
Hence many marketers flunk the big data test
The Importance of Economic Conditions When Building Forecast Modelse-forecasting.com
In his presentation, The Importance of Economic Conditions When Building Forecast Models, Chief Economist of e-forecasting.com Dr Evangelos Simos covers a wide variety of key economic concepts and the possible direct and indirect impacts each has on forecast accuracy.
Although several forecast packages and methodologies exist, we all operate in the same economic environment and the changing conditions impact demand. Even if current corporate forecast processes do not take into account economic conditions, Dr. Simos' presentation will leave the audience with basic guidelines of how to interpret key economic events and their likely outcome on business.
For instance, what are the implications of oil prices spiking to $150 this summer? How much worse are conditions expected to get in Europe and how will that impact exports and foreign demand? Will further Mid East tensions bring violence and political instability? What happens in the US if Obama is re-elected?
e-forecasting.com, an international economic research and consulting firm, offers forecasts of the economic environment using proprietary, real-time economic indicators to produce customized solutions for what’s next. e-forecasting.com collaborates with domestic and international clients and publications to provide timely economic content for use as predictive intelligence to strengthen its' clients competitive advantage.
Reporting on individual metrics in isolation will only get you so far. Data-driven decision making requires deeper analysis that includes additional context. This context often comes from a variety of data sources, many of which are siloed. Learn about the importance of data context, as well as specific steps on how to provide context across a variety of data sources.
Data Analysis Methods 101 - Turning Raw Data Into Actionable InsightsDataSpace Academy
Data analytics is powerful for organisations. It can help companies improve their overall efficiency and effectiveness. The blog offers a step-by-step narration of the data analysis methods that will help you to comprehend the fundamentals of an analytics project.
Hospital Pricing Issues Cost Employers MoneyMark Gall
This five-year study details the wide variation of hospital prices for the same procedure in the same town. It considers the impact on the costs of private insurance plans from insurance companies including CIGNA, Anthem, Aetna and United HealthCare. See highlights on pages 1 through 6.
The cost of claims drives the cost of employer health plans. See a sample proposal on of a specialized, self-funded health plan that lowers claim costs and makes health care work for employees and employers.
White Paper: Breakthrough Behavioral NetworkMark Gall
A specialty provider network for mental health services.
The impressive clinical improvement for
Breakthrough patients is driving efficient
treatment episodes vs. other systems of care.
Integrating benchmarks into your health plan delivers positive results for employers and employees. We call it healthcare intelligence; the act of using independent data to improve health plan efficiency and outcomes for the benefit of employees.
Overview of an Open-Platform Health Plan that Lowers Costs and Improves Perfo...Mark Gall
It's hard to gauge how well a health plan is performing. Do our employees understand and get the most out of their benefits? How effective is our wellness program? Are we paying too much for services? These are typical questions. An Open-Platform Health Plan is a self-funded health plan with unique features that allow an employer to establish, track and review performance benchmarks and reduce their exposure to risk.
HLU Consultants, Inc. is a privately held, independent consulting firm based out of Cincinnati, OH since 1961. The consultants at HLU successfully bring together a tremendous amount of industry expertise, valued partners and innovative technologies to design a better, cost-efficient health plan around a customer’s workforce. They help employers establish meaningful benchmarks so they can gauge the success of their plan with a focus on reducing costs, improving outcomes and helping employees successfully navigate the complex healthcare system.
India Clinical Trials Market: Industry Size and Growth Trends [2030] Analyzed...Kumar Satyam
According to TechSci Research report, "India Clinical Trials Market- By Region, Competition, Forecast & Opportunities, 2030F," the India Clinical Trials Market was valued at USD 2.05 billion in 2024 and is projected to grow at a compound annual growth rate (CAGR) of 8.64% through 2030. The market is driven by a variety of factors, making India an attractive destination for pharmaceutical companies and researchers. India's vast and diverse patient population, cost-effective operational environment, and a large pool of skilled medical professionals contribute significantly to the market's growth. Additionally, increasing government support in streamlining regulations and the growing prevalence of lifestyle diseases further propel the clinical trials market.
Growing Prevalence of Lifestyle Diseases
The rising incidence of lifestyle diseases such as diabetes, cardiovascular diseases, and cancer is a major trend driving the clinical trials market in India. These conditions necessitate the development and testing of new treatment methods, creating a robust demand for clinical trials. The increasing burden of these diseases highlights the need for innovative therapies and underscores the importance of India as a key player in global clinical research.
One of the most developed cities of India, the city of Chennai is the capital of Tamilnadu and many people from different parts of India come here to earn their bread and butter. Being a metropolitan, the city is filled with towering building and beaches but the sad part as with almost every Indian city
CHAPTER 1 SEMESTER V PREVENTIVE-PEDIATRICS.pdfSachin Sharma
This content provides an overview of preventive pediatrics. It defines preventive pediatrics as preventing disease and promoting children's physical, mental, and social well-being to achieve positive health. It discusses antenatal, postnatal, and social preventive pediatrics. It also covers various child health programs like immunization, breastfeeding, ICDS, and the roles of organizations like WHO, UNICEF, and nurses in preventive pediatrics.
The dimensions of healthcare quality refer to various attributes or aspects that define the standard of healthcare services. These dimensions are used to evaluate, measure, and improve the quality of care provided to patients. A comprehensive understanding of these dimensions ensures that healthcare systems can address various aspects of patient care effectively and holistically. Dimensions of Healthcare Quality and Performance of care include the following; Appropriateness, Availability, Competence, Continuity, Effectiveness, Efficiency, Efficacy, Prevention, Respect and Care, Safety as well as Timeliness.
ICH Guidelines for Pharmacovigilance.pdfNEHA GUPTA
The "ICH Guidelines for Pharmacovigilance" PDF provides a comprehensive overview of the International Council for Harmonisation of Technical Requirements for Pharmaceuticals for Human Use (ICH) guidelines related to pharmacovigilance. These guidelines aim to ensure that drugs are safe and effective for patients by monitoring and assessing adverse effects, ensuring proper reporting systems, and improving risk management practices. The document is essential for professionals in the pharmaceutical industry, regulatory authorities, and healthcare providers, offering detailed procedures and standards for pharmacovigilance activities to enhance drug safety and protect public health.
The Importance of Community Nursing Care.pdfAD Healthcare
NDIS and Community 24/7 Nursing Care is a specific type of support that may be provided under the NDIS for individuals with complex medical needs who require ongoing nursing care in a community setting, such as their home or a supported accommodation facility.
Navigating Challenges: Mental Health, Legislation, and the Prison System in B...Guillermo Rivera
This conference will delve into the intricate intersections between mental health, legal frameworks, and the prison system in Bolivia. It aims to provide a comprehensive overview of the current challenges faced by mental health professionals working within the legislative and correctional landscapes. Topics of discussion will include the prevalence and impact of mental health issues among the incarcerated population, the effectiveness of existing mental health policies and legislation, and potential reforms to enhance the mental health support system within prisons.
Medical Technology Tackles New Health Care Demand - Research Report - March 2...pchutichetpong
M Capital Group (“MCG”) predicts that with, against, despite, and even without the global pandemic, the medical technology (MedTech) industry shows signs of continuous healthy growth, driven by smaller, faster, and cheaper devices, growing demand for home-based applications, technological innovation, strategic acquisitions, investments, and SPAC listings. MCG predicts that this should reflects itself in annual growth of over 6%, well beyond 2028.
According to Chris Mouchabhani, Managing Partner at M Capital Group, “Despite all economic scenarios that one may consider, beyond overall economic shocks, medical technology should remain one of the most promising and robust sectors over the short to medium term and well beyond 2028.”
There is a movement towards home-based care for the elderly, next generation scanning and MRI devices, wearable technology, artificial intelligence incorporation, and online connectivity. Experts also see a focus on predictive, preventive, personalized, participatory, and precision medicine, with rising levels of integration of home care and technological innovation.
The average cost of treatment has been rising across the board, creating additional financial burdens to governments, healthcare providers and insurance companies. According to MCG, cost-per-inpatient-stay in the United States alone rose on average annually by over 13% between 2014 to 2021, leading MedTech to focus research efforts on optimized medical equipment at lower price points, whilst emphasizing portability and ease of use. Namely, 46% of the 1,008 medical technology companies in the 2021 MedTech Innovator (“MTI”) database are focusing on prevention, wellness, detection, or diagnosis, signaling a clear push for preventive care to also tackle costs.
In addition, there has also been a lasting impact on consumer and medical demand for home care, supported by the pandemic. Lockdowns, closure of care facilities, and healthcare systems subjected to capacity pressure, accelerated demand away from traditional inpatient care. Now, outpatient care solutions are driving industry production, with nearly 70% of recent diagnostics start-up companies producing products in areas such as ambulatory clinics, at-home care, and self-administered diagnostics.
Deep Leg Vein Thrombosis (DVT): Meaning, Causes, Symptoms, Treatment, and Mor...The Lifesciences Magazine
Deep Leg Vein Thrombosis occurs when a blood clot forms in one or more of the deep veins in the legs. These clots can impede blood flow, leading to severe complications.
CHAPTER 1 SEMESTER V - ROLE OF PEADIATRIC NURSE.pdfSachin Sharma
Pediatric nurses play a vital role in the health and well-being of children. Their responsibilities are wide-ranging, and their objectives can be categorized into several key areas:
1. Direct Patient Care:
Objective: Provide comprehensive and compassionate care to infants, children, and adolescents in various healthcare settings (hospitals, clinics, etc.).
This includes tasks like:
Monitoring vital signs and physical condition.
Administering medications and treatments.
Performing procedures as directed by doctors.
Assisting with daily living activities (bathing, feeding).
Providing emotional support and pain management.
2. Health Promotion and Education:
Objective: Promote healthy behaviors and educate children, families, and communities about preventive healthcare.
This includes tasks like:
Administering vaccinations.
Providing education on nutrition, hygiene, and development.
Offering breastfeeding and childbirth support.
Counseling families on safety and injury prevention.
3. Collaboration and Advocacy:
Objective: Collaborate effectively with doctors, social workers, therapists, and other healthcare professionals to ensure coordinated care for children.
Objective: Advocate for the rights and best interests of their patients, especially when children cannot speak for themselves.
This includes tasks like:
Communicating effectively with healthcare teams.
Identifying and addressing potential risks to child welfare.
Educating families about their child's condition and treatment options.
4. Professional Development and Research:
Objective: Stay up-to-date on the latest advancements in pediatric healthcare through continuing education and research.
Objective: Contribute to improving the quality of care for children by participating in research initiatives.
This includes tasks like:
Attending workshops and conferences on pediatric nursing.
Participating in clinical trials related to child health.
Implementing evidence-based practices into their daily routines.
By fulfilling these objectives, pediatric nurses play a crucial role in ensuring the optimal health and well-being of children throughout all stages of their development.
5. • Big Data: The Management
Revolution
• Data Scientist: The Sexiest Job
of the 21st Century
• Making Advanced Analytics Work
for You
Hot Off the Press
Table of Contents: October 2012
RAY GENSINGER 2012 5Harvard Business Review, October 2012
6. The New Economy?
RAY GENSINGER 2012 6
“Data is the new oil; it is both
valuable and plentiful but useless
if unrefined” – Clive Humbly, visiting professor of
integrated marketing, Northwestern University
7. Industry Analytics: Baseball
RAY GENSINGER 2012 7
• Commentator:
“ It’s a cold one tonight…Joe
Mauer is up and is facing Phil
Hughes. Joe has yet to get on
base against Hughes so he’s
about due…That could be unlikely
though given the temperature.
Joe’s OBP is about 0.125 lower
when the temperature is less than
50 degrees out.”
Sunday Night Baseball
• Infrastructure:
• Every play of every game
captured
• Sabremetrics
• Detailed meteorological data
• Situational metadata
• Runs in the season
• Men on base
• Current count
8. Industry Analytics: Baseball
RAY GENSINGER 2012 8
Historically
• Gut reactions of scouts
• Performance to date
• Batting average
• Hits only
• Compensation based on
individual performance at the
plate
Oakland A’s: Moneyball
Innovation
• Winners score more runs
• Runs score after you have a
base runner
• Who gets on base the most
• On base percentage
• Hits
• Walks
• Analysis of the interactions and
performance of players in relation
to each other
9. Industry Analytics: Baseball
RAY GENSINGER 2012 9
• Season ticket prices set for entire season
• Individual game tickets priced prior to season starting based on last seasons
data
• Popularity of opponent
• Attendance of last seasons games
• Once season starts the game prices vary daily
• Popularity of home and away teams
• Streaking teams or players
• Weather trends
Minnesota Twins: Variable Ticket Pricing
10. • Data rich
• Information intensive
• Asset intensive
• Time dependence
• Quality control essential
• Dependence on distributed
decision making
Healthcare and Analytics
RAY GENSINGER 2012 11
http://www.madisonshope.com/images/Latest/Madison%20in%20ICU%20with%20all%20her%20support%20equipment.jpg
11. • Descriptive analytics provides
simple summaries about the
sample and about the observations
that have been made. Such
summaries may be either
quantitative, i.e. summary
statistics, or visual, i.e. simple-to-
understand graphs. These
summaries may either form the
basis of the initial description of
the data as part of a more
extensive statistical analysis, or
they may be sufficient in and of
themselves for a particular
investigation.
Descriptive Analytics
12http://quiqle.info/8731-how-to-read-a-bell-curve.html
12. • O/E Readmissions .99
(0.9 threshold)
• Optimal asthma care 56.7%
(42.3% threshold)
• Optimal diabetes care 37.4%
(32.9% threshold)
• Breast cancer screening 74.5%
(75% threshold)
• Patient rating of care 72.8%
(71.3% threshold)
• Kevin Love scores 26 points per game
• Kevin Love gets 13 rebounds per game
• Kevin Love plays 39/48 min per game
• Kevin Love has a .448 shooting
percentage
• Ricky Rubio hands out 8 assists per
game
• Ricky Rubio plays 34/48 min per game
• Timberwolves final record was 26-39
(.400)
Descriptive Analytics: Example
Sports Analogy (published) Healthcare Analogy
13
13. • Predictive analytics is an area of
statistical analysis that deals with
extracting information from data
and using it to predict future trends
and behavior patterns. The core of
predictive analytics relies on
capturing relationships between
explanatory variables and the
predicted variables from past
occurrences, and exploiting it to
predict future outcomes. It is
important to note, however, that
the accuracy and usability of
results will depend greatly on the
level of data analysis and the
quality of assumptions.
Predictive Analytics
14http://www.simafore.com/blog/bid/78815/Does-LinkedIn-group-growth-mirror-
Predictive-Analytics-hype-cycle
14. • 50% of all readmission that are
diagnosed with heart failure and
go home on more than 10
medications, but lacking an ACE
or ARB
• Pre-diabetic patients from NE
Minneapolis age 25-35 are 77%
more likely to go on to diabetes
than typical pre-diabetics
• Kevin Love increases his
shooting percentage by 0.15
when Rubio is on the floor
• Winning percentage increase
from 0.4 to 0.45 when both Love
and Rubio play a minimum of 35
minutes
• Other players shooting
percentage drops 0.08 when
Love and Rubio are on the floor
together
Predictive Analytics: Example
Sports Analogy Healthcare Analogy
15
15. Prescriptive Analytics
16
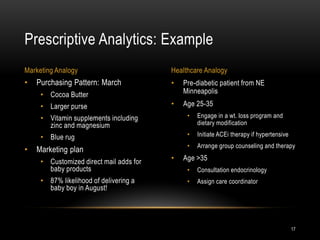
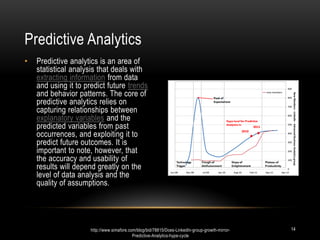
• The final analytic phase is Prescriptive Analytics.[3] Prescriptive Analytics
goes beyond predicting future outcomes by also suggesting actions to
benefit from the predictions and showing the decision maker the implications
of each decision option.[4] Prescriptive Analytics not only anticipates what will
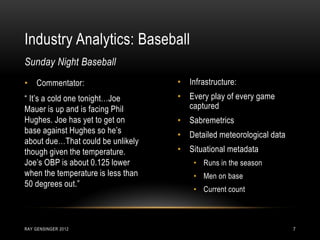
happen and when it will happen, but also why it will happen. Further,
Prescriptive Analytics can suggest decision options on how to take
advantage of a future opportunity or mitigate a future risk and illustrate the
implication of each decision option. In practice, Prescriptive Analytics can
continually and automatically process new data to improve prediction
accuracy and provide better decision options.
16. • Pre-diabetic patient from NE
Minneapolis
• Age 25-35
• Engage in a wt. loss program and
dietary modification
• Initiate ACEi therapy if hypertensive
• Arrange group counseling and therapy
• Age >35
• Consultation endocrinology
• Assign care coordinator
• Purchasing Pattern: March
• Cocoa Butter
• Larger purse
• Vitamin supplements including
zinc and magnesium
• Blue rug
• Marketing plan
• Customized direct mail adds for
baby products
• 87% likelihood of delivering a
baby boy in August!
Prescriptive Analytics: Example
Marketing Analogy Healthcare Analogy
17
18. Questions To Be Addressed
RAY GENSINGER 2012 20Adapted from Analytics at Work. Davenport, Harris, and Morison
What happened?
(reporting)
What IS happening
now?
(alerts)
What WILL happen?
(extrapolation)
How and why DID it
happen?
(modeling, experiment)
What’s the NEXT best
action?
(recommendation)
What’s the best/worst
that CAN happen?
(predict, simulate)
19. When Are Analytics NOT Helpful?
RAY GENSINGER 2012 21
• When there is no time………………………………..Answers needed now
• When there is no precedent…………………………Falling housing prices
• When history is misleading
• Highly variable history…………………………………Major economic turmoil
• Highly experience decision maker (wisdom)………The proven expert
• Immeasurable variables………………………………Emotion, family situation
20. • Carelessness (Mars Orbiter)
• Failing to consider analysis and
insights
• Failing to consider alternatives
• Waiting too long to gather data
• Postponing decisions
• Asking the wrong questions
• Starting with incorrect
assumptions (housing prices will
continue to rise)
• Finding an analytic that identifies
the answer you were seeking
• Failing to fully understand
alternative of data interpretation
Decision Making Errors
Logic Errors Process Errors
RAY GENSINGER 2012 22
21. Organizational Analytic Readiness
RAY GENSINGER 2012 23
• Analytically Impaired
• Lacking skills, data, or leadership
• Localize Analytics
• Disparate glimmers lacking in coordination
• Analytic Aspirations
• Willingness but lacking in a DELTA element
• Analytic Companies
• Tools and people but hasn’t turned content into a competitive advantage
• Analytic Competitors
• Uses knowledge gained to compete and succeed
Five Stages of Development
23. Analytics Success
RAY GENSINGER 2012 25
• The Trouble with cubes
• Unstructured data is a lot like panning for gold, first you sift a lot of dirt
• Uniqueness
• What is it that you have that NOBODY else has
• Nike+ running sensors
• Best Buy Reward Zone
• Health Insurance Companies
• Integration through key identifiers
• Quality is less necessary secondary to the volume of data available
Data
24. Understanding the “Mass” of DATA
• Volume
• World generates 2.5 exabytes of internet traffic each day (zetabyte annually)
• One second of traffic today equals the totality of traffic in all of 1992
• Exabyte
• 1000 petabytes
• 1000 terabytes
• 1000 gigabytes
• 1000 megabytes
• 1,000,000,000,000,000,000 bytes = 1 quintillion bytes
26RAY GENSINGER 2012
28. Analytics Success
RAY GENSINGER 2012 30
• Integration of data from across the organizational silos
• Disparate data isn’t local or independent, it is FRACTURED
• Duplication of resources, services, licenses, subscriptions
• IT Leadership
• Guide the work that matters
• Create an infrastructure that can be widely leveraged
• Share a roadmap with both short and long term success strategies
Enterprise
29. Analytics Success
RAY GENSINGER 2012 31
• There has to be a recognizable name and title behind the strategy; preferably
a CxO
• Hire smart people and recognize them for what the contribute
• Demand data and analysis for all decisions to be made
• Balance analysis, experience, wisdom
• Invest in the necessary infrastructure as a strategic imperative along with
any other high profile strategy
Leadership
30. Analytics Success
RAY GENSINGER 2012 32
• What is it PRECISELY that you would like to achieve?
• Retail:
• Inventory management, price optimization
• Hospitality
• Customer loyalty
• Healthcare
• Maximize accuracy of initial diagnoses
• Highest value care path…Expected outcomes or better at the lowest cost
• Discover opportunities for differentiation
• Goals
• Eliminate the exodus of patients
Targets: What to Achieve
31. Analytics Success
RAY GENSINGER 2012 33
• Complex work streams with many variables or steps
• Simple decisions require absolute consistency
• When an entire service line is in need of attention
• Processes that require complex inputs, connections, and correlations
• Anywhere forecasting is necessary
• Current areas of below average performance
Targets: Where to Achieve
32. Answer the Questions: Set the Targets
RAY GENSINGER 2012 34
What happened?
(reporting)
What IS happening
now?
(alerts)
What WILL happen?
(extrapolation)
How and why DID it
happen?
(modeling, experiment)
What’s the NEXT best
action?
(recommendation)
What’s the best/worst
that CAN happen?
(predict, simulate)
Dr. Surgeon’s cases
start 30-45 minutes
late
Room C, Dr.
Surgeon’s, 30 minutes
behind schedule
Nurses in Dr.
Surgeon’s rooms will
require OT, annual
costs determined
Dr. Surgeon clocks into
the the parking ramp
15 minutes late daily
Schedule a quick case
early morning ahead of
Dr. Surgeon
Start times consistent,
OT drops,
Revenue/case
increases, Dr. Surgeon
quits; either way
finances better
33. Target = Growth
Strategy = Employee Retention
RAY GENSINGER 2012 35Adapted from the “Putting the Service Profit Chain to Work,” HBR, Mar-Apr,
1994.
Internal Services Enhancing Quality for all Employees
Enhance
environment
Flexible staffing
Financial
benefits
Growth
opportunities
Enhanced Employee Satisfaction
Improved
attendance
Employee
retention
Employee
productivity
Enhanced Patient Experience
Consistent
services
Improved
interactions
Empathetic
environment
Service oriented
Improved Patient Satisfaction
Retention
Word of mouth
Social media
accolades
Employer
expectations
Patient Loyalty
Better outcomes
Increased
market share
Revenue growth
Profit
34. Analytics Success
RAY GENSINGER 2012 36
• Analytic Champions: <1%
• Executive decision makers hooked on analysis
• Willing to change the business based on the results
• Analytic Professionals: 5-10%
• PhDs in economics, statistics, research methods, mathematics (or evaluation
studies)
• Programmers and statistical model developers
• Analytic Semi-professionals 15-20%
• MBAs or process improvement experts
• Apply and work the models and theories of the champions and pros
Analysts: Skills and Backgrounds
35. Analytics Success
RAY GENSINGER 2012 37
• Analytic Amateurs: 70-80%
• Knowledgeable consumers of data
• Business managers operating a business unit or help desk staff trying to
anticipate the source of a system error
• The Farm Team
• Curious innovators from around the company
• Ask questions challenging the status quo
• Experiences unrelated to healthcare but knowledgeable about math and
statistics
Analysts: Skills and Backgrounds, cont.
37. • Good to great salary
• Opportunity to create something
new
• Recognition
• Lots of unstructured data
• Autonomy
• Access to “the Bridge”
• Know where to look
How to Catch a Quant
The Really Big Fish You Need the Right Kind of Lure!
RAY GENSINGER 2012 39http://www.dnr.state.oh.us/Default.aspx?tabid=19220
38. RAY GENSINGER 2012 40
Let them know you are interested in how they contribute to the field
Ask them how their work can apply to business challenges
Offer them a challenge to evaluate as part of the interview
Assess their coding/programming skills
Host a competition
Check with your local venture capitalist
Scan through LinkedIn (who do you think created this anyway)
Scan through the “R user groups” (http://blog.revolutionanalytics.com/local-r-
groups.html)
Large universities as well as the unknowns (UT Austin, UC Santa Cruz)
Hang out at Hadoop World (http://www.hadoopworld.com/)
Top Ten Ways to Find a Quant
39. RAY GENSINGER 2012 41
http://www.talend.com/blog/2010/10/14/a-great-hadoop-world-congratulations-to-cloudera/
40. Analytics Success
RAY GENSINGER 2012 42
• Data is a statistician’s crack,
once you have a sample you
can possibly get enough”.
Analysts: Organizing and Developing
Corporate
Division
Analytics
Group
Analytics
Project
Function
Analytics
Group
Analytics
Project
Center of
Excellence
44. References
• http://youtu.be/bVY7OmYqBSY
• Davenport, T., Harris, J., Morsion, R. Analytics at Work: Smarter Decisions, Better Results. Harvard
Business Press. Boston, Massachusetts. 2010.
• http://www.simafore.com/blog/bid/78815/Does-LinkedIn-group-growth-mirror-Predictive-Analytics-hype-cycle
• Adapted from the “Putting the Service Profit Chain to Work,” HBR, Mar-Apr, 1994.
• http://media-cache-ec6.pinterest.com/upload/272327108688186258_0HugpL3c.jpg
• http://quiqle.info/8731-how-to-read-a-bell-curve.html
• http://www.madisonshope.com/images/Latest/Madison%20in%20ICU%20with%20all%20her%20support%20
equipment.jpg
• McAfee, A., Brynjolfsson, E. Big Data: The Management of Revolution. Harvard Business Review. 2012;
90(10):60-69.
• Davenport, T, Patil, DJ. Data Scientist: The Sexiest Job of the 21st Century. Harvard Business Review. 2012;
90(10):70-77.
• Barton, D., Court, D. Making Advanced Analytics Work for You. Harvard Business Review. 2012; 90(10):78-
83.
• http://www.dnr.state.oh.us/Default.aspx?tabid=19220
47RAY GENSINGER 2012