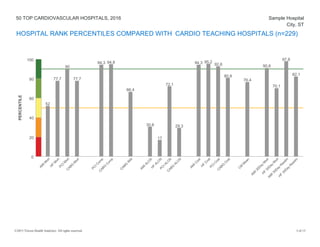
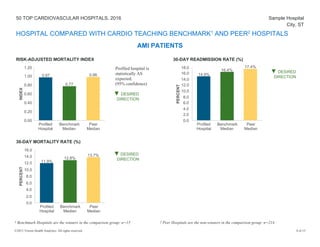
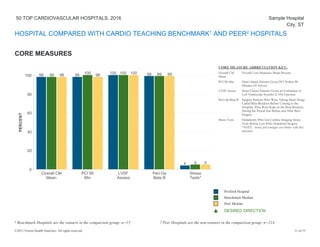
50 TOP CARDIOVASCULAR HOSPITALS, 2016
A NATIONAL BENCHMARKS REPORT
Performance Report Prepared For:
Sample Hospital
City, ST
MEDICARE ID: 999999
50 TOP CARDIOVASCULAR HOSPITALS, 2016 Sample Hospital
City, ST
REPORT NOTES
Comparison Groups
So that we can compare your hospital with others most like it, we assign
each hospital to one of three comparison groups according to size, teaching
status, and residency/fellowship program involvement:
• Teaching hospitals with cardiovascular residency programs
(CARDIO TEACHING)
• Teaching hospitals without cardiovascular residency programs
(TEACHING)
• Community hospitals (COMMUNITY)
Benchmark and Peer Groups
In the Truven Health Analytics 50 Top Cardiovascular Hospitals study, we
select 50 Benchmark hospitals (winners) based on overall performance in
the most recent year of data available:
CARDIO TEACHING 15
TEACHING 20
COMMUNITY 15
Peer group hospitals include all U.S. hospitals in our study database,
excluding benchmark hospitals.
In this custom report, we provide two types of comparisons:
• Profiled hospital versus comparison group Benchmark hospitals
• Profiled hospital versus comparison group Peer hospitals
Measure Categories and Patient Groups
We include data for acute myocardial infarction (AMI), heart failure (HF),
coronary artery bypass graft (CABG) and primary percutaneous coronary
intervention (PCI) patients in our analysis.
Measure Category Pt Groups Measure Category Pt Groups
Medical Mortality AMI, HF % CABG with IMA CABG
Surgical Mortality CABG, PCI 30 Day Measures AMI, HF
Complications CABG, PCI Avg Length of Stay All
Core Measures AMI, HF, SCIP, OUTPAT Cost per Case All
Public Data Sets Used
Measures Public Data Sources
Mortality, Complications MedPAR Federal Fiscal Yr 2013-2014
ALOS, Cost per Case MedPAR FFY 2014
Core Measures
CMS Hospital Compare (CMSHC)
Oct 1, 2013 - Sep 30, 2014
30-Day Mortality CMSHC July 1, 2011 - June 30, 2014
30-Day Readmissions CMSHC July 1, 2011 - June 30, 2014
Cost to Charge Ratio Medicare Cost Report 2014
Use of Median Values
When individual core measures (CMs), 30-day mortality or 30-day
readmission rates are missing or the reported value is insufficiently precise
(patient count too low), we substitute class median values for the hospital
value(s). We do this to allow overall ranking of the hospital.
Note: Hospitals missing all CMs, all 30-day mortality or all 30-day
readmission measures are excluded from the study.
Missing Data or Incalculable Data Points
• No bar is displayed for the profiled hospital if values were not
reported, are incalculable, or where the median was used.
• If a hospital was excluded from the study for missing or incalculable
performance measures, we note the details at the end of the report.
Winner Exclusions
A hospital was not eligible to be a winner if one of the following applied:
• Statistically poor performance in mortality or complications (95%
confidence).
• One or more outliers (interquartile range methodology) for wage- and
severity-adjusted cost per case.
• Less than 11 cases in any of the patient groups (AMI, HF, CABG,
PCI) for the current data year (2014).
FOR MORE INFORMATION
For a Study Abstract, with full details on performance measures,
methods used and winner list, visit www.100tophospitals.com.
©2015 Truven Health Analytics. All rights reserved. 2 of 15
50 TOP CARDIOVASCULAR HOSPITALS, 2016 Sample Hospital
City, ST
HOSPITAL RANK PERCENTILES COMPARED WITH CARDIO TEACHING HOSPITALS (n=229)
0
20
40
60
80
100
AM
IM
ort
H
F
M
ortPC
IM
ortC
ABG
M
ort
PC
IC
om
p
C
ABG
C
om
p
C
ABG
IM
A
AM
IALO
SH
F
ALO
SPC
IALO
S
C
ABG
ALO
S
AM
IC
ost
H
F
C
ostPC
IC
ostC
ABG
C
ost
C
M
M
ean
AM
I30D
ay
M
ort
H
F
30D
ay
M
ort
AM
I30D
ay
R
eadm
H
F
30D
ay
R
eadm
52
77.7
90
77.7
94.3 94.8
66.4
30.6
17
72.1
29.3
94.3 95.2
92.6
80.8
76.4
90.8
70.1
97.8
82.1
PERCENTILE
©2015 Truven Health Analytics. All rights reserved. 3 of 15
50 TOP CARDIOVASCULAR HOSPITALS, 2016 Sample Hospital
City, ST
HOSPITAL COMPARED WITH CARDIO TEACHING BENCHMARK1
AND PEER2
HOSPITALS
AMI PATIENTS
RISK-ADJUSTED MORTALITY INDEX 30-DAY READMISSION RATE (%)
0.00
0.20
0.40
0.60
0.80
1.00
1.20
Profiled
Hospital
Benchmark
Median
Peer
Median
0.97
0.77
0.98
INDEX
Profiled hospital is
statistically AS
expected.
(95% confidence)
▼ DESIRED
DIRECTION
0.0
2.0
4.0
6.0
8.0
10.0
12.0
14.0
16.0
18.0
Profiled
Hospital
Benchmark
Median
Peer
Median
14.9%
16.4%
17.4%
PERCENT
▼ DESIRED
DIRECTION
30-DAY MORTALITY RATE (%)
0.0
2.0
4.0
6.0
8.0
10.0
12.0
14.0
16.0
Profiled
Hospital
Benchmark
Median
Peer
Median
11.9%
12.8%
13.7%
PERCENT
▼ DESIRED
DIRECTION
1 Benchmark Hospitals are the winners in the comparison group: n=15 2 Peer Hospitals are the non-winners in the comparison group: n=214
©2015 Truven Health Analytics. All rights reserved. 4 of 15
50 TOP CARDIOVASCULAR HOSPITALS, 2016 Sample Hospital
City, ST
HOSPITAL COMPARED WITH CARDIO TEACHING BENCHMARK1
AND PEER2
HOSPITALS
AMI PATIENTS
SEVERITY-ADJUSTED AVERAGE LENGTH OF STAY
0.0
1.0
2.0
3.0
4.0
5.0
Profiled
Hospital
Benchmark
Median
Peer
Median
4.70
3.70
4.40
DAYS
▼ DESIRED
DIRECTION
jjjjjjjjjjjjjjjjjjjjjjjjjjjjjjjjjjjjjjjjjjjjjjjjjjjjjjjjjjjjjjjjjjjjjjjjj
▼ DESIRED
DIRECTION
WAGE- AND SEVERITY-ADJUSTED COST PER CASE
0
2,000
4,000
6,000
8,000
10,000
12,000
Profiled
Hospital
Benchmark
Median
Peer
Median
$7,071
$7,820
$9,992
DOLLARS
▼ DESIRED
DIRECTION
▼ DESIRED
DIRECTION
1 Benchmark Hospitals are the winners in the comparison group: n=15 2 Peer Hospitals are the non-winners in the comparison group: n=214
©2015 Truven Health Analytics. All rights reserved. 5 of 15
50 TOP CARDIOVASCULAR HOSPITALS, 2016 Sample Hospital
City, ST
HOSPITAL COMPARED WITH CARDIO TEACHING BENCHMARK1
AND PEER2
HOSPITALS
HF PATIENTS
RISK-ADJUSTED MORTALITY INDEX 30-DAY READMISSION RATE (%)
0.00
0.20
0.40
0.60
0.80
1.00
1.20
Profiled
Hospital
Benchmark
Median
Peer
Median
0.87
0.77
1.02
INDEX
Profiled hospital is
statistically AS
expected.
(95% confidence)
▼ DESIRED
DIRECTION
0.0
4.0
8.0
12.0
16.0
20.0
24.0
Profiled
Hospital
Benchmark
Median
Peer
Median
20.7% 21.1%
22.3%
PERCENT
▼ DESIRED
DIRECTION
30-DAY MORTALITY RATE (%)
0.0
2.0
4.0
6.0
8.0
10.0
12.0
Profiled
Hospital
Benchmark
Median
Peer
Median
9.9% 9.9%
10.7%
PERCENT
▼ DESIRED
DIRECTION
1 Benchmark Hospitals are the winners in the comparison group: n=15 2 Peer Hospitals are the non-winners in the comparison group: n=214
©2015 Truven Health Analytics. All rights reserved. 6 of 15
50 TOP CARDIOVASCULAR HOSPITALS, 2016 Sample Hospital
City, ST
HOSPITAL COMPARED WITH CARDIO TEACHING BENCHMARK1
AND PEER2
HOSPITALS
HF PATIENTS
SEVERITY-ADJUSTED AVERAGE LENGTH OF STAY SEVERITY-ADJUSTED AVERAGE LENGTH OF STAY
0.0
1.0
2.0
3.0
4.0
5.0
6.0
Profiled
Hospital
Benchmark
Median
Peer
Median
5.50
4.10
4.90
DAYS
▼ DESIRED
DIRECTION
▼ DESIRED
DIRECTION
WAGE- AND SEVERITY-ADJUSTED COST PER CASE WAGE- AND SEVERITY-ADJUSTED COST PER CASE
0
2,000
4,000
6,000
8,000
10,000
Profiled
Hospital
Benchmark
Median
Peer
Median
$6,224
$7,090
$8,619
DOLLARS
▼ DESIRED
DIRECTION
▼ DESIRED
DIRECTION
1 Benchmark Hospitals are the winners in the comparison group: n=15 2 Peer Hospitals are the non-winners in the comparison group: n=214
©2015 Truven Health Analytics. All rights reserved. 7 of 15
50 TOP CARDIOVASCULAR HOSPITALS, 2016 Sample Hospital
City, ST
HOSPITAL COMPARED WITH CARDIO TEACHING BENCHMARK1
AND PEER2
HOSPITALS
CABG PATIENTS
RISK-ADJUSTED MORTALITY INDEX CABG w INTERNAL MAMMARY ARTERY USE (%)
0.00
0.20
0.40
0.60
0.80
1.00
Profiled
Hospital
Benchmark
Median
Peer
Median
0.75 0.72
0.91
INDEX
Profiled hospital is
statistically AS
expected.
(95% confidence)
▼ DESIRED
DIRECTION
0.0
20.0
40.0
60.0
80.0
100.0
Profiled
Hospital
Benchmark
Median
Peer
Median
97.0% 97.8% 95.7%
PERCENT
▲ DESIRED
DIRECTION
RISK-ADJUSTED COMPLICATIONS INDEX
0.00
0.20
0.40
0.60
0.80
1.00
Profiled
Hospital
Benchmark
Median
Peer
Median
0.84 0.85
0.96
INDEX
Profiled hospital is
statistically AS
expected.
(95% confidence)
▼ DESIRED
DIRECTION
1 Benchmark Hospitals are the winners in the comparison group: n=15 2 Peer Hospitals are the non-winners in the comparison group: n=214
©2015 Truven Health Analytics. All rights reserved. 8 of 15
50 TOP CARDIOVASCULAR HOSPITALS, 2016 Sample Hospital
City, ST
HOSPITAL COMPARED WITH CARDIO TEACHING BENCHMARK1
AND PEER2
HOSPITALS
CABG PATIENTS
SEVERITY-ADJUSTED AVERAGE LENGTH OF STAY
0.0
2.0
4.0
6.0
8.0
10.0
12.0
Profiled
Hospital
Benchmark
Median
Peer
Median
9.90
8.10
9.00
DAYS
▼ DESIRED
DIRECTION
WAGE- AND SEVERITY-ADJUSTED COST PER CASE
0
5,000
10,000
15,000
20,000
25,000
30,000
35,000
40,000
Profiled
Hospital
Benchmark
Median
Peer
Median
$32,015 $32,015
$38,980
DOLLARS
▼ DESIRED
DIRECTION
1 Benchmark Hospitals are the winners in the comparison group: n=15 2 Peer Hospitals are the non-winners in the comparison group: n=214
©2015 Truven Health Analytics. All rights reserved. 9 of 15
50 TOP CARDIOVASCULAR HOSPITALS, 2016 Sample Hospital
City, ST
HOSPITAL COMPARED WITH CARDIO TEACHING BENCHMARK1
AND PEER2
HOSPITALS
PCI PATIENTS
RISK-ADJUSTED MORTALITY INDEX SEVERITY-ADJUSTED AVERAGE LENGTH OF STAY
0.00
0.20
0.40
0.60
0.80
1.00
Profiled
Hospital
Benchmark
Median
Peer
Median
0.65
0.82
0.94
INDEX
Profiled hospital is
statistically AS
expected.
(95% confidence)
▼ DESIRED
DIRECTION
0.0
0.5
1.0
1.5
2.0
2.5
3.0
3.5
4.0
Profiled
Hospital
Benchmark
Median
Peer
Median
3.30 3.20
3.60
DAYS
▼ DESIRED
DIRECTION
RISK-ADJUSTED COMPLICATIONS INDEX WAGE- AND SEVERITY-ADJUSTED COST PER CASE
0.00
0.20
0.40
0.60
0.80
1.00
1.20
Profiled
Hospital
Benchmark
Median
Peer
Median
0.77
0.85
0.98
INDEX
Profiled hospital is
statistically AS
expected.
(95% confidence)
▼ DESIRED
DIRECTION
0
4,000
8,000
12,000
16,000
20,000
Profiled
Hospital
Benchmark
Median
Peer
Median
$12,499
$13,808
$18,372
DOLLARS
▼ DESIRED
DIRECTION
1 Benchmark Hospitals are the winners in the comparison group: n=15 2 Peer Hospitals are the non-winners in the comparison group: n=214
©2015 Truven Health Analytics. All rights reserved. 10 of 15
50 TOP CARDIOVASCULAR HOSPITALS, 2016 Sample Hospital
City, ST
HOSPITAL COMPARED WITH CARDIO TEACHING BENCHMARK1
AND PEER2
HOSPITALS
CORE MEASURES
0
20
40
60
80
100
Overall CM
Mean
PCI 90
Min
LVSF
Assess
Peri-Op
Beta B
Stress
Tests*
98 98
100 99
4
98
100 100 99
5
98 98
100 99
5
PERCENT
CORE MEASURE ABBREVIATION KEY:
Overall CM
Mean
Overall Core Measures Mean Percent
PCI 90 Min Heart Attack Patients Given PCI Within 90
Minutes Of Arrival
LVSF Assess Heart Failure Patients Given an Evaluation of
Left Ventricular Systolic (LVS) Function
Peri-Op Beta B Surgery Patients Who Were Taking Heart Drugs
Called Beta Blockers Before Coming to the
Hospital, Who Were Kept on the Beta Blockers
During the Period Just Before and After their
Surgery
Stress Tests Outpatients Who Got Cardiac Imaging Stress
Tests Before Low-Risk Outpatient Surgery
*NOTE: lower percentages are better with this
measure
Profiled Hospital
Benchmark Median
Peer Median
▲ DESIRED DIRECTION
1 Benchmark Hospitals are the winners in the comparison group: n=15 2 Peer Hospitals are the non-winners in the comparison group: n=214
©2015 Truven Health Analytics. All rights reserved. 11 of 15
50 TOP CARDIOVASCULAR HOSPITALS, 2016 Sample Hospital
City, ST
NEW METRICS UNDER CONSIDERATION
This section of your report contains measures that we are currently considering for
future inclusion in the study.
• Valve Patient Group - Clinical Outcome, Efficiency and Cost Measures
• Risk-adjusted mortality index
• Risk-adjusted complications index
• Severity-adjusted length of stay
• Wage- and severity-adjusted cost per case
• Extended Outcome Measures
• 30-day mortality rate for CABG patients
• 30-day readmission rate for CABG patients
• Episode of Care Payment Measures
• 30-day episode payment for AMI patients
• 30-day episode payment for HF patients
We welcome your comments and feedback on the usefulness and relevance of
these measures in assessing leadership's ability to drive high level balanced
performance.
©2015 Truven Health Analytics. All rights reserved. 12 of 15
50 TOP CARDIOVASCULAR HOSPITALS, 2016 Sample Hospital
City, ST
HOSPITAL COMPARED WITH CARDIO TEACHING BENCHMARK1
AND PEER2
HOSPITALS
VALVE PATIENTS
RISK-ADJUSTED MORTALITY INDEX SEVERITY-ADJUSTED AVERAGE LENGTH OF STAY
0.00
0.20
0.40
0.60
0.80
1.00
1.20
Profiled
Hospital
Benchmark
Median
Peer
Median
0.73
0.97 0.98
INDEX
Profiled hospital is
statistically AS
expected.
(95% confidence)
▼ DESIRED
DIRECTION
0.0
2.0
4.0
6.0
8.0
10.0
12.0
Profiled
Hospital
Benchmark
Median
Peer
Median
8.60 8.50
9.80
DAYS
▼ DESIRED
DIRECTION
RISK-ADJUSTED COMPLICATIONS INDEX WAGE- AND SEVERITY-ADJUSTED COST PER CASE
0.00
0.20
0.40
0.60
0.80
1.00
1.20
Profiled
Hospital
Benchmark
Median
Peer
Median
0.93 0.91
0.99
INDEX
Profiled hospital is
statistically AS
expected.
(95% confidence)
▼ DESIRED
DIRECTION
0
10,000
20,000
30,000
40,000
50,000
60,000
Profiled
Hospital
Benchmark
Median
Peer
Median
$39,540
$43,019
$52,089
DOLLARS
▼ DESIRED
DIRECTION
1 Benchmark Hospitals are the winners in the comparison group: n=15 2 Peer Hospitals are the non-winners in the comparison group: n=214
©2015 Truven Health Analytics. All rights reserved. 13 of 15
50 TOP CARDIOVASCULAR HOSPITALS, 2016 Sample Hospital
City, ST
HOSPITAL COMPARED WITH CARDIO TEACHING BENCHMARK1
AND PEER2
HOSPITALS
CABG PATIENTS
30-DAY MORTALITY RATE (%)
0.0
0.4
0.8
1.2
1.6
2.0
2.4
2.8
3.2
Profiled
Hospital
Benchmark
Median
Peer
Median
2.2%
2.7%
2.9%
PERCENT
▼ DESIRED
DIRECTION
jjjjjjjjjjjjjjjjjjjjjjjjjjjjjjjjjjjjjjjjjjjjjjjjjjjjjjjjjjjjjjjjjjjjjjjjj
▼ DESIRED
DIRECTION
30-DAY READMISSION RATE (%)
0.0
2.0
4.0
6.0
8.0
10.0
12.0
14.0
16.0
Profiled
Hospital
Benchmark
Median
Peer
Median
12.5%
15.4%
14.8%
PERCENT
▼ DESIRED
DIRECTION
▼ DESIRED
DIRECTION
1 Benchmark Hospitals are the winners in the comparison group: n=15 2 Peer Hospitals are the non-winners in the comparison group: n=214
©2015 Truven Health Analytics. All rights reserved. 14 of 15
50 TOP CARDIOVASCULAR HOSPITALS, 2016 Sample Hospital
City, ST
HOSPITAL COMPARED WITH CARDIO TEACHING BENCHMARK1
AND PEER2
HOSPITALS
AMI AND HF PATIENTS
AMI 30-DAY EPISODE PAYMENT
0
4,000
8,000
12,000
16,000
20,000
24,000
Profiled
Hospital
Benchmark
Median
Peer
Median
$20,425
$22,236 $22,886
DOLLARS
▼ DESIRED
DIRECTION
jjjjjjjjjjjjjjjjjjjjjjjjjjjjjjjjjjjjjjjjjjjjjjjjjjjjjjjjjjjjjjjjjjjjjjjjj
▼ DESIRED
DIRECTION
HF 30-DAY EPISODE PAYMENT
0
2,000
4,000
6,000
8,000
10,000
12,000
14,000
16,000
18,000
Profiled
Hospital
Benchmark
Median
Peer
Median
$15,444
$16,634 $16,489
DOLLARS
▼ DESIRED
DIRECTION
▼ DESIRED
DIRECTION
1 Benchmark Hospitals are the winners in the comparison group: n=15 2 Peer Hospitals are the non-winners in the comparison group: n=214
©2015 Truven Health Analytics. All rights reserved. 15 of 15

Benchmarking: Control Your Health Plan

  • 1.
    50 TOP CARDIOVASCULARHOSPITALS, 2016 A NATIONAL BENCHMARKS REPORT Performance Report Prepared For: Sample Hospital City, ST MEDICARE ID: 999999
  • 2.
    50 TOP CARDIOVASCULARHOSPITALS, 2016 Sample Hospital City, ST REPORT NOTES Comparison Groups So that we can compare your hospital with others most like it, we assign each hospital to one of three comparison groups according to size, teaching status, and residency/fellowship program involvement: • Teaching hospitals with cardiovascular residency programs (CARDIO TEACHING) • Teaching hospitals without cardiovascular residency programs (TEACHING) • Community hospitals (COMMUNITY) Benchmark and Peer Groups In the Truven Health Analytics 50 Top Cardiovascular Hospitals study, we select 50 Benchmark hospitals (winners) based on overall performance in the most recent year of data available: CARDIO TEACHING 15 TEACHING 20 COMMUNITY 15 Peer group hospitals include all U.S. hospitals in our study database, excluding benchmark hospitals. In this custom report, we provide two types of comparisons: • Profiled hospital versus comparison group Benchmark hospitals • Profiled hospital versus comparison group Peer hospitals Measure Categories and Patient Groups We include data for acute myocardial infarction (AMI), heart failure (HF), coronary artery bypass graft (CABG) and primary percutaneous coronary intervention (PCI) patients in our analysis. Measure Category Pt Groups Measure Category Pt Groups Medical Mortality AMI, HF % CABG with IMA CABG Surgical Mortality CABG, PCI 30 Day Measures AMI, HF Complications CABG, PCI Avg Length of Stay All Core Measures AMI, HF, SCIP, OUTPAT Cost per Case All Public Data Sets Used Measures Public Data Sources Mortality, Complications MedPAR Federal Fiscal Yr 2013-2014 ALOS, Cost per Case MedPAR FFY 2014 Core Measures CMS Hospital Compare (CMSHC) Oct 1, 2013 - Sep 30, 2014 30-Day Mortality CMSHC July 1, 2011 - June 30, 2014 30-Day Readmissions CMSHC July 1, 2011 - June 30, 2014 Cost to Charge Ratio Medicare Cost Report 2014 Use of Median Values When individual core measures (CMs), 30-day mortality or 30-day readmission rates are missing or the reported value is insufficiently precise (patient count too low), we substitute class median values for the hospital value(s). We do this to allow overall ranking of the hospital. Note: Hospitals missing all CMs, all 30-day mortality or all 30-day readmission measures are excluded from the study. Missing Data or Incalculable Data Points • No bar is displayed for the profiled hospital if values were not reported, are incalculable, or where the median was used. • If a hospital was excluded from the study for missing or incalculable performance measures, we note the details at the end of the report. Winner Exclusions A hospital was not eligible to be a winner if one of the following applied: • Statistically poor performance in mortality or complications (95% confidence). • One or more outliers (interquartile range methodology) for wage- and severity-adjusted cost per case. • Less than 11 cases in any of the patient groups (AMI, HF, CABG, PCI) for the current data year (2014). FOR MORE INFORMATION For a Study Abstract, with full details on performance measures, methods used and winner list, visit www.100tophospitals.com. ©2015 Truven Health Analytics. All rights reserved. 2 of 15
  • 3.
    50 TOP CARDIOVASCULARHOSPITALS, 2016 Sample Hospital City, ST HOSPITAL RANK PERCENTILES COMPARED WITH CARDIO TEACHING HOSPITALS (n=229) 0 20 40 60 80 100 AM IM ort H F M ortPC IM ortC ABG M ort PC IC om p C ABG C om p C ABG IM A AM IALO SH F ALO SPC IALO S C ABG ALO S AM IC ost H F C ostPC IC ostC ABG C ost C M M ean AM I30D ay M ort H F 30D ay M ort AM I30D ay R eadm H F 30D ay R eadm 52 77.7 90 77.7 94.3 94.8 66.4 30.6 17 72.1 29.3 94.3 95.2 92.6 80.8 76.4 90.8 70.1 97.8 82.1 PERCENTILE ©2015 Truven Health Analytics. All rights reserved. 3 of 15
  • 4.
    50 TOP CARDIOVASCULARHOSPITALS, 2016 Sample Hospital City, ST HOSPITAL COMPARED WITH CARDIO TEACHING BENCHMARK1 AND PEER2 HOSPITALS AMI PATIENTS RISK-ADJUSTED MORTALITY INDEX 30-DAY READMISSION RATE (%) 0.00 0.20 0.40 0.60 0.80 1.00 1.20 Profiled Hospital Benchmark Median Peer Median 0.97 0.77 0.98 INDEX Profiled hospital is statistically AS expected. (95% confidence) ▼ DESIRED DIRECTION 0.0 2.0 4.0 6.0 8.0 10.0 12.0 14.0 16.0 18.0 Profiled Hospital Benchmark Median Peer Median 14.9% 16.4% 17.4% PERCENT ▼ DESIRED DIRECTION 30-DAY MORTALITY RATE (%) 0.0 2.0 4.0 6.0 8.0 10.0 12.0 14.0 16.0 Profiled Hospital Benchmark Median Peer Median 11.9% 12.8% 13.7% PERCENT ▼ DESIRED DIRECTION 1 Benchmark Hospitals are the winners in the comparison group: n=15 2 Peer Hospitals are the non-winners in the comparison group: n=214 ©2015 Truven Health Analytics. All rights reserved. 4 of 15
  • 5.
    50 TOP CARDIOVASCULARHOSPITALS, 2016 Sample Hospital City, ST HOSPITAL COMPARED WITH CARDIO TEACHING BENCHMARK1 AND PEER2 HOSPITALS AMI PATIENTS SEVERITY-ADJUSTED AVERAGE LENGTH OF STAY 0.0 1.0 2.0 3.0 4.0 5.0 Profiled Hospital Benchmark Median Peer Median 4.70 3.70 4.40 DAYS ▼ DESIRED DIRECTION jjjjjjjjjjjjjjjjjjjjjjjjjjjjjjjjjjjjjjjjjjjjjjjjjjjjjjjjjjjjjjjjjjjjjjjjj ▼ DESIRED DIRECTION WAGE- AND SEVERITY-ADJUSTED COST PER CASE 0 2,000 4,000 6,000 8,000 10,000 12,000 Profiled Hospital Benchmark Median Peer Median $7,071 $7,820 $9,992 DOLLARS ▼ DESIRED DIRECTION ▼ DESIRED DIRECTION 1 Benchmark Hospitals are the winners in the comparison group: n=15 2 Peer Hospitals are the non-winners in the comparison group: n=214 ©2015 Truven Health Analytics. All rights reserved. 5 of 15
  • 6.
    50 TOP CARDIOVASCULARHOSPITALS, 2016 Sample Hospital City, ST HOSPITAL COMPARED WITH CARDIO TEACHING BENCHMARK1 AND PEER2 HOSPITALS HF PATIENTS RISK-ADJUSTED MORTALITY INDEX 30-DAY READMISSION RATE (%) 0.00 0.20 0.40 0.60 0.80 1.00 1.20 Profiled Hospital Benchmark Median Peer Median 0.87 0.77 1.02 INDEX Profiled hospital is statistically AS expected. (95% confidence) ▼ DESIRED DIRECTION 0.0 4.0 8.0 12.0 16.0 20.0 24.0 Profiled Hospital Benchmark Median Peer Median 20.7% 21.1% 22.3% PERCENT ▼ DESIRED DIRECTION 30-DAY MORTALITY RATE (%) 0.0 2.0 4.0 6.0 8.0 10.0 12.0 Profiled Hospital Benchmark Median Peer Median 9.9% 9.9% 10.7% PERCENT ▼ DESIRED DIRECTION 1 Benchmark Hospitals are the winners in the comparison group: n=15 2 Peer Hospitals are the non-winners in the comparison group: n=214 ©2015 Truven Health Analytics. All rights reserved. 6 of 15
  • 7.
    50 TOP CARDIOVASCULARHOSPITALS, 2016 Sample Hospital City, ST HOSPITAL COMPARED WITH CARDIO TEACHING BENCHMARK1 AND PEER2 HOSPITALS HF PATIENTS SEVERITY-ADJUSTED AVERAGE LENGTH OF STAY SEVERITY-ADJUSTED AVERAGE LENGTH OF STAY 0.0 1.0 2.0 3.0 4.0 5.0 6.0 Profiled Hospital Benchmark Median Peer Median 5.50 4.10 4.90 DAYS ▼ DESIRED DIRECTION ▼ DESIRED DIRECTION WAGE- AND SEVERITY-ADJUSTED COST PER CASE WAGE- AND SEVERITY-ADJUSTED COST PER CASE 0 2,000 4,000 6,000 8,000 10,000 Profiled Hospital Benchmark Median Peer Median $6,224 $7,090 $8,619 DOLLARS ▼ DESIRED DIRECTION ▼ DESIRED DIRECTION 1 Benchmark Hospitals are the winners in the comparison group: n=15 2 Peer Hospitals are the non-winners in the comparison group: n=214 ©2015 Truven Health Analytics. All rights reserved. 7 of 15
  • 8.
    50 TOP CARDIOVASCULARHOSPITALS, 2016 Sample Hospital City, ST HOSPITAL COMPARED WITH CARDIO TEACHING BENCHMARK1 AND PEER2 HOSPITALS CABG PATIENTS RISK-ADJUSTED MORTALITY INDEX CABG w INTERNAL MAMMARY ARTERY USE (%) 0.00 0.20 0.40 0.60 0.80 1.00 Profiled Hospital Benchmark Median Peer Median 0.75 0.72 0.91 INDEX Profiled hospital is statistically AS expected. (95% confidence) ▼ DESIRED DIRECTION 0.0 20.0 40.0 60.0 80.0 100.0 Profiled Hospital Benchmark Median Peer Median 97.0% 97.8% 95.7% PERCENT ▲ DESIRED DIRECTION RISK-ADJUSTED COMPLICATIONS INDEX 0.00 0.20 0.40 0.60 0.80 1.00 Profiled Hospital Benchmark Median Peer Median 0.84 0.85 0.96 INDEX Profiled hospital is statistically AS expected. (95% confidence) ▼ DESIRED DIRECTION 1 Benchmark Hospitals are the winners in the comparison group: n=15 2 Peer Hospitals are the non-winners in the comparison group: n=214 ©2015 Truven Health Analytics. All rights reserved. 8 of 15
  • 9.
    50 TOP CARDIOVASCULARHOSPITALS, 2016 Sample Hospital City, ST HOSPITAL COMPARED WITH CARDIO TEACHING BENCHMARK1 AND PEER2 HOSPITALS CABG PATIENTS SEVERITY-ADJUSTED AVERAGE LENGTH OF STAY 0.0 2.0 4.0 6.0 8.0 10.0 12.0 Profiled Hospital Benchmark Median Peer Median 9.90 8.10 9.00 DAYS ▼ DESIRED DIRECTION WAGE- AND SEVERITY-ADJUSTED COST PER CASE 0 5,000 10,000 15,000 20,000 25,000 30,000 35,000 40,000 Profiled Hospital Benchmark Median Peer Median $32,015 $32,015 $38,980 DOLLARS ▼ DESIRED DIRECTION 1 Benchmark Hospitals are the winners in the comparison group: n=15 2 Peer Hospitals are the non-winners in the comparison group: n=214 ©2015 Truven Health Analytics. All rights reserved. 9 of 15
  • 10.
    50 TOP CARDIOVASCULARHOSPITALS, 2016 Sample Hospital City, ST HOSPITAL COMPARED WITH CARDIO TEACHING BENCHMARK1 AND PEER2 HOSPITALS PCI PATIENTS RISK-ADJUSTED MORTALITY INDEX SEVERITY-ADJUSTED AVERAGE LENGTH OF STAY 0.00 0.20 0.40 0.60 0.80 1.00 Profiled Hospital Benchmark Median Peer Median 0.65 0.82 0.94 INDEX Profiled hospital is statistically AS expected. (95% confidence) ▼ DESIRED DIRECTION 0.0 0.5 1.0 1.5 2.0 2.5 3.0 3.5 4.0 Profiled Hospital Benchmark Median Peer Median 3.30 3.20 3.60 DAYS ▼ DESIRED DIRECTION RISK-ADJUSTED COMPLICATIONS INDEX WAGE- AND SEVERITY-ADJUSTED COST PER CASE 0.00 0.20 0.40 0.60 0.80 1.00 1.20 Profiled Hospital Benchmark Median Peer Median 0.77 0.85 0.98 INDEX Profiled hospital is statistically AS expected. (95% confidence) ▼ DESIRED DIRECTION 0 4,000 8,000 12,000 16,000 20,000 Profiled Hospital Benchmark Median Peer Median $12,499 $13,808 $18,372 DOLLARS ▼ DESIRED DIRECTION 1 Benchmark Hospitals are the winners in the comparison group: n=15 2 Peer Hospitals are the non-winners in the comparison group: n=214 ©2015 Truven Health Analytics. All rights reserved. 10 of 15
  • 11.
    50 TOP CARDIOVASCULARHOSPITALS, 2016 Sample Hospital City, ST HOSPITAL COMPARED WITH CARDIO TEACHING BENCHMARK1 AND PEER2 HOSPITALS CORE MEASURES 0 20 40 60 80 100 Overall CM Mean PCI 90 Min LVSF Assess Peri-Op Beta B Stress Tests* 98 98 100 99 4 98 100 100 99 5 98 98 100 99 5 PERCENT CORE MEASURE ABBREVIATION KEY: Overall CM Mean Overall Core Measures Mean Percent PCI 90 Min Heart Attack Patients Given PCI Within 90 Minutes Of Arrival LVSF Assess Heart Failure Patients Given an Evaluation of Left Ventricular Systolic (LVS) Function Peri-Op Beta B Surgery Patients Who Were Taking Heart Drugs Called Beta Blockers Before Coming to the Hospital, Who Were Kept on the Beta Blockers During the Period Just Before and After their Surgery Stress Tests Outpatients Who Got Cardiac Imaging Stress Tests Before Low-Risk Outpatient Surgery *NOTE: lower percentages are better with this measure Profiled Hospital Benchmark Median Peer Median ▲ DESIRED DIRECTION 1 Benchmark Hospitals are the winners in the comparison group: n=15 2 Peer Hospitals are the non-winners in the comparison group: n=214 ©2015 Truven Health Analytics. All rights reserved. 11 of 15
  • 12.
    50 TOP CARDIOVASCULARHOSPITALS, 2016 Sample Hospital City, ST NEW METRICS UNDER CONSIDERATION This section of your report contains measures that we are currently considering for future inclusion in the study. • Valve Patient Group - Clinical Outcome, Efficiency and Cost Measures • Risk-adjusted mortality index • Risk-adjusted complications index • Severity-adjusted length of stay • Wage- and severity-adjusted cost per case • Extended Outcome Measures • 30-day mortality rate for CABG patients • 30-day readmission rate for CABG patients • Episode of Care Payment Measures • 30-day episode payment for AMI patients • 30-day episode payment for HF patients We welcome your comments and feedback on the usefulness and relevance of these measures in assessing leadership's ability to drive high level balanced performance. ©2015 Truven Health Analytics. All rights reserved. 12 of 15
  • 13.
    50 TOP CARDIOVASCULARHOSPITALS, 2016 Sample Hospital City, ST HOSPITAL COMPARED WITH CARDIO TEACHING BENCHMARK1 AND PEER2 HOSPITALS VALVE PATIENTS RISK-ADJUSTED MORTALITY INDEX SEVERITY-ADJUSTED AVERAGE LENGTH OF STAY 0.00 0.20 0.40 0.60 0.80 1.00 1.20 Profiled Hospital Benchmark Median Peer Median 0.73 0.97 0.98 INDEX Profiled hospital is statistically AS expected. (95% confidence) ▼ DESIRED DIRECTION 0.0 2.0 4.0 6.0 8.0 10.0 12.0 Profiled Hospital Benchmark Median Peer Median 8.60 8.50 9.80 DAYS ▼ DESIRED DIRECTION RISK-ADJUSTED COMPLICATIONS INDEX WAGE- AND SEVERITY-ADJUSTED COST PER CASE 0.00 0.20 0.40 0.60 0.80 1.00 1.20 Profiled Hospital Benchmark Median Peer Median 0.93 0.91 0.99 INDEX Profiled hospital is statistically AS expected. (95% confidence) ▼ DESIRED DIRECTION 0 10,000 20,000 30,000 40,000 50,000 60,000 Profiled Hospital Benchmark Median Peer Median $39,540 $43,019 $52,089 DOLLARS ▼ DESIRED DIRECTION 1 Benchmark Hospitals are the winners in the comparison group: n=15 2 Peer Hospitals are the non-winners in the comparison group: n=214 ©2015 Truven Health Analytics. All rights reserved. 13 of 15
  • 14.
    50 TOP CARDIOVASCULARHOSPITALS, 2016 Sample Hospital City, ST HOSPITAL COMPARED WITH CARDIO TEACHING BENCHMARK1 AND PEER2 HOSPITALS CABG PATIENTS 30-DAY MORTALITY RATE (%) 0.0 0.4 0.8 1.2 1.6 2.0 2.4 2.8 3.2 Profiled Hospital Benchmark Median Peer Median 2.2% 2.7% 2.9% PERCENT ▼ DESIRED DIRECTION jjjjjjjjjjjjjjjjjjjjjjjjjjjjjjjjjjjjjjjjjjjjjjjjjjjjjjjjjjjjjjjjjjjjjjjjj ▼ DESIRED DIRECTION 30-DAY READMISSION RATE (%) 0.0 2.0 4.0 6.0 8.0 10.0 12.0 14.0 16.0 Profiled Hospital Benchmark Median Peer Median 12.5% 15.4% 14.8% PERCENT ▼ DESIRED DIRECTION ▼ DESIRED DIRECTION 1 Benchmark Hospitals are the winners in the comparison group: n=15 2 Peer Hospitals are the non-winners in the comparison group: n=214 ©2015 Truven Health Analytics. All rights reserved. 14 of 15
  • 15.
    50 TOP CARDIOVASCULARHOSPITALS, 2016 Sample Hospital City, ST HOSPITAL COMPARED WITH CARDIO TEACHING BENCHMARK1 AND PEER2 HOSPITALS AMI AND HF PATIENTS AMI 30-DAY EPISODE PAYMENT 0 4,000 8,000 12,000 16,000 20,000 24,000 Profiled Hospital Benchmark Median Peer Median $20,425 $22,236 $22,886 DOLLARS ▼ DESIRED DIRECTION jjjjjjjjjjjjjjjjjjjjjjjjjjjjjjjjjjjjjjjjjjjjjjjjjjjjjjjjjjjjjjjjjjjjjjjjj ▼ DESIRED DIRECTION HF 30-DAY EPISODE PAYMENT 0 2,000 4,000 6,000 8,000 10,000 12,000 14,000 16,000 18,000 Profiled Hospital Benchmark Median Peer Median $15,444 $16,634 $16,489 DOLLARS ▼ DESIRED DIRECTION ▼ DESIRED DIRECTION 1 Benchmark Hospitals are the winners in the comparison group: n=15 2 Peer Hospitals are the non-winners in the comparison group: n=214 ©2015 Truven Health Analytics. All rights reserved. 15 of 15