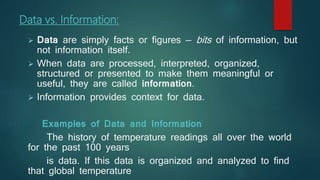
NIT HAMIRPUR
TOPIC :-
DATA ANALYTICS
PRESENTED BY :-
Bhanu Pratap
EED, NIT Hamirpur
Data vs. Information:
 Data are simply facts or figures — bits of information, but
not information itself.
 When data are processed, interpreted, organized,
structured or presented to make them meaningful or
useful, they are called information.
 Information provides context for data.
Examples of Data and Information
The history of temperature readings all over the world
for the past 100 years
is data. If this data is organized and analyzed to find
that global temperature
Data is everywhere:
 Nowadays, everyone has to deal with mounds of data,
whether they call themselves “data analysts” or not.
 But people who possess a toolbox of data analysis skills have
a massive edge on everyone else, because;
• They understand what to do with all that stuff.
• They know how to translate raw numbers into intelligence that
drives real-world action.
• They know how to break down and structure complex
problems and data sets to get right to the heart of problems
in their business.
Data Analytics:
 Data Analytics the science of examining raw data with
the purpose of converting it into information useful for
decision-making or drawing conclusions about that
information by users. Data is collected and analyzed to
answer questions, test hypotheses or disprove theories.
 Data Analytics involves applying an algorithmic or
mechanical process to derive insights. For example,
running through a number of data sets to look for
meaningful correlations between each other.
 The focus of Data Analytics lies in inference, which is the
process of deriving conclusions that are solely based on
what the researcher already knows.
Methodology:
 Data collection
1. Calibration
2. Data management
3. Data cleaning
.
 Exploratory data analysis
 Modeling and algorithms
 Data Mining
 Data Visualization
Data collection:
Data Management:
.
Data Cleaning:
 Data cleansing is hard to do, hard to maintain, hard to
know where to start. There seem to always be errors,
dupes, or format inconsistencies.
 One of the most challenging aspects of data cleansing
has got to be maintaining a clean list of data, whether
it’s sourced from multiple vendors or manually entered by
your hard-working interns, or a combination of both.
 One mistype could create a whole myriad of problems
within your database, and can lead to hours upon hours
of manual cleansing that could so easily have been
Data management comprises all the disciplines related to
managing
data as a valuable resource.
A simple, five-step data cleansing process that can help you
target the areas
where your data is weak and needs more attention.
 Plan
 Analyze to Cleanse
 Implement Automation
 Append Missing Data
 Monitor
From the first planning stage up to the last step of monitoring
your cleansed data, the process will help your team zone in on
dupes and other problems within your data. So you can start
small and make incremental changes, repeating the process
several times to continue improving data quality.
 When looking at data you should focus on high priority
data, and start small. The fields you will want to identify
will be unique to your business and what information you
are specifically looking for, but it may include: job title,
role, email address, phone, industry, revenue, etc.
 It would be beneficial to create and put into place specific
validation rules at this point to standardize and cleanse the
existing data as well as automate this process for the
future. For example, making sure your postal codes and
state codes agree, making sure the addresses are all
standardized the same way, etc. Seek out your IT team
members in help with setting these up! They are more
Plan:
Analyze to Cleanse:
 After you have an idea of the priority data your
company desires, it’s important to go through the data
you already have in order to see what is missing, what
can be thrown out, and what, if any, are gaps between
them.
 You will also need to identify a set of resources to
handle and manually cleanse exceptions to your rules.
The amount of manual intervention is directly correlated
to the amount of acceptable levels of data quality you
have. Once you build out a list of rules or standards,
it’ll be much easier to actually begin cleansing
Implement Automation:
Once you’ve begun to cleanse, you should begin to
standardize and cleanse the flow of new data as it
enters the system by creating scripts or workflows.
These can be run in real-time or in batch (daily, weekly,
monthly) depending on how much data you’re working
with. These routines can be applied to new data, or to
previously keyed-in data.Append Missing Data:
Step four is important especially for records that cannot be
automatically corrected. Examples of this are emails, phone
numbers, industry, company size, etc.
It’s important to identify the correct way of getting a hold of
the missing data, whether it’s from 3rd party append sites,
reaching out to the contacts or just via good old-fashioned
Monitor:
 You will want to set up a periodic review so that you
can monitor issues before they become a major
problem.
 You should be monitoring your database on a whole
as well as in individual units, the contacts, accounts,
etc.
 You should also be aware of bounce rates, and keep
track of bounced emails as well as response rates.
 It’s important to keep up-to-date.
 The end of this cycle, or step six if you will, is to
bring the whole process full circle. Revisit your plans
from the first step and reevaluate. Can your priorities
be changed? Do the rules you implemented still fit
into your overall business strategy? Pinpointing these
necessary changes will equip you to work through the
cycle; make changes that benefit your process and
conduct periodic reviews to make sure that your data
cleansing is running with smoothness and accuracy.
 Follow this cycle and you’ll be well on your way to
having the cleanest and thus most effective data.
Exploratory Data Analysis(EDA):
 Once the data is cleaned, it can be analyzed.
Analysts may apply a variety of techniques referred to
as exploratory data analysis to begin understanding
the messages contained in the data. Exploratory data
analysis (EDA) is an approach to analyzing data
sets to summarize their main characteristics, often with
visual methods.
 The process of exploration may result in additional
data cleaning or additional requests for data, so these
activities may be iterative in nature.
 Descriptive statistics such as the average or median
Modeling and Algorithms:
 Mathematical formulas or models called algorithms may be
applied to the data to identify relationships among the variables,
such as correlation or causation. In general terms, models may
be developed to evaluate a particular variable in the data based
on other variable(s) in the data, with some residual error
depending on model accuracy (i.e., Data = Model + Error).
 Inferential statistics includes techniques to measure relationships
between particular variables. For example, analysis may be
used to model whether a change in advertising (independent
variable x) explains the variation in sales (dependent variable y).
In mathematical terms, y (sales) is a function of x (advertising).
It may be described as y = ax + b + error, where the model is
designed such that a and b minimize the error when the model
Data Mining:
 Data mining is the process of finding anomalies,
patterns and correlations within large data sets to
predict outcomes. Using a broad range of techniques,
you can use this information to increase revenues, cut
costs, improve customer relationships, reduce risks and
more.
 Its foundation comprises three intertwined
scientific disciplines:
 Statistics
(the numeric study of data relationships),
 Artificial intelligence
(human-like intelligence displayed by software
 Over the last decade, advances in processing power
and speed have enabled us to move beyond manual,
tedious and time-consuming practices to quick, easy
and automated data analysis.
 The more complex the data sets collected, the more
potential there is to uncover relevant insights.
 Retailers, banks, manufacturers, telecommunications
providers and insurers, among others, are using data
mining to discover relationships among everything from
pricing, promotions and demographics to how the
economy, risk, competition and social media are
affecting their business models, revenues, operations
and customer relationships.
Data Visualization:
 Data visualization is the presentation of data in a
pictorial or graphical format.
 It enables decision makers to see analytics presented
visually, so they can grasp difficult concepts or identify
new patterns.
 Computers made it possible to process large amounts
of data at lightning-fast speeds. Today, data
visualization has become a rapidly evolving blend of
science and art that is certain to change the corporate
landscape over the next few years.
 Patterns, trends and correlations that might go
undetected in text-based data can be exposed and
Example of Data visualization:
 It is used in a number of industries to allow the
organizations and companies to make better
decisions as well as verify and disprove existing
theories or models.
 Healthcare:
• The main challenge for hospitals with cost pressures
tightens is to treat as many patients as they can
efficiently, keeping in mind the improvement of quality
of care.
• Instrument and machine data is being used increasingly
to track as well as optimize patient flow, treatment, and
equipment use in the hospitals.
Application
 Travel:
• Data analytics is able to optimize the buying experience through
the mobile/ web log and the social media data analysis.
• Travel sights can gain insights into the customer’s desires and
preferences.
• Products can be up-sold by correlating the current sales to the
subsequent browsing increase browse-to-buy conversions via
customized packages and offers.
• Personalized travel recommendations can also be delivered by
data analytics based on social media data.
 Gaming:
• Data Analytics helps in collecting data to optimize and spend
within as well as across games.
• Most firms are using data analytics for energy management,
including smart-grid management, energy optimization, energy
distribution, and building automation in utility companies.
• The application here is centered on the controlling and
monitoring of network devices, dispatch crews, and manage
service outrages.
• Utilities are given the ability to integrate millions of data
points in the network performance and lets the engineers to
use the analytics to monitor the network.
 Energy Management:
 Meter Data Analytics refers to the analysis of data
emitted by electric smart meters that record
consumption of electric energy.
 Replacement of traditional scalar meters with smart
meters is a growing trend primarily in North America
and Europe.
 These smart meters send usage data to the central
head end systems as often as every minute from each
meter whether installed at a residential or a
commercial or an industrial customer.
 Analyzing this voluminous data is as crucial to utility
companies as collecting the data itself. Some of the
major reasons for the analysis are:
• To make efficient energy buying decisions based on
the usage patterns,
Meter Data Analytics:
References:
 http://www.diffen.com/difference/Data_vs_Information
 https://en.wikipedia.org/wiki/Meter_data_analytics
 http://searchdatamanagement.techtarget.com/definition
/data-analytics
 https://www.simplilearn.com/data-science-vs-big-data-
vs-data-analytics-article
 http://www.carboncredentials.com/data-visualization-
smart-meters-a-first-hand-account/
 http://searchbusinessanalytics.techtarget.com/definition
/data-visualization
 http://www.sas.com/en_us/insights/big-data/data-
visualization.html
 https://en.wikipedia.org/wiki/Exploratory_data_analysis
Thanks!

Data analytics

  • 1.
    NIT HAMIRPUR TOPIC :- DATAANALYTICS PRESENTED BY :- Bhanu Pratap EED, NIT Hamirpur
  • 2.
    Data vs. Information: Data are simply facts or figures — bits of information, but not information itself.  When data are processed, interpreted, organized, structured or presented to make them meaningful or useful, they are called information.  Information provides context for data. Examples of Data and Information The history of temperature readings all over the world for the past 100 years is data. If this data is organized and analyzed to find that global temperature
  • 3.
    Data is everywhere: Nowadays, everyone has to deal with mounds of data, whether they call themselves “data analysts” or not.  But people who possess a toolbox of data analysis skills have a massive edge on everyone else, because; • They understand what to do with all that stuff. • They know how to translate raw numbers into intelligence that drives real-world action. • They know how to break down and structure complex problems and data sets to get right to the heart of problems in their business.
  • 4.
    Data Analytics:  DataAnalytics the science of examining raw data with the purpose of converting it into information useful for decision-making or drawing conclusions about that information by users. Data is collected and analyzed to answer questions, test hypotheses or disprove theories.  Data Analytics involves applying an algorithmic or mechanical process to derive insights. For example, running through a number of data sets to look for meaningful correlations between each other.  The focus of Data Analytics lies in inference, which is the process of deriving conclusions that are solely based on what the researcher already knows.
  • 5.
    Methodology:  Data collection 1.Calibration 2. Data management 3. Data cleaning .  Exploratory data analysis  Modeling and algorithms  Data Mining  Data Visualization
  • 6.
  • 7.
    Data Management: . Data Cleaning: Data cleansing is hard to do, hard to maintain, hard to know where to start. There seem to always be errors, dupes, or format inconsistencies.  One of the most challenging aspects of data cleansing has got to be maintaining a clean list of data, whether it’s sourced from multiple vendors or manually entered by your hard-working interns, or a combination of both.  One mistype could create a whole myriad of problems within your database, and can lead to hours upon hours of manual cleansing that could so easily have been Data management comprises all the disciplines related to managing data as a valuable resource.
  • 8.
    A simple, five-stepdata cleansing process that can help you target the areas where your data is weak and needs more attention.  Plan  Analyze to Cleanse  Implement Automation  Append Missing Data  Monitor From the first planning stage up to the last step of monitoring your cleansed data, the process will help your team zone in on dupes and other problems within your data. So you can start small and make incremental changes, repeating the process several times to continue improving data quality.
  • 9.
     When lookingat data you should focus on high priority data, and start small. The fields you will want to identify will be unique to your business and what information you are specifically looking for, but it may include: job title, role, email address, phone, industry, revenue, etc.  It would be beneficial to create and put into place specific validation rules at this point to standardize and cleanse the existing data as well as automate this process for the future. For example, making sure your postal codes and state codes agree, making sure the addresses are all standardized the same way, etc. Seek out your IT team members in help with setting these up! They are more Plan:
  • 10.
    Analyze to Cleanse: After you have an idea of the priority data your company desires, it’s important to go through the data you already have in order to see what is missing, what can be thrown out, and what, if any, are gaps between them.  You will also need to identify a set of resources to handle and manually cleanse exceptions to your rules. The amount of manual intervention is directly correlated to the amount of acceptable levels of data quality you have. Once you build out a list of rules or standards, it’ll be much easier to actually begin cleansing
  • 11.
    Implement Automation: Once you’vebegun to cleanse, you should begin to standardize and cleanse the flow of new data as it enters the system by creating scripts or workflows. These can be run in real-time or in batch (daily, weekly, monthly) depending on how much data you’re working with. These routines can be applied to new data, or to previously keyed-in data.Append Missing Data: Step four is important especially for records that cannot be automatically corrected. Examples of this are emails, phone numbers, industry, company size, etc. It’s important to identify the correct way of getting a hold of the missing data, whether it’s from 3rd party append sites, reaching out to the contacts or just via good old-fashioned
  • 12.
    Monitor:  You willwant to set up a periodic review so that you can monitor issues before they become a major problem.  You should be monitoring your database on a whole as well as in individual units, the contacts, accounts, etc.  You should also be aware of bounce rates, and keep track of bounced emails as well as response rates.  It’s important to keep up-to-date.
  • 13.
     The endof this cycle, or step six if you will, is to bring the whole process full circle. Revisit your plans from the first step and reevaluate. Can your priorities be changed? Do the rules you implemented still fit into your overall business strategy? Pinpointing these necessary changes will equip you to work through the cycle; make changes that benefit your process and conduct periodic reviews to make sure that your data cleansing is running with smoothness and accuracy.  Follow this cycle and you’ll be well on your way to having the cleanest and thus most effective data.
  • 14.
    Exploratory Data Analysis(EDA): Once the data is cleaned, it can be analyzed. Analysts may apply a variety of techniques referred to as exploratory data analysis to begin understanding the messages contained in the data. Exploratory data analysis (EDA) is an approach to analyzing data sets to summarize their main characteristics, often with visual methods.  The process of exploration may result in additional data cleaning or additional requests for data, so these activities may be iterative in nature.  Descriptive statistics such as the average or median
  • 15.
    Modeling and Algorithms: Mathematical formulas or models called algorithms may be applied to the data to identify relationships among the variables, such as correlation or causation. In general terms, models may be developed to evaluate a particular variable in the data based on other variable(s) in the data, with some residual error depending on model accuracy (i.e., Data = Model + Error).  Inferential statistics includes techniques to measure relationships between particular variables. For example, analysis may be used to model whether a change in advertising (independent variable x) explains the variation in sales (dependent variable y). In mathematical terms, y (sales) is a function of x (advertising). It may be described as y = ax + b + error, where the model is designed such that a and b minimize the error when the model
  • 16.
    Data Mining:  Datamining is the process of finding anomalies, patterns and correlations within large data sets to predict outcomes. Using a broad range of techniques, you can use this information to increase revenues, cut costs, improve customer relationships, reduce risks and more.  Its foundation comprises three intertwined scientific disciplines:  Statistics (the numeric study of data relationships),  Artificial intelligence (human-like intelligence displayed by software
  • 17.
     Over thelast decade, advances in processing power and speed have enabled us to move beyond manual, tedious and time-consuming practices to quick, easy and automated data analysis.  The more complex the data sets collected, the more potential there is to uncover relevant insights.  Retailers, banks, manufacturers, telecommunications providers and insurers, among others, are using data mining to discover relationships among everything from pricing, promotions and demographics to how the economy, risk, competition and social media are affecting their business models, revenues, operations and customer relationships.
  • 18.
    Data Visualization:  Datavisualization is the presentation of data in a pictorial or graphical format.  It enables decision makers to see analytics presented visually, so they can grasp difficult concepts or identify new patterns.  Computers made it possible to process large amounts of data at lightning-fast speeds. Today, data visualization has become a rapidly evolving blend of science and art that is certain to change the corporate landscape over the next few years.  Patterns, trends and correlations that might go undetected in text-based data can be exposed and
  • 19.
    Example of Datavisualization:
  • 20.
     It isused in a number of industries to allow the organizations and companies to make better decisions as well as verify and disprove existing theories or models.  Healthcare: • The main challenge for hospitals with cost pressures tightens is to treat as many patients as they can efficiently, keeping in mind the improvement of quality of care. • Instrument and machine data is being used increasingly to track as well as optimize patient flow, treatment, and equipment use in the hospitals. Application
  • 21.
     Travel: • Dataanalytics is able to optimize the buying experience through the mobile/ web log and the social media data analysis. • Travel sights can gain insights into the customer’s desires and preferences. • Products can be up-sold by correlating the current sales to the subsequent browsing increase browse-to-buy conversions via customized packages and offers. • Personalized travel recommendations can also be delivered by data analytics based on social media data.  Gaming: • Data Analytics helps in collecting data to optimize and spend within as well as across games.
  • 22.
    • Most firmsare using data analytics for energy management, including smart-grid management, energy optimization, energy distribution, and building automation in utility companies. • The application here is centered on the controlling and monitoring of network devices, dispatch crews, and manage service outrages. • Utilities are given the ability to integrate millions of data points in the network performance and lets the engineers to use the analytics to monitor the network.  Energy Management:
  • 23.
     Meter DataAnalytics refers to the analysis of data emitted by electric smart meters that record consumption of electric energy.  Replacement of traditional scalar meters with smart meters is a growing trend primarily in North America and Europe.  These smart meters send usage data to the central head end systems as often as every minute from each meter whether installed at a residential or a commercial or an industrial customer.  Analyzing this voluminous data is as crucial to utility companies as collecting the data itself. Some of the major reasons for the analysis are: • To make efficient energy buying decisions based on the usage patterns, Meter Data Analytics:
  • 24.
    References:  http://www.diffen.com/difference/Data_vs_Information  https://en.wikipedia.org/wiki/Meter_data_analytics http://searchdatamanagement.techtarget.com/definition /data-analytics  https://www.simplilearn.com/data-science-vs-big-data- vs-data-analytics-article  http://www.carboncredentials.com/data-visualization- smart-meters-a-first-hand-account/  http://searchbusinessanalytics.techtarget.com/definition /data-visualization  http://www.sas.com/en_us/insights/big-data/data- visualization.html  https://en.wikipedia.org/wiki/Exploratory_data_analysis
  • 25.