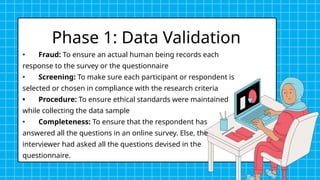
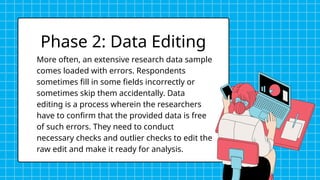
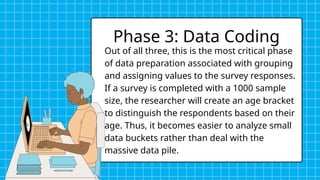
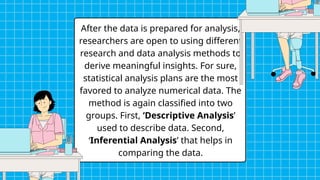
EDUC 200 | Methods of Research
Honey Lee L. Siega
MAED-TRL
UNIT 4: DATA ANALYSIS,
PRESENTATION AND
INTERPRETATION
Overview of Topics
 Data Analysis
 Descriptive Data Analysis
 Inferential Data Analysis
What is DATA
ANALYSIS?
According to LeCompte and Schensul, research
data analysis is a process used by researchers to
reduce data to a story and interpret it to derive
insights. The data analysis process helps reduce
a large chunk of data into smaller fragments,
which makes sense.
DATA ANALYSIS
Three essential things occur during the
data analysis process:
• Data Organization
• Data Reduction
• Data Analysis
researchers do it in both top-down and
bottom-up way.
DATA ANALYSIS
On the other hand, Marshall and Rossman
describe data analysis as a messy, ambiguous, and
time-consuming but creative and fascinating process
through which a mass of collected data is brought to
order, structure and meaning.
Thus “the data analysis and data interpretation is a
process representing the application of deductive and
inductive logic to the research and data analysis.”
DATA ANALYSIS
The first stage in research and data analysis is
to make it for the analysis so that the nominal
data can be converted into something
meaningful. Data preparation consists of the
following phases.
PREPARING DATA FOR
ANALYSIS
Data validation is done to understand if the
collected data sample is per the pre-set
standards, or it is a biased data sample again
divided into four different stages
Phase 1: Data Validation
• Fraud: To ensure an actual human being records each
response to the survey or the questionnaire
• Screening: To make sure each participant or respondent is
selected or chosen in compliance with the research criteria
• Procedure: To ensure ethical standards were maintained
while collecting the data sample
• Completeness: To ensure that the respondent has
answered all the questions in an online survey. Else, the
interviewer had asked all the questions devised in the
questionnaire.
More often, an extensive research data sample
comes loaded with errors. Respondents
sometimes fill in some fields incorrectly or
sometimes skip them accidentally. Data
editing is a process wherein the researchers
have to confirm that the provided data is free
of such errors. They need to conduct
necessary checks and outlier checks to edit the
raw edit and make it ready for analysis.
Phase 2: Data Editing
Out of all three, this is the most critical phase
of data preparation associated with grouping
and assigning values to the survey responses.
If a survey is completed with a 1000 sample
size, the researcher will create an age bracket
to distinguish the respondents based on their
age. Thus, it becomes easier to analyze small
data buckets rather than deal with the
massive data pile.
Phase 3: Data Coding
After the data is prepared for analysis,
researchers are open to using different
research and data analysis methods to
derive meaningful insights. For sure,
statistical analysis plans are the most
favored to analyze numerical data. The
method is again classified into two
groups. First, ‘Descriptive Analysis’
used to describe data. Second,
‘Inferential Analysis’ that helps in
comparing the data.
DESCRIPTIVE
DATA ANALYSIS
DESCRIPTIVE DATA
ANALYSIS
This method is used to describe the basic features of
versatile types of data in research. It presents the data
in such a meaningful way that pattern in the data starts
making sense. Nevertheless, the descriptive analysis
does not go beyond making conclusions. The
conclusions are again based on the hypothesis
researchers have formulated so far. Here are a few
major types of descriptive analysis methods.
Measures of Frequency
• Count, Percent, Frequency
• It is used to denote home often a particular event occurs.
• Researchers use it when they want to showcase how often
a response is given.
Measures of Central Tendency
• Mean, Median, Mode
• The method is widely used to demonstrate distribution by
various points.
• Researchers use this method when they want to showcase
the most commonly or averagely indicated response.
Measures of Dispersion or Variation
• Range, Variance, Standard deviation
• Here the field equals high/low points.
• Variance standard deviation = difference between the
observed score and mean
• It is used to identify the spread of scores by stating
intervals.
• Researchers use this method to showcase data spread
out. It helps them identify the depth until which the data is
spread out that it directly affects the mean.
Measures of Position
• Percentile ranks, Quartile ranks
• It relies on standardized scores helping researchers to
identify the relationship between different scores.
• It is often used when researchers want to compare scores
with the average count.
For quantitative research use of descriptive analysis often
give absolute numbers, but the in-depth analysis is never
sufficient to demonstrate the rationale behind those
numbers. Nevertheless, it is necessary to think of the
best method for research and data analysis suiting your
survey questionnaire and what story researchers want to
tell.
Descriptive analysis is also called a ‘univariate analysis’
since it is commonly used to analyze a single variable.
INFERENTIAL
DATA ANALYSIS
Inferential statistics are used to make predictions
about a larger population after research and data
analysis of the representing population’s collected
sample. For example, you can ask some odd 100
audiences at a movie theater if they like the movie
they are watching. Researchers then use inferential
statistics on the collected sample to reason that
about 80-90% of people like the movie.
INFERENTIAL DATA ANALYSIS
Here are two significant areas of inferential statistics:
• Estimating parameters: It takes statistics from the sample
research data and demonstrates something about the
population parameter.
• Hypothesis test: It’s about sampling research data to
answer the survey research questions. For example,
researchers might be interested to understand if the new shade
of lipstick recently launched is good or not, or if the
multivitamin capsules help children to perform better at
games.
These are sophisticated analysis methods used to showcase the
relationship between different variables instead of describing a
single variable. It is often used when researchers want something
beyond absolute numbers to understand the relationship
between variables.
Here are some of the commonly used methods for data analysis in
research:
• Correlation
• Cross-tabulation
• Regression
• Frequency tables
• Analysis of Variance
• Correlation: When researchers are not conducting
experimental research or quasi-experimental research
wherein the researchers are interested to understand the
relationship between two or more variables, they opt for
correlational research methods.
• Cross-tabulation: Also called contingency tables, cross-
tabulation is used to analyze the relationship between
multiple variables. Suppose provided data has age and
gender categories presented in rows and columns. A two-
dimensional cross-tabulation helps for seamless data analysis
and research by showing the number of males and females in
each age category.
• Regression analysis: For understanding the strong
relationship between two variables, researchers do not look
beyond the primary and commonly used regression analysis
method, which is also a type of predictive analysis used. In this
method, you have an essential factor called the dependent
variable. You also have multiple independent variables in
regression analysis. You undertake efforts to find out the
impact of independent variables on the dependent variable.
The values of both independent and dependent variables are
assumed as being ascertained in an error-free random
manner.
• Frequency tables: The statistical procedure is used for
testing the degree to which two or more vary or differ in an
experiment. A considerable degree of variation means
research findings were significant. In many contexts, ANOVA
testing and variance analysis are similar.
• Analysis of variance: The statistical procedure is used for
testing the degree to which two or more vary or differ in an
experiment. A considerable degree of variation means
research findings were significant. In many contexts, ANOVA
testing and variance analysis are similar.
SOME CONSIDERATIONS IN DATA ANALYSIS
 Researchers must have the necessary research skills to
analyze and manipulation the data, getting trained to
demonstrate a high standard of research practice. Ideally,
researchers must possess more than a basic understanding
of the rationale of selecting one statistical method over the
other to obtain better data insights.
 Usually, research and data analytics projects differ by
scientific discipline; therefore, getting statistical advice at
the beginning of analysis helps design a survey
questionnaire, select data collection methods, and choose
samples.
SOME CONSIDERATIONS IN DATA ANALYSIS
 The primary aim of data research and analysis is to derive
ultimate insights that are unbiased. Any mistake in or
keeping a biased mind to collect data, selecting an analysis
method, or choosing audience sample il to draw a biased
inference.
 Irrelevant to the sophistication used in research data and
analysis is enough to rectify the poorly defined objective
outcome measurements. It does not matter if the design is
at fault or intentions are not clear, but lack of clarity might
mislead readers, so avoid the practice.
SOME CONSIDERATIONS IN DATA ANALYSIS
 The motive behind data analysis in research is to present
accurate and reliable data. As far as possible, avoid
statistical errors, and find a way to deal with everyday
challenges like outliers, missing data, data altering, data
mining, or developing graphical representation.
Descriptive data analysis is crucial for summarizing and
visualizing data, helping researchers understand key
patterns and trends. It aids in communicating findings
clearly and assessing data quality. Inferential data
analysis allows researchers to generalize conclusions
from sample data to broader populations, enabling
hypothesis testing and predictive insights. Together,
these methods enhance the validity and applicability of
research outcomes, informing evidence-based decision-
making.
Conclusion
Alem, D. D. (2020). An overview of data analysis and interpretations in research. International Journal of Academic
Research in Education and Review, 8(1), 1-27.
https://www.questionpro.com/blog/data-analysis-in-research/
https://datatab.net/tutorial/descriptive-inferential-statistics
https://ori.hhs.gov/education/products/n_illinois_u/datamanagement/datopic.html
https://s4be.cochrane.org/blog/2024/01/09/descriptive-vs-inferential-statistics-an-overview/
References

Unit-4.1-Data-Analysis_DescriptiveInferential-Data-Analysis.pptx

  • 1.
    EDUC 200 |Methods of Research Honey Lee L. Siega MAED-TRL UNIT 4: DATA ANALYSIS, PRESENTATION AND INTERPRETATION
  • 2.
    Overview of Topics Data Analysis  Descriptive Data Analysis  Inferential Data Analysis
  • 3.
  • 4.
    According to LeCompteand Schensul, research data analysis is a process used by researchers to reduce data to a story and interpret it to derive insights. The data analysis process helps reduce a large chunk of data into smaller fragments, which makes sense. DATA ANALYSIS
  • 5.
    Three essential thingsoccur during the data analysis process: • Data Organization • Data Reduction • Data Analysis researchers do it in both top-down and bottom-up way. DATA ANALYSIS
  • 6.
    On the otherhand, Marshall and Rossman describe data analysis as a messy, ambiguous, and time-consuming but creative and fascinating process through which a mass of collected data is brought to order, structure and meaning. Thus “the data analysis and data interpretation is a process representing the application of deductive and inductive logic to the research and data analysis.” DATA ANALYSIS
  • 7.
    The first stagein research and data analysis is to make it for the analysis so that the nominal data can be converted into something meaningful. Data preparation consists of the following phases. PREPARING DATA FOR ANALYSIS
  • 8.
    Data validation isdone to understand if the collected data sample is per the pre-set standards, or it is a biased data sample again divided into four different stages Phase 1: Data Validation
  • 9.
    Phase 1: DataValidation • Fraud: To ensure an actual human being records each response to the survey or the questionnaire • Screening: To make sure each participant or respondent is selected or chosen in compliance with the research criteria • Procedure: To ensure ethical standards were maintained while collecting the data sample • Completeness: To ensure that the respondent has answered all the questions in an online survey. Else, the interviewer had asked all the questions devised in the questionnaire.
  • 10.
    More often, anextensive research data sample comes loaded with errors. Respondents sometimes fill in some fields incorrectly or sometimes skip them accidentally. Data editing is a process wherein the researchers have to confirm that the provided data is free of such errors. They need to conduct necessary checks and outlier checks to edit the raw edit and make it ready for analysis. Phase 2: Data Editing
  • 11.
    Out of allthree, this is the most critical phase of data preparation associated with grouping and assigning values to the survey responses. If a survey is completed with a 1000 sample size, the researcher will create an age bracket to distinguish the respondents based on their age. Thus, it becomes easier to analyze small data buckets rather than deal with the massive data pile. Phase 3: Data Coding
  • 12.
    After the datais prepared for analysis, researchers are open to using different research and data analysis methods to derive meaningful insights. For sure, statistical analysis plans are the most favored to analyze numerical data. The method is again classified into two groups. First, ‘Descriptive Analysis’ used to describe data. Second, ‘Inferential Analysis’ that helps in comparing the data.
  • 13.
  • 14.
    DESCRIPTIVE DATA ANALYSIS This methodis used to describe the basic features of versatile types of data in research. It presents the data in such a meaningful way that pattern in the data starts making sense. Nevertheless, the descriptive analysis does not go beyond making conclusions. The conclusions are again based on the hypothesis researchers have formulated so far. Here are a few major types of descriptive analysis methods.
  • 15.
    Measures of Frequency •Count, Percent, Frequency • It is used to denote home often a particular event occurs. • Researchers use it when they want to showcase how often a response is given. Measures of Central Tendency • Mean, Median, Mode • The method is widely used to demonstrate distribution by various points. • Researchers use this method when they want to showcase the most commonly or averagely indicated response.
  • 16.
    Measures of Dispersionor Variation • Range, Variance, Standard deviation • Here the field equals high/low points. • Variance standard deviation = difference between the observed score and mean • It is used to identify the spread of scores by stating intervals. • Researchers use this method to showcase data spread out. It helps them identify the depth until which the data is spread out that it directly affects the mean.
  • 17.
    Measures of Position •Percentile ranks, Quartile ranks • It relies on standardized scores helping researchers to identify the relationship between different scores. • It is often used when researchers want to compare scores with the average count.
  • 18.
    For quantitative researchuse of descriptive analysis often give absolute numbers, but the in-depth analysis is never sufficient to demonstrate the rationale behind those numbers. Nevertheless, it is necessary to think of the best method for research and data analysis suiting your survey questionnaire and what story researchers want to tell. Descriptive analysis is also called a ‘univariate analysis’ since it is commonly used to analyze a single variable.
  • 19.
  • 20.
    Inferential statistics areused to make predictions about a larger population after research and data analysis of the representing population’s collected sample. For example, you can ask some odd 100 audiences at a movie theater if they like the movie they are watching. Researchers then use inferential statistics on the collected sample to reason that about 80-90% of people like the movie. INFERENTIAL DATA ANALYSIS
  • 21.
    Here are twosignificant areas of inferential statistics: • Estimating parameters: It takes statistics from the sample research data and demonstrates something about the population parameter. • Hypothesis test: It’s about sampling research data to answer the survey research questions. For example, researchers might be interested to understand if the new shade of lipstick recently launched is good or not, or if the multivitamin capsules help children to perform better at games.
  • 22.
    These are sophisticatedanalysis methods used to showcase the relationship between different variables instead of describing a single variable. It is often used when researchers want something beyond absolute numbers to understand the relationship between variables. Here are some of the commonly used methods for data analysis in research: • Correlation • Cross-tabulation • Regression • Frequency tables • Analysis of Variance
  • 23.
    • Correlation: Whenresearchers are not conducting experimental research or quasi-experimental research wherein the researchers are interested to understand the relationship between two or more variables, they opt for correlational research methods. • Cross-tabulation: Also called contingency tables, cross- tabulation is used to analyze the relationship between multiple variables. Suppose provided data has age and gender categories presented in rows and columns. A two- dimensional cross-tabulation helps for seamless data analysis and research by showing the number of males and females in each age category.
  • 24.
    • Regression analysis:For understanding the strong relationship between two variables, researchers do not look beyond the primary and commonly used regression analysis method, which is also a type of predictive analysis used. In this method, you have an essential factor called the dependent variable. You also have multiple independent variables in regression analysis. You undertake efforts to find out the impact of independent variables on the dependent variable. The values of both independent and dependent variables are assumed as being ascertained in an error-free random manner.
  • 25.
    • Frequency tables:The statistical procedure is used for testing the degree to which two or more vary or differ in an experiment. A considerable degree of variation means research findings were significant. In many contexts, ANOVA testing and variance analysis are similar. • Analysis of variance: The statistical procedure is used for testing the degree to which two or more vary or differ in an experiment. A considerable degree of variation means research findings were significant. In many contexts, ANOVA testing and variance analysis are similar.
  • 26.
    SOME CONSIDERATIONS INDATA ANALYSIS  Researchers must have the necessary research skills to analyze and manipulation the data, getting trained to demonstrate a high standard of research practice. Ideally, researchers must possess more than a basic understanding of the rationale of selecting one statistical method over the other to obtain better data insights.  Usually, research and data analytics projects differ by scientific discipline; therefore, getting statistical advice at the beginning of analysis helps design a survey questionnaire, select data collection methods, and choose samples.
  • 27.
    SOME CONSIDERATIONS INDATA ANALYSIS  The primary aim of data research and analysis is to derive ultimate insights that are unbiased. Any mistake in or keeping a biased mind to collect data, selecting an analysis method, or choosing audience sample il to draw a biased inference.  Irrelevant to the sophistication used in research data and analysis is enough to rectify the poorly defined objective outcome measurements. It does not matter if the design is at fault or intentions are not clear, but lack of clarity might mislead readers, so avoid the practice.
  • 28.
    SOME CONSIDERATIONS INDATA ANALYSIS  The motive behind data analysis in research is to present accurate and reliable data. As far as possible, avoid statistical errors, and find a way to deal with everyday challenges like outliers, missing data, data altering, data mining, or developing graphical representation.
  • 29.
    Descriptive data analysisis crucial for summarizing and visualizing data, helping researchers understand key patterns and trends. It aids in communicating findings clearly and assessing data quality. Inferential data analysis allows researchers to generalize conclusions from sample data to broader populations, enabling hypothesis testing and predictive insights. Together, these methods enhance the validity and applicability of research outcomes, informing evidence-based decision- making. Conclusion
  • 30.
    Alem, D. D.(2020). An overview of data analysis and interpretations in research. International Journal of Academic Research in Education and Review, 8(1), 1-27. https://www.questionpro.com/blog/data-analysis-in-research/ https://datatab.net/tutorial/descriptive-inferential-statistics https://ori.hhs.gov/education/products/n_illinois_u/datamanagement/datopic.html https://s4be.cochrane.org/blog/2024/01/09/descriptive-vs-inferential-statistics-an-overview/ References