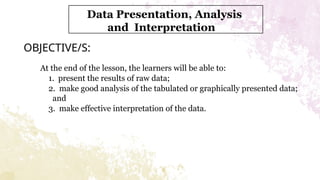
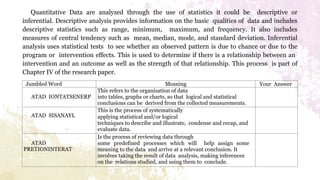
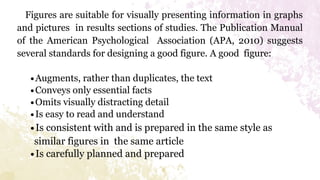
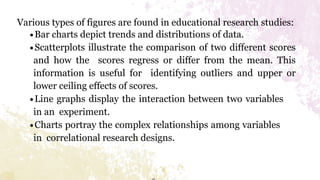
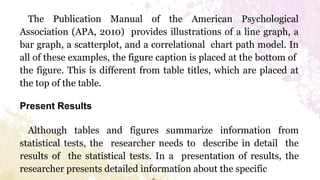
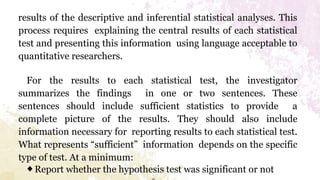
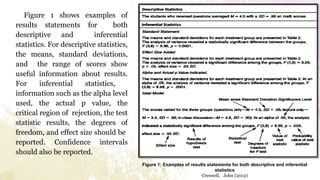
Practical Research 2
Quarter 2
Data Presentation, Analysis
and Interpretation
1. Which of the following refers to the organization of data into tables, graphs
or charts, so that logical and statistical conclusions can be derived from the
collected measurements?
A.Data Analysis C. Data Interpretation
B.Data Coding D. Data Presentation
2. Which of the following does not describe the data presentation process?
C.uses tables that summarize statistical information
D.report whether the hypothesis test was significant or not
E.makes use of figures that portray variables and their relationships
F.discuss how the results either confirmed or disconfirmed prior studies
3. Which of the following is the process of systematically applying statistical
and/or logical techniques to describe and illustrate, condense and recap,
and evaluate data?
G.Data Analysis C. Data Interpretation
H.Data Coding D. Data Presentation
4. Which of the following is not a process of analyzing data?
A. relate two or more variables
B. describes trends in the data to a single variable or question
C. display data in tables to summarize statistical results
D.compares two or more groups on the independent variable in terms of the
dependent variable
5. When does one use table?
E. to depict trends and distributions of data
F. to display data to summarize statistical results
G.to display the interaction between two variables
H.to identify outliers the upper or lower ceiling effects of scores
6. Using the American Psychological Association (APA, 2010), where is the
caption of the figure placed?
I. at the top of the figure C. within the figure
J. at the bottom of the figure D. none of the above
7. What statistic is used in describing the trends in the data using its
central tendency and spread of scores?
A.descriptive Statistics C. both A & B
B.inferential Statistics D. none of the above
8. What statistic is used in determining the significant relationship
between the independent variable and dependent variable?
C.descriptive Statistics C. both A & B
D.inferential Statistics D. none of the above
9. Using the American Psychological Association (APA, 2010), where
is the title of the table placed?
E.at the top of the table C. within the table
F.at the bottom of the table D. none of the above
10. Which of the figure below is used to depict trends and distribution
of data?
A.bar chart C. pictographs
B.line graph D. scatterplots
11. Which of the following is not included in reporting inferential
statistics?
C.alpha level used C. p value
D.degrees of freedom D. mean value
12. When does one used figure?
E.when displaying data to summarize statistical results
F.when summarizing key studies found in the literature
G.when presenting information in graphs or in visual pictures
H.when presenting sample size, probability values & significance
levels
13. Which of the statement below describes the Data Interpretation process?
A. makes use of tables that summarize statistical information
B. describes trends in the data to a single variable or question
C. assigns meaning to the data and arrives at a relevant conclusion
D.makes use of figures that portray variables and their relationships
14. Which of the following shows how to present the finding to each of the
statement of the problem in the study?
E. Present findings containing less data to more complex data.
F. Present findings of the study from the most important to least important.
G.Present findings the same order the problems were introduced in the
study.
H.All of the above
15. Which of the following is not part of Chapter IV of the research paper?
I. Data Analysis C. Data Interpretation
J. Data Gathering D. Data Presentation
OBJECTIVE/S:
At the end of the lesson, the learners will be able to:
1. present the results of raw data;
2. make good analysis of the tabulated or graphically presented data;
and
3. make effective interpretation of the data.
Data Presentation, Analysis
and Interpretation
Quantitative Data are analyzed through the use of statistics it could be descriptive or
inferential. Descriptive analysis provides information on the basic qualities of data and includes
descriptive statistics such as range, minimum, maximum, and frequency. It also includes
measures of central tendency such as mean, median, mode, and standard deviation. Inferential
analysis uses statistical tests to see whether an observed pattern is due to chance or due to the
program or intervention effects. This is used to determine if there is a relationship between an
intervention and an outcome as well as the strength of that relationship. This process is part of
Chapter IV of the research paper.
Jumbled Word Meaning Your Answer
ATAD IONTATSENERP
This refers to the organization of data
into tables, graphs or charts, so that logical and statistical
conclusions can be derived from the collected measurements.
ATAD SISANAYL
This is the process of systematically
applying statistical and/or logical
techniques to describe and illustrate, condense and recap, and
evaluate data.
ATAD
PRETIONINTERAT
Is the process of reviewing data through
some predefined processes which will help assign some
meaning to the data and arrive at a relevant conclusion. It
involves taking the result of data analysis, making inferences
on the relations studied, and using them to conclude.
HOW DO YOU ANALYZE THE DATA?
After you prepare and organize the data, you are ready to analyze it. You
analyze the data to address each one of your research questions or hypotheses.
Questions or hypotheses in quantitative research require that you:
∙Describe trends in the data to a single variable or question on your instrument
(e.g.,“What is the self-esteem of high school students?”). To answer this
question, we need Descriptive Statistics that indicate general tendencies in the
data (mean, mode, median), the spread of scores (variance, standard deviation,
and range), or a comparison of how one score relates to all others (z scores,
percentile rank). We might seek to describe any of our variables: independent,
dependent, control, or mediating.
∙Compare two or more groups on the independent variable in terms of the
dependent variable (e.g., “How do boys and girls compare in their self-
esteem?”).
To answer this question, we need inferential statistics in which
we analyze data from a sample to draw conclusions about an
unknown population. We assess whether the differences of
groups (their means) or the relationship among variables is
much greater or less than what we would expect for the total
population, if we could study the entire population.
∙Relate two or more variables (e.g., “Does self-esteem relate to
an optimistic attitude?”). To answer this question, we also use
inferential statistics.
∙Test hypotheses about the differences in the groups or the
relationships of variables(e.g., “Boys have higher self-esteem
than girls” or “Self-esteem predicts an optimistic attitude
among middle school children”). To answer either of these
questions, inferential statistics are also used.
Thus, we describe results to a single variable or question or we
infer results from a sample to a population. In all quantitative
research questions or hypotheses, we study individuals sampled
from a population. However, in descriptive questions, we study
only a single variable one at a time; in inferential analysis, we
analyze multiple variables at the same time.
Also from comparing groups or relating variables, we can
make predictions about the variables. We can test hypotheses
that make predictions comparing groups or relating variables.
HOW DO YOU PRESENT THE RESULTS?
When researchers conclude the statistical testing, they next
turn to representing the results in tables and figures and
reporting results in a discussion.
Several points might aid in your construction of this section and
help you understand the contents of a published results section.
This section should address or respond to each research question
or hypothesis. A typical approach is to
respond to each question or hypothesis one by one in the order
in which they were introduced earlier in the study. In reporting
the results, the researcher also stays close to the statistical
findings without drawing broader implications or meaning
from them. Further, this section includes summaries of the
data rather than the raw data (e.g., the actual scores for
individuals). A results section includes:
∙Tables that summarize statistical information
∙Figures (charts, pictures, drawings) that portray variables and
their relationships
∙Detailed explanations about the statistical results
Tables
Researchers display data in tables that summarize statistical
results to research questions or hypotheses. Typically, tables for
reporting results contain quantitative information, but they might
contain text information such as summaries of key studies found in
the literature (and incorporated earlier in a study, before the
results). One advantage of using tables is that they can summarize a
large amount of data in a small amount of space. Below are some
guidelines for creating tables.
∙Although you can present multiple statistical tests in one table, a
general guideline is to present one table for each statistical
test. Sometimes, however, you can combine data from different
statistical analyses into a single table. For example, all descriptive
data to questions (M, SD, and range) can be combined into a single
table. However, you should present each inferential test in an
individual table.
∙Readers should be able to grasp easily the meaning of a table.
Tables should organize data into rows and columns with simple
and clear headings. Also, the title for the table should accurately
represent the information contained in the table and be as
complete a description as possible.
∙Authors typically report notes that qualify, explain, or provide
additional information in the tables, which can be helpful to
readers. Often, these notes include information about the size of
the sample reported in the study, the probability values used in
hypothesis testing, and the actual significance levels of the
statistical test.
Figures
Discerning the difference between tables and figures is not always
clear cut. A table includes a summary of quantitative data, whereas
a figure presents information in graphs or in visual pictures (APA,
2010). Thus, a figure is a summary of quantitative information
presented as a chart, graph, or picture that shows relations among
scores or variables. Tables are preferred to figures (APA, 2010)
because tables convey more information in a simple form.
Figures are suitable for visually presenting information in graphs
and pictures in results sections of studies. The Publication Manual
of the American Psychological Association (APA, 2010) suggests
several standards for designing a good figure. A good figure:
∙Augments, rather than duplicates, the text
∙Conveys only essential facts
∙Omits visually distracting detail
∙Is easy to read and understand
∙Is consistent with and is prepared in the same style as
similar figures in the same article
∙Is carefully planned and prepared
Various types of figures are found in educational research studies:
∙Bar charts depict trends and distributions of data.
∙Scatterplots illustrate the comparison of two different scores
and how the scores regress or differ from the mean. This
information is useful for identifying outliers and upper or
lower ceiling effects of scores.
∙Line graphs display the interaction between two variables
in an experiment.
∙Charts portray the complex relationships among variables
in correlational research designs.
The Publication Manual of the American Psychological
Association (APA, 2010) provides illustrations of a line graph, a
bar graph, a scatterplot, and a correlational chart path model. In
all of these examples, the figure caption is placed at the bottom of
the figure. This is different from table titles, which are placed at
the top of the table.
Present Results
Although tables and figures summarize information from
statistical tests, the researcher needs to describe in detail the
results of the statistical tests. In a presentation of results, the
researcher presents detailed information about the specific
results of the descriptive and inferential statistical analyses. This
process requires explaining the central results of each statistical
test and presenting this information using language acceptable to
quantitative researchers.
For the results to each statistical test, the investigator
summarizes the findings in one or two sentences. These
sentences should include sufficient statistics to provide a
complete picture of the results. They should also include
information necessary for reporting results to each statistical test.
What represents “sufficient” information depends on the specific
type of test. At a minimum:
◆Report whether the hypothesis test was significant or not
◆Provide important information about the statistical test, given
the statistics
◆Include language typically used in reporting statistical results
The information about the statistical test, for example, might
include a report on degrees of freedom and sample size for the
chi-square statistic, and means and standard deviations for
descriptive statistics (APA, 2010).
Figure 1 shows examples of
results statements for both
descriptive and inferential
statistics. For descriptive statistics,
the means, standard deviations,
and the range of scores show
useful information about results.
For inferential statistics,
information such as the alpha level
used, the actual p value, the
critical region of rejection, the test
statistic results, the degrees of
freedom, and effect size should be
reported. Confidence intervals
should also be reported.
Figure 1: Examples of results statements for both descriptive and inferential
statistics
Creswell, John (2012)
HOW DO YOU INTERPRET THE RESULTS?
Interpretation refers to the task of drawing inferences from the collected
facts after an analytical and or experimental study. In fact, it is a search for
broader meaning of research findings. The task of interpretation has two
major aspects: the effort to establish continuity in research through linking
the results of a given study with those of another and the establishment of
some explanation concepts.
• “In one sense, interpretation is concerned with relationships within the
collected data, partially overlapping analysis. Interpretation also extends
beyond the data of the study to inch the results of other research, theory
and hypotheses.”
∙Interpretation is the device through which the factors that seem to
explain what has been observed by researcher in the course of the
study can be better understood and it also provides a theoretical
conception which can serve as a guide for further researches.
Technique of Interpretation
The task of interpretation is not an easy job; rather it requires a great
skill and dexterity on the part of researcher. Interpretation is an art
that one learns through practice and experience. The researcher may,
at times, seek the guidance from experts for accomplishing the task of
interpretation.
The technique of interpretation often involves the following steps:
1.Researcher must give reasonable explanations of the relations which
he/she has found and he/she must interpret the lines of relationship
in terms of the underlying processes and must try to find out the
thread of uniformity that lies under the surface layer of his
diversified research findings.
2.Extraneous information, if collected during the study, must be
considered while interpreting the final results of research study, for
it may prove to be a key factor in understanding the problem under
consideration.
3.It is advisable, before embarking upon final interpretation, to,
consult someone having insight into the study and who is frank
and honest and will not hesitate to point out omissions and errors in
logical argumentation. Such a consultation will result in correct
interpretation and, thus, will enhance the utility of research results.
2.Researcher must accomplish the task of interpretation only after
considering all relevant factors affecting the problem to avoid false
generalization. He /she must be in no hurry while interpreting
results, for quite often the conclusions, which appear to be all right
at the beginning, may not at all be accurate.
Precautions in Interpretation
∙One should always remember that even if the data are properly
collected and analyzed, wrong interpretation would lead to
inaccurate conclusions. It is, therefore, absolutely essential
that the task of, interpretation be accomplished with patience
in an impartial manner and also in correct perspective.
∙Researcher must pay attention to the following points for
correct interpretation:
(i)At the outset, researcher must invariably satisfy himself that
(a) the data are appropriate, trustworthy and adequate for
drawing inferences; (b) the data reflect good homogeneity; and
that (c) proper analysis has been done through statistical
methods. (ii) The researcher must remain cautious about the
errors that can possibly arise in the process of interpreting
results.
∙Errors can arise due to false generalization and/or due to
wrong interpretation of statistical measures, such as the
application of findings beyond the range of observations,
identification of correlation with causation and the like.
Another major pitfall is the tendency to affirm that definite
relationships exist on the basis of confirmation of particular
hypotheses.
What I Have Learned
Answer the following questions comprehensively:
1.Cite three ways on how to present data.
2.Discuss three ways on how to analyze data.
3.Explain briefly on how to interpret data.
Practice Writing Chapter IV
Instruction: Given is a raw data of the study entitled: Examining
the Impact of Later High School Start Times on the Health and
Academic Performance of High School
Students: A Multi-Site Study create a Data Presentation, Analysis
and Interpretation.
Raw data:
Mean High School Student Bedtimes and Wake Up Times on
School Days and Weekends
Bedtime School Nights 11:32 PM Wake Up Time
School Days 7:20 AM Bedtime Weekend Nights
12:56 AM Wake Up Time Weekend Days 10:36 AM
ASSESSMENT
1. Which of the following is not included in reporting inferential statistics?
A. alpha level used C. p value
B. degrees of freedom D. mean value
2. When does one used figure?
C. when displaying data to summarize statistical results
D.when summarizing key studies found in the literature
E. when presenting information in graphs or in visual pictures
F. when presenting sample size, probability values & significance levels
3. What statistic is used in describing the trends in the data using its central
tendency and spread of scores?
G.descriptive Statistics C. both A & B
H.inferential Statistics D. none of the above
4. What statistic is used in determining the significant relationship
between the independent variable and dependent variable?
A.descriptive Statistics C. both A & B
B.inferential Statistics D. none of the above
5. When does one use table?
C.to depict trends and distributions of data
D.to display data to summarize statistical results
E.to display the interaction between two variables
F.to identify outliers the upper or lower ceiling effects of scores
6. Using the American Psychological Association (APA, 2010), where
is the caption of the figure placed?
G.at the top of the figure C. within the figure
H.at the bottom of the figure D. none of the above
7. Using the American Psychological Association (APA, 2010), where is the
title of the table placed?
A.at the top of the table C. within the table
B.at the bottom of the table D. none of the above
8. Which of the figure below is used to depict trends and distribution of
data?
C. bar chart C. pictographs
D.line graph D. scatterplots
9. Which of the statement below describes the Data Interpretation
process?
E.makes use of tables that summarize statistical information
F. describes trends in the data to a single variable or question
G.assigns meaning to the data and arrives at a relevant conclusion
H.makes use of figures that portray variables and their relationships
10. Which of the following refers to the organization of data into tables, graphs
or charts, so that logical and statistical conclusions can be derived from
the collected measurements?
A.Data Analysis C. Data Interpretation
B.Data Coding D. Data Presentation
11. Which of the following does not describe the data presentation process?
C.uses tables that summarize statistical information
D.report whether the hypothesis test was significant or not
E.makes use of figures that portray variables and their relationships
F.discuss how the results either confirmed or disconfirmed prior studies
12. Which of the following is the process of systematically applying statistical
and/or logical techniques to describe and illustrate, condense and recap,
and evaluate data?
G.Data Analysis C. Data Interpretation
H.Data Coding D. Data Presentation
12. Which of the following is the process of systematically applying
statistical and/or logical techniques to describe and illustrate,
condense and recap, and evaluate data?
A.Data Analysis C. Data Interpretation
B.Data Coding D. Data Presentation
13. Which of the following is not a process of analyzing data?
C.relate two or more variables
D.describes trends in the data to a single variable or question
E.display data in tables to summarize statistical results
D.compares two or more groups on the independent variable in
terms of the dependent variable
14. Which of the following shows how to present the finding to each
of the statement of the problem in the study?
A.Present findings containing less data to more complex data.
B.Present findings of the study from the most important to least
important.
C.Present findings the same order the problems were introduced in
the study.
D.All of the above
15. Which of the following is not part of Chapter IV of the research
paper?
E.Data Analysis C. Data Interpretation
F.Data Gathering D. Data Presentation

6_Quarter 2-PRACTICAL-RESEARCH data presentation.pptx

  • 1.
    Practical Research 2 Quarter2 Data Presentation, Analysis and Interpretation
  • 2.
    1. Which ofthe following refers to the organization of data into tables, graphs or charts, so that logical and statistical conclusions can be derived from the collected measurements? A.Data Analysis C. Data Interpretation B.Data Coding D. Data Presentation 2. Which of the following does not describe the data presentation process? C.uses tables that summarize statistical information D.report whether the hypothesis test was significant or not E.makes use of figures that portray variables and their relationships F.discuss how the results either confirmed or disconfirmed prior studies 3. Which of the following is the process of systematically applying statistical and/or logical techniques to describe and illustrate, condense and recap, and evaluate data? G.Data Analysis C. Data Interpretation H.Data Coding D. Data Presentation
  • 3.
    4. Which ofthe following is not a process of analyzing data? A. relate two or more variables B. describes trends in the data to a single variable or question C. display data in tables to summarize statistical results D.compares two or more groups on the independent variable in terms of the dependent variable 5. When does one use table? E. to depict trends and distributions of data F. to display data to summarize statistical results G.to display the interaction between two variables H.to identify outliers the upper or lower ceiling effects of scores 6. Using the American Psychological Association (APA, 2010), where is the caption of the figure placed? I. at the top of the figure C. within the figure J. at the bottom of the figure D. none of the above
  • 4.
    7. What statisticis used in describing the trends in the data using its central tendency and spread of scores? A.descriptive Statistics C. both A & B B.inferential Statistics D. none of the above 8. What statistic is used in determining the significant relationship between the independent variable and dependent variable? C.descriptive Statistics C. both A & B D.inferential Statistics D. none of the above 9. Using the American Psychological Association (APA, 2010), where is the title of the table placed? E.at the top of the table C. within the table F.at the bottom of the table D. none of the above
  • 5.
    10. Which ofthe figure below is used to depict trends and distribution of data? A.bar chart C. pictographs B.line graph D. scatterplots 11. Which of the following is not included in reporting inferential statistics? C.alpha level used C. p value D.degrees of freedom D. mean value 12. When does one used figure? E.when displaying data to summarize statistical results F.when summarizing key studies found in the literature G.when presenting information in graphs or in visual pictures H.when presenting sample size, probability values & significance levels
  • 6.
    13. Which ofthe statement below describes the Data Interpretation process? A. makes use of tables that summarize statistical information B. describes trends in the data to a single variable or question C. assigns meaning to the data and arrives at a relevant conclusion D.makes use of figures that portray variables and their relationships 14. Which of the following shows how to present the finding to each of the statement of the problem in the study? E. Present findings containing less data to more complex data. F. Present findings of the study from the most important to least important. G.Present findings the same order the problems were introduced in the study. H.All of the above 15. Which of the following is not part of Chapter IV of the research paper? I. Data Analysis C. Data Interpretation J. Data Gathering D. Data Presentation
  • 7.
    OBJECTIVE/S: At the endof the lesson, the learners will be able to: 1. present the results of raw data; 2. make good analysis of the tabulated or graphically presented data; and 3. make effective interpretation of the data. Data Presentation, Analysis and Interpretation
  • 8.
    Quantitative Data areanalyzed through the use of statistics it could be descriptive or inferential. Descriptive analysis provides information on the basic qualities of data and includes descriptive statistics such as range, minimum, maximum, and frequency. It also includes measures of central tendency such as mean, median, mode, and standard deviation. Inferential analysis uses statistical tests to see whether an observed pattern is due to chance or due to the program or intervention effects. This is used to determine if there is a relationship between an intervention and an outcome as well as the strength of that relationship. This process is part of Chapter IV of the research paper. Jumbled Word Meaning Your Answer ATAD IONTATSENERP This refers to the organization of data into tables, graphs or charts, so that logical and statistical conclusions can be derived from the collected measurements. ATAD SISANAYL This is the process of systematically applying statistical and/or logical techniques to describe and illustrate, condense and recap, and evaluate data. ATAD PRETIONINTERAT Is the process of reviewing data through some predefined processes which will help assign some meaning to the data and arrive at a relevant conclusion. It involves taking the result of data analysis, making inferences on the relations studied, and using them to conclude.
  • 9.
    HOW DO YOUANALYZE THE DATA? After you prepare and organize the data, you are ready to analyze it. You analyze the data to address each one of your research questions or hypotheses. Questions or hypotheses in quantitative research require that you: ∙Describe trends in the data to a single variable or question on your instrument (e.g.,“What is the self-esteem of high school students?”). To answer this question, we need Descriptive Statistics that indicate general tendencies in the data (mean, mode, median), the spread of scores (variance, standard deviation, and range), or a comparison of how one score relates to all others (z scores, percentile rank). We might seek to describe any of our variables: independent, dependent, control, or mediating. ∙Compare two or more groups on the independent variable in terms of the dependent variable (e.g., “How do boys and girls compare in their self- esteem?”).
  • 10.
    To answer thisquestion, we need inferential statistics in which we analyze data from a sample to draw conclusions about an unknown population. We assess whether the differences of groups (their means) or the relationship among variables is much greater or less than what we would expect for the total population, if we could study the entire population. ∙Relate two or more variables (e.g., “Does self-esteem relate to an optimistic attitude?”). To answer this question, we also use inferential statistics. ∙Test hypotheses about the differences in the groups or the
  • 11.
    relationships of variables(e.g.,“Boys have higher self-esteem than girls” or “Self-esteem predicts an optimistic attitude among middle school children”). To answer either of these questions, inferential statistics are also used. Thus, we describe results to a single variable or question or we infer results from a sample to a population. In all quantitative research questions or hypotheses, we study individuals sampled from a population. However, in descriptive questions, we study only a single variable one at a time; in inferential analysis, we analyze multiple variables at the same time. Also from comparing groups or relating variables, we can
  • 12.
    make predictions aboutthe variables. We can test hypotheses that make predictions comparing groups or relating variables. HOW DO YOU PRESENT THE RESULTS? When researchers conclude the statistical testing, they next turn to representing the results in tables and figures and reporting results in a discussion. Several points might aid in your construction of this section and help you understand the contents of a published results section. This section should address or respond to each research question or hypothesis. A typical approach is to
  • 13.
    respond to eachquestion or hypothesis one by one in the order in which they were introduced earlier in the study. In reporting the results, the researcher also stays close to the statistical findings without drawing broader implications or meaning from them. Further, this section includes summaries of the data rather than the raw data (e.g., the actual scores for individuals). A results section includes: ∙Tables that summarize statistical information ∙Figures (charts, pictures, drawings) that portray variables and their relationships ∙Detailed explanations about the statistical results
  • 14.
    Tables Researchers display datain tables that summarize statistical results to research questions or hypotheses. Typically, tables for reporting results contain quantitative information, but they might contain text information such as summaries of key studies found in the literature (and incorporated earlier in a study, before the results). One advantage of using tables is that they can summarize a large amount of data in a small amount of space. Below are some guidelines for creating tables. ∙Although you can present multiple statistical tests in one table, a general guideline is to present one table for each statistical
  • 15.
    test. Sometimes, however,you can combine data from different statistical analyses into a single table. For example, all descriptive data to questions (M, SD, and range) can be combined into a single table. However, you should present each inferential test in an individual table. ∙Readers should be able to grasp easily the meaning of a table. Tables should organize data into rows and columns with simple and clear headings. Also, the title for the table should accurately represent the information contained in the table and be as complete a description as possible. ∙Authors typically report notes that qualify, explain, or provide additional information in the tables, which can be helpful to
  • 16.
    readers. Often, thesenotes include information about the size of the sample reported in the study, the probability values used in hypothesis testing, and the actual significance levels of the statistical test. Figures Discerning the difference between tables and figures is not always clear cut. A table includes a summary of quantitative data, whereas a figure presents information in graphs or in visual pictures (APA, 2010). Thus, a figure is a summary of quantitative information presented as a chart, graph, or picture that shows relations among scores or variables. Tables are preferred to figures (APA, 2010) because tables convey more information in a simple form.
  • 17.
    Figures are suitablefor visually presenting information in graphs and pictures in results sections of studies. The Publication Manual of the American Psychological Association (APA, 2010) suggests several standards for designing a good figure. A good figure: ∙Augments, rather than duplicates, the text ∙Conveys only essential facts ∙Omits visually distracting detail ∙Is easy to read and understand ∙Is consistent with and is prepared in the same style as similar figures in the same article ∙Is carefully planned and prepared
  • 18.
    Various types offigures are found in educational research studies: ∙Bar charts depict trends and distributions of data. ∙Scatterplots illustrate the comparison of two different scores and how the scores regress or differ from the mean. This information is useful for identifying outliers and upper or lower ceiling effects of scores. ∙Line graphs display the interaction between two variables in an experiment. ∙Charts portray the complex relationships among variables in correlational research designs.
  • 19.
    The Publication Manualof the American Psychological Association (APA, 2010) provides illustrations of a line graph, a bar graph, a scatterplot, and a correlational chart path model. In all of these examples, the figure caption is placed at the bottom of the figure. This is different from table titles, which are placed at the top of the table. Present Results Although tables and figures summarize information from statistical tests, the researcher needs to describe in detail the results of the statistical tests. In a presentation of results, the researcher presents detailed information about the specific
  • 20.
    results of thedescriptive and inferential statistical analyses. This process requires explaining the central results of each statistical test and presenting this information using language acceptable to quantitative researchers. For the results to each statistical test, the investigator summarizes the findings in one or two sentences. These sentences should include sufficient statistics to provide a complete picture of the results. They should also include information necessary for reporting results to each statistical test. What represents “sufficient” information depends on the specific type of test. At a minimum: ◆Report whether the hypothesis test was significant or not
  • 21.
    ◆Provide important informationabout the statistical test, given the statistics ◆Include language typically used in reporting statistical results The information about the statistical test, for example, might include a report on degrees of freedom and sample size for the chi-square statistic, and means and standard deviations for descriptive statistics (APA, 2010).
  • 22.
    Figure 1 showsexamples of results statements for both descriptive and inferential statistics. For descriptive statistics, the means, standard deviations, and the range of scores show useful information about results. For inferential statistics, information such as the alpha level used, the actual p value, the critical region of rejection, the test statistic results, the degrees of freedom, and effect size should be reported. Confidence intervals should also be reported. Figure 1: Examples of results statements for both descriptive and inferential statistics Creswell, John (2012)
  • 23.
    HOW DO YOUINTERPRET THE RESULTS? Interpretation refers to the task of drawing inferences from the collected facts after an analytical and or experimental study. In fact, it is a search for broader meaning of research findings. The task of interpretation has two major aspects: the effort to establish continuity in research through linking the results of a given study with those of another and the establishment of some explanation concepts. • “In one sense, interpretation is concerned with relationships within the collected data, partially overlapping analysis. Interpretation also extends beyond the data of the study to inch the results of other research, theory and hypotheses.”
  • 24.
    ∙Interpretation is thedevice through which the factors that seem to explain what has been observed by researcher in the course of the study can be better understood and it also provides a theoretical conception which can serve as a guide for further researches. Technique of Interpretation The task of interpretation is not an easy job; rather it requires a great skill and dexterity on the part of researcher. Interpretation is an art that one learns through practice and experience. The researcher may, at times, seek the guidance from experts for accomplishing the task of interpretation.
  • 25.
    The technique ofinterpretation often involves the following steps: 1.Researcher must give reasonable explanations of the relations which he/she has found and he/she must interpret the lines of relationship in terms of the underlying processes and must try to find out the thread of uniformity that lies under the surface layer of his diversified research findings. 2.Extraneous information, if collected during the study, must be considered while interpreting the final results of research study, for it may prove to be a key factor in understanding the problem under consideration. 3.It is advisable, before embarking upon final interpretation, to, consult someone having insight into the study and who is frank
  • 26.
    and honest andwill not hesitate to point out omissions and errors in logical argumentation. Such a consultation will result in correct interpretation and, thus, will enhance the utility of research results. 2.Researcher must accomplish the task of interpretation only after considering all relevant factors affecting the problem to avoid false generalization. He /she must be in no hurry while interpreting results, for quite often the conclusions, which appear to be all right at the beginning, may not at all be accurate. Precautions in Interpretation ∙One should always remember that even if the data are properly collected and analyzed, wrong interpretation would lead to
  • 27.
    inaccurate conclusions. Itis, therefore, absolutely essential that the task of, interpretation be accomplished with patience in an impartial manner and also in correct perspective. ∙Researcher must pay attention to the following points for correct interpretation: (i)At the outset, researcher must invariably satisfy himself that (a) the data are appropriate, trustworthy and adequate for drawing inferences; (b) the data reflect good homogeneity; and that (c) proper analysis has been done through statistical methods. (ii) The researcher must remain cautious about the errors that can possibly arise in the process of interpreting results.
  • 28.
    ∙Errors can arisedue to false generalization and/or due to wrong interpretation of statistical measures, such as the application of findings beyond the range of observations, identification of correlation with causation and the like. Another major pitfall is the tendency to affirm that definite relationships exist on the basis of confirmation of particular hypotheses.
  • 29.
    What I HaveLearned Answer the following questions comprehensively: 1.Cite three ways on how to present data. 2.Discuss three ways on how to analyze data. 3.Explain briefly on how to interpret data.
  • 30.
    Practice Writing ChapterIV Instruction: Given is a raw data of the study entitled: Examining the Impact of Later High School Start Times on the Health and Academic Performance of High School Students: A Multi-Site Study create a Data Presentation, Analysis and Interpretation. Raw data: Mean High School Student Bedtimes and Wake Up Times on School Days and Weekends Bedtime School Nights 11:32 PM Wake Up Time School Days 7:20 AM Bedtime Weekend Nights 12:56 AM Wake Up Time Weekend Days 10:36 AM
  • 31.
    ASSESSMENT 1. Which ofthe following is not included in reporting inferential statistics? A. alpha level used C. p value B. degrees of freedom D. mean value 2. When does one used figure? C. when displaying data to summarize statistical results D.when summarizing key studies found in the literature E. when presenting information in graphs or in visual pictures F. when presenting sample size, probability values & significance levels 3. What statistic is used in describing the trends in the data using its central tendency and spread of scores? G.descriptive Statistics C. both A & B H.inferential Statistics D. none of the above
  • 32.
    4. What statisticis used in determining the significant relationship between the independent variable and dependent variable? A.descriptive Statistics C. both A & B B.inferential Statistics D. none of the above 5. When does one use table? C.to depict trends and distributions of data D.to display data to summarize statistical results E.to display the interaction between two variables F.to identify outliers the upper or lower ceiling effects of scores 6. Using the American Psychological Association (APA, 2010), where is the caption of the figure placed? G.at the top of the figure C. within the figure H.at the bottom of the figure D. none of the above
  • 33.
    7. Using theAmerican Psychological Association (APA, 2010), where is the title of the table placed? A.at the top of the table C. within the table B.at the bottom of the table D. none of the above 8. Which of the figure below is used to depict trends and distribution of data? C. bar chart C. pictographs D.line graph D. scatterplots 9. Which of the statement below describes the Data Interpretation process? E.makes use of tables that summarize statistical information F. describes trends in the data to a single variable or question G.assigns meaning to the data and arrives at a relevant conclusion H.makes use of figures that portray variables and their relationships
  • 34.
    10. Which ofthe following refers to the organization of data into tables, graphs or charts, so that logical and statistical conclusions can be derived from the collected measurements? A.Data Analysis C. Data Interpretation B.Data Coding D. Data Presentation 11. Which of the following does not describe the data presentation process? C.uses tables that summarize statistical information D.report whether the hypothesis test was significant or not E.makes use of figures that portray variables and their relationships F.discuss how the results either confirmed or disconfirmed prior studies 12. Which of the following is the process of systematically applying statistical and/or logical techniques to describe and illustrate, condense and recap, and evaluate data? G.Data Analysis C. Data Interpretation H.Data Coding D. Data Presentation
  • 35.
    12. Which ofthe following is the process of systematically applying statistical and/or logical techniques to describe and illustrate, condense and recap, and evaluate data? A.Data Analysis C. Data Interpretation B.Data Coding D. Data Presentation 13. Which of the following is not a process of analyzing data? C.relate two or more variables D.describes trends in the data to a single variable or question E.display data in tables to summarize statistical results D.compares two or more groups on the independent variable in terms of the dependent variable
  • 36.
    14. Which ofthe following shows how to present the finding to each of the statement of the problem in the study? A.Present findings containing less data to more complex data. B.Present findings of the study from the most important to least important. C.Present findings the same order the problems were introduced in the study. D.All of the above 15. Which of the following is not part of Chapter IV of the research paper? E.Data Analysis C. Data Interpretation F.Data Gathering D. Data Presentation