Downloaded 170 times
![3GPP TSG RAN WG1 #44 Tdoc# R1-060385
Denver, USA
February 13-17, 2006
Agenda Item
Source: Motorola
Title: Cubic Metric in 3GPP-LTE
Document for: Discussion
Introduction
The conclusion of the original cubic metric (CM) discussion [1] states the peak-to-average power
ratio (PAPR) of a signal does not predict PA power de-rating as accurately as CM. This paper will
expand on the original conclusions by analyzing certain OFDM-type signals that have been considered to
meet the long-term evolution (LTE) goals for 3GPP networks.
Review of the Cubic Metric
A cubic metric has been adopted by the 3GPP members as a method to determine PA power de-
rating because of its accuracy over a wide range of devices and signals. This method has proven to be
superior, for W-CDMA signals, compared to methods that use the statistical PAPR to predict de-rating.
With the introduction of various OFDM-type modulation formats it is crucial that the cubic metric is
verified as a valid predictor of power de-rating.
Data has been collected on several devices for a variety of signals that will show how well the de-
rating of new LTE signals is predicted by CM. Recall the equation to compute the power de-rating via
the cubic metric method:
CM =
[ ]
20 log10 {rms v norm ( t ) } − 20 log10 {rms vref norm ( t ) }
3 3
[ ] dB
K
Where
[ ]
20 log10 {rms vnorm ( t ) } is the called raw cubic metric (in dB) of a signal
3
[ ]
20 log10 {rms vref norm ( t ) } = 1.52 dB is the raw cubic metric of the W-CDMA voice
3
reference signal
rms ( x ) =
( x′x ) v norm ( t ) =
v(t )
to clarify: N , and rms[ v ( t ) ]
In previous work K was empirically determined to be 1.85 for a set of W-CDMA signals.
A new value for K will be determined for multi-carrier signals in this report.
In words, this equation computes the cubic power of a signal v(t), compares it to a reference
signal vref(t) and uses the empirical slope factor K to complete the estimate. Although the signal vectors
are shown as a function of time, the time scale is effectively removed in the rms operation and is not a
part of the computation. Thus the raw CM result is not a function of symbol/chip rate (or alternatively
not a function of signal bandwidth). This can be easily verified by computing the raw cubic metric for a
conventional W-CDMA signal at a 3.84 MHz chip rate, and for the same signal generated at a 7.68 MHz
chip rate. As long as the SRRC filter bandwidth is scaled with the chip rate, an essentially identical
signal is generated at twice the bandwidth, but having the same raw cubic metric. Similarly, a change in
chip rate has no affect on PAPR. Bandwidth effects will be significant to this study since it includes
signals with 3 dB bandwidths larger than the 3.84 MHz used for W-CDMA.
1](https://image.slidesharecdn.com/cubucmetricin3gpplte-111022151821-phpapp02/85/Cubuc-metric-in-3-gpp-lte-1-320.jpg)
![3GPP TSG RAN WG1 #44 Tdoc# R1-060385
Denver, USA
February 13-17, 2006
Agenda Item
Source: Motorola
Title: Cubic Metric in 3GPP-LTE
Document for: Discussion
Introduction
The conclusion of the original cubic metric (CM) discussion [1] states the peak-to-average power
ratio (PAPR) of a signal does not predict PA power de-rating as accurately as CM. This paper will
expand on the original conclusions by analyzing certain OFDM-type signals that have been considered to
meet the long-term evolution (LTE) goals for 3GPP networks.
Review of the Cubic Metric
A cubic metric has been adopted by the 3GPP members as a method to determine PA power de-
rating because of its accuracy over a wide range of devices and signals. This method has proven to be
superior, for W-CDMA signals, compared to methods that use the statistical PAPR to predict de-rating.
With the introduction of various OFDM-type modulation formats it is crucial that the cubic metric is
verified as a valid predictor of power de-rating.
Data has been collected on several devices for a variety of signals that will show how well the de-
rating of new LTE signals is predicted by CM. Recall the equation to compute the power de-rating via
the cubic metric method:
CM =
[ ]
20 log10 {rms v norm ( t ) } − 20 log10 {rms vref norm ( t ) }
3 3
[ ] dB
K
Where
[ ]
20 log10 {rms vnorm ( t ) } is the called raw cubic metric (in dB) of a signal
3
[ ]
20 log10 {rms vref norm ( t ) } = 1.52 dB is the raw cubic metric of the W-CDMA voice
3
reference signal
rms ( x ) =
( x′x ) v norm ( t ) =
v(t )
to clarify: N , and rms[ v ( t ) ]
In previous work K was empirically determined to be 1.85 for a set of W-CDMA signals.
A new value for K will be determined for multi-carrier signals in this report.
In words, this equation computes the cubic power of a signal v(t), compares it to a reference
signal vref(t) and uses the empirical slope factor K to complete the estimate. Although the signal vectors
are shown as a function of time, the time scale is effectively removed in the rms operation and is not a
part of the computation. Thus the raw CM result is not a function of symbol/chip rate (or alternatively
not a function of signal bandwidth). This can be easily verified by computing the raw cubic metric for a
conventional W-CDMA signal at a 3.84 MHz chip rate, and for the same signal generated at a 7.68 MHz
chip rate. As long as the SRRC filter bandwidth is scaled with the chip rate, an essentially identical
signal is generated at twice the bandwidth, but having the same raw cubic metric. Similarly, a change in
chip rate has no affect on PAPR. Bandwidth effects will be significant to this study since it includes
signals with 3 dB bandwidths larger than the 3.84 MHz used for W-CDMA.
1](https://image.slidesharecdn.com/cubucmetricin3gpplte-111022151821-phpapp02/75/Cubuc-metric-in-3-gpp-lte-1-2048.jpg)
![Results and Analysis
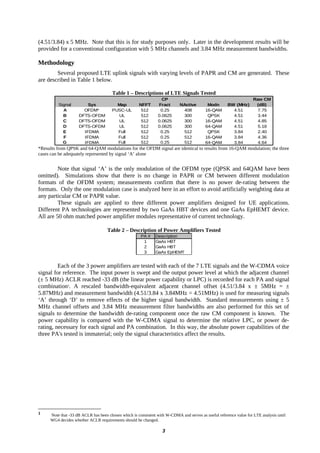
Table 3 shows the output power de-rating for each signal and each device.
Tables 3 & 4 – Measured Relative Power Capability by Signal and PA
Bandwidth Normalized Results Standard Results
Power De-rating Power De-rating
Signal Raw CM PA #1 PA #2 PA #3 Signal Raw CM PA #1 PA #2 PA #3
Ref. 1.52 - - - Ref. 1.52 - - -
A 7.75 3.51 4.08 3.99 A 7.75 4.46 4.93 4.87
B 3.44 1.34 1.63 1.73 B 3.44 2.14 2.29 1.85
C 4.85 1.92 2.26 2.28 C 4.85 2.75 2.89 2.43
D 5.18 2.12 2.44 2.59 D 5.18 3.06 3.07 2.71
E 2.40 - - - E 2.40 0.48 0.45 0.63
F 4.36 - - - F 4.36 1.50 1.74 1.84
G 4.64 - - - G 4.64 1.79 2.03 1.98
(3) (4)
The relationship between the amount of power de-rating and the raw cubic metric is shown below
in Figure 2; the relationship determines the final cubic metric equation (without bandwidth effects). The
points for this plot are taken from Table 3 for signals ‘A’ through ‘D’ and Table 4 for signals E through
G. This corresponds to selecting bandwidth normalized results for the 4.51 MHz bandwidth signals and
standard results for the standard 3.84 MHz bandwidth signals. A linear-best-fit regression line is
calculated and plotted among the data points. The slope of this line quantifies K from the cubic metric
equation for this set of signals. K for this set of signals is different from previous experiments using only
W-CDMA signals (K = 1.56 for LTE vs. K = 1.85 for W-CDMA). Standard error, σy, is 0.23 dB. This
term is the standard deviation of the error between measured data points and the regression line.
To show that CM is superior to PAPR in de-rating prediction, power de-rating vs. the increase in
PAPR over the voice case is plotted in Figure 3. A line with a slope of 1 and passing through the
reference W-CDMA data point, corresponding to predicting the de-rating directly from the increase in
PAPR above the reference signal, is also plotted. Standard error of PAPR prediction is 1.56 dB, on
average more than 1.33 dB poorer than CM prediction.
As described earlier, an empirical correction must be determined for signals ‘A’ through ‘D’ that
relates the rescaled equivalent bandwidth measurements back to measurements made using the standard
method (where actual measurement bandwidths and channel spacings are deployed). The average
difference between the bandwidth normalized measurements and standard measurements is shown in
Figure 4. The average difference, 0.77 dB, is applied as an offset to the regression line from Figure 2.
This offset will be used to modify the CM equation to account for signals of different occupied
bandwidths. One implication of this result is that there is a penalty for increasing spectral efficiency
(increasing signal bandwidth without modifying channel spacing). Methods to mitigate the bandwidth
offset will be discussed in a related report [2].
While this empirical offset only applies to the set of signal and filter bandwidths and offsets
studied in this paper, it is worth noting that the ratio of bandwidths 4.51/3.84 is equal to 0.70 dB. The
proximity of this theoretical value to the empirical 0.77 dB result is probably not a coincidence suggests
an area for further study.
4](https://image.slidesharecdn.com/cubucmetricin3gpplte-111022151821-phpapp02/85/Cubuc-metric-in-3-gpp-lte-4-320.jpg)
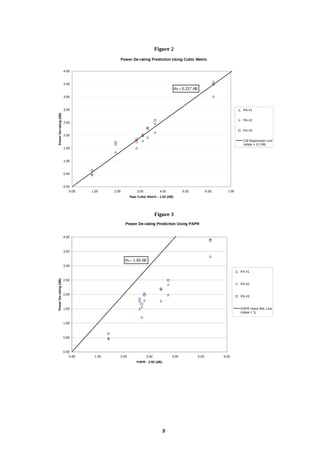
![Figure 4
ACLR Filter Offset Adjustment
For Bandwidth Normalized Signals
5.00
4.50
4.00
5.0 MHz Filter Offset
3.50
Power De-rating (dB)
3.00 5.87 MHz Filter Offset
2.50
CM Regression Line
(slope = 1/1.56)
2.00
Offset CM Regression
1.50 Line (offset = 0.77 dB)
1.00
0.50
0.00
0.00 1.00 2.00 3.00 4.00 5.00 6.00 7.00
Raw Cubic Metric - 1.52 (dB)
Conclusion
• Results show that the prediction accuracy of CM is superior to that of PAPR.
• Measuring the higher bandwidth signals (‘A’ through ‘D’) with scaled adjacent channel
definitions does not give the actual de-rating in real system performance (measurement with
system defined adjacent channel offset). A de-rating increase of 0.77 dB from the CM regression
line can be used to estimate the actual de-rating of higher bandwidth signals. (Note this empirical
offset only applies to the set of signal and filter bandwidths and offsets studied in this paper).
• The amount by which the power capability of a UE power amplifier must be de-rated for LTE
signals with 4.51MHz nominal bandwidth can be summarized by equation (1):
CM =
3
[
20 log10 {rms vnorm ( t ) } − 1.52 ]
+ 0.77 dB (1)
1.56
where 0.77 dB is the increase in CM due to the change in signal bandwidth relative to 3.84 MHz,
if there is no change in relative bandwidth then equation 2 below applies
• The amount by which the power capability of a UE power amplifier must be de-rated for LTE
signals with 3.84MHz nominal bandwidth can be summarized by equation (2).
CM =
3
[
20 log10 {rms vnorm ( t ) } − 1.52]dB (2)
1.56
• The final CM for each signal is shown in Table 5 below and is plotted against measured power
de-rating (using standard measurement method results from Table 4) in Figure 5. The standard
error of the final estimate is 0.187 dB.
6](https://image.slidesharecdn.com/cubucmetricin3gpplte-111022151821-phpapp02/85/Cubuc-metric-in-3-gpp-lte-6-320.jpg)
![Table 5 – Final CM Summary
Signal Bandwidth
Type Modn Raw CM (dB) K Offset (dB) CM (dB)
WCDMA voice 1.52 - 0.00 0
OFDM 16-QAM 7.75 1.56 0.77 4.76
DFTS-OFDM QPSK 3.44 1.56 0.77 2.00
DFTS-OFDM 16-QAM 4.85 1.56 0.77 2.90
DFTS-OFDM 64-QAM 5.18 1.56 0.77 3.11
IFDMA QPSK 2.40 1.56 0.00 0.56
IFDMA 16-QAM 4.36 1.56 0.00 1.82
IFDMA 64-QAM 4.64 1.56 0.00 2.00
Figure 5
Final CM For LTE Signals
5
4.5
σy = 0.187 dB
4
3.5
Power De-rating (dB)
3
2.5 Measured Data
(standard method)
2 CM Power De-
rating Prediction
1.5
1
0.5
0
0 0.5 1 1.5 2 2.5 3 3.5 4 4.5 5
CM (dB)
References
[1] R1-040642, “Comparison of PAR and Cubic Metric for Power De-rating”, 3GPP RAN WG1 #37, Montreal 2004.
[2] R1-060144, “UE Power Management for E-UTRA”, 3GPP RAN WG1 LTE Adhoc, Helsinki 2006.
7](https://image.slidesharecdn.com/cubucmetricin3gpplte-111022151821-phpapp02/85/Cubuc-metric-in-3-gpp-lte-7-320.jpg)

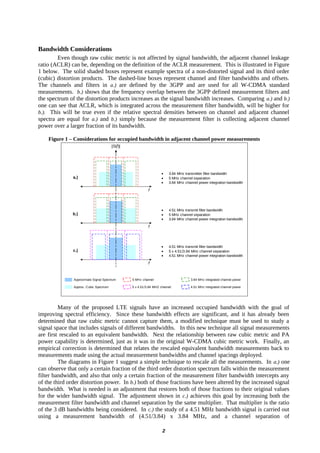
This document discusses analyzing potential long-term evolution (LTE) signals using the cubic metric (CM) to predict power amplifier (PA) power de-rating. It reviews how CM has been shown to be more accurate than peak-to-average power ratio for various signals. The document proposes a methodology to analyze several proposed LTE uplink signals with varying PAPR and CM using rescaled equivalent bandwidth measurements and an empirical correction to relate them to actual measurement configurations. Table 1 describes the seven signals to be tested, including OFDM, DFTS-OFDM and IFDMA signals with varying modulation schemes and bandwidths.


![B AMC Presentation (Icns 2009) V Final [13 May2009]](https://cdn.slidesharecdn.com/ss_thumbnails/b-amcpresentationicns2009vfinal13may2009-090513230510-phpapp02-thumbnail.jpg?width=640&height=640&fit=bounds)


