SlideShare a Scribd company logo
Crime, Punishment, and Prejudice∗
                      Philip A. Curry†                     Tilman Klumpp‡
                   Simon Fraser University                Emory University

                                           June 2008


                                            Abstract
           We examine the link between the penalties used to punish convicted criminals,
       and judicial prejudice against defendants. In our model, agents choose to commit
       crimes if their privately observed utility from doing so is high enough. A crime
       generates noisy evidence, and defendants are convicted when the realized amount
       of evidence is sufficiently strong to establish the probability of guilt beyond a fixed
       threshold. We show that if convicted offenders are incarcerated, poorer individuals
       face a strong prior prejudice in trials and are therefore convicted with less evidence
       than members of the other group. At the same time, they commit crimes more
       frequently. Penalties such as monetary fines can eliminate this bias, but may also
       reverse it. We fully characterize the penalty schedule that guarantees an unbiased
       equilbrium. We extend the model such that agents also differ in characteristics
       such as race or gender. We show biased outcomes (targeted at subgroups of the
       population) may still exist, even if all members of the population are ex-ante alike
       in their economic characteristics.

       Keywords: Crime, punishment, statistical discrimination, stereotypes, prejudice.

       JEL code: D82, J71, K14, K42.


  ∗
     We thank the editor Kai Konrad and two anonymous referees for their helpful suggestions. We
also thank David Bjerk, Amie Broder, Steve Easton, Hugo Mialon, Scott Moss, Paul Rubin, David
Scoones, Xuejuan Su, Eric Talley, as well as participants at the 2006 Meetings of the Canadian Law
and Economics Asociation, and the 2007 Meetings of the American Law and Economics Association,
for fruitful discussions.
   †
   Department of Economics, Simon Fraser University, 8888 University Dr., Burnaby, BC, V6A 1S6,
Canada. E-mail: pcurry@sfu.ca.
   ‡
    Corresponding author. Department of Economics, Emory University, Rich Building 316, 1602
Fishburne Dr., Atlanta, GA 30322, USA. E-mail: tklumpp@emory.edu.
“It is in justice that the ordering of society is centered.”
                                                                                        — Aristotle


1        Introduction
Criminal conviction rates in the United States differ drastically across racial groups.
The jail incarceration rates for African-Americans, for example, is 800 people per
100,000, while the rate for white Americans is 166 per 100,000. An estimated 12%
of U.S. black males in their late twenties were incarcerated in 2005, as opposed to
1.7% of white males.1 That these differences exist is undisputed. It is much less clear,
however, why they exist. One possible explanation is that blacks commit more crimes
than whites. For example, criminal participation tends to be correlated with economic
characteristics such as income, education, or area of residence, and these characteristics
differ across racial groups. Another possibility is that the criminal justice system is
somehow “biased” in that blacks are more easily convicted than whites are.
    This paper pursues a twofold objective. First, we demonstrate that differences in
crime rates as well as judicial prejudice against certain individuals can arise simultane-
ously in a single model. Second, we ask whether our model can inform policies aimed
at reducing racial differences in the criminal justice system. The suggestions we derive
from our framework are novel and perhaps unexpected: To understand, and perhaps
reduce, the aforementioned differences, one should consider the way by which certain
crimes are punished.
    In our model, a Bayesian jury must decide whether a given amount of evidence
is sufficient to convict a defendant. Suppose that the defendant is sent to prison if
convicted. Because the deterrence effect of incarceration increases in the defendant’s
wealth, richer individuals are ex-ante less likely to commit crimes than poorer ones.
Economic variables such as the defendant’s income or social status may hence enter
the jury’s prior belief (i.e. their prejudice) about the guilt of the defendant.2 Our
framework thus exposes a new mechanism by which economic differences across indi-
viduals can cause differences not only in criminal behavior, but also in how defendants
are treated in the courts. We then consider the possibility that income differences not
only generate prejudice, but are also the result of such prejudice. For example, persons
believed to be more prone to criminal behavior may have a harder time finding well-
paying employment opportunities. Such persons are therefore poorer and less likely to
be deterred by the threat of losing their income, justifying the initial prejudice. If there
are multiple equilibria, in each of which an individual’s income is consistent with the
    1
        Source: Bureau of Justice Statistics Prison and Jail Inmates at Midyear 2005.
    2
    We assume that convictions are issued if only if the posterior probability of guilt is beyond a
certain threshold of reasonable doubt, which is the same for all individuals. However, since there are
differences in prior beliefs, the amount of evidence required to convict a defendant must differ across
defendants.


                                                     1
judicial bias against the individual, a social norm may develop that associates different
subgroups of the population with different such equilibria. In such an overall “stereo-
typing equilibrium,” race or ethnicity serves as a coordination device through which
individual roles and commonly expected behaviors are developed.3 Corrective policies
aimed solely at the labor market, such as affirmative action, may then have a limited
effect because of discrimination in the judicial system.
    We show that other forms of punishment can, in principle, eliminate such outcomes.
In particular, the adoption of a schedule of monetary fines (which may depend on the
defendant’s wealth) as a means of punishment may reduce unfavorable prejudice. For
certain felonies such monetary penalties may indeed be considered an alternative to
incarceration.4 We remark that, at this point, we do not undertake any formal welfare
analysis of different approaches to punishing criminals. We do not formally consider
the costs to either crime or corrections. There are many reasons, besides the one
examined in this paper, why one form of punishment may be preferable over another.
Our concern here is with which types of penalties can lead to judicial biases, and which
ones do not.
    Our paper is related to several strands of theoretical literature (empirical papers,
as they relate to our assumptions and results, will be discussed later in Section 3 and
Section 4.) Our work contributes to the research on the optimal use of fines and impris-
onment (e.g. Becker, 1968; Posner, 1992; Polinsky and Shavell, 1984; Morris and Tonry,
1990; Levitt, 1997; and many others). No attempt of a thorough review of this exten-
sive literature will be made here. The idea that the deterrence effect of a jail sentence
may depend on the defendant’s income appears in Lott (1987), and Spiegel and Tem-
pleman (1989); however, neither considers how this affects jury beliefs in equilibrium,
or how an unbiased penalty schedule can be constructed. Our stereotyping argument is
related to the literature on statistical discrimination in labor markets, which includes
seminal contributions by Phelps (1972) and Arrow (1973), and important applications
by Coate and Loury (1993) and others. An application to crime is Verdier and Zenou
(2004), who examine a model of statistical discrimination, location choice, and criminal
activity; however, their paper neither examines Bayesian updating in the courts nor the
impact of various forms of penalties on beliefs. Finally, several papers consider racial
profiling by the police (e.g. Knowles et al., 2001; Persico, 2002; Alexeev and Leitzel,
2004; Bjerk, 2007). These papers assume ex-ante differences in criminal behavior across
racial subgroups and are not concerned with how such difference might come to be.5
   3
    In economic terms, racial labels are “sunspots”: economically meaningless events, which derive
significance only because they coordinate individual actions and social expectations.
   4
    For example, West Germany in 1969 eliminated prison sentences of under six months from its
penal code and, except for rare circumstances, replaced them with day fines. Several other European
countries, and some Latin American countries, have adopted similar systems, and U.S. courts have
been experimenting with replacing jail time by montary sanctions since the 1980s (Hillsman, 1990).
   5
   There is also a literature on false beliefs by prosecutors and judges (e.g. Georgakopoulos, 2004;
Burke, 2007). In our paper, on the other hand, all beliefs will be correct in equilibrium.


                                                 2
We proceed as follows. Section 2 describes our theoretical model, assuming that
agents’ economic characteristics are exogenously given and observable. In Section 3
we derive a number of results for this case, as well as various comparative results
with respect to different forms of penalties. In Section 4 we look at the possibility
of statistical discrimination when there is a feedback from prejudice to income. In
Section 5, we discuss some policy implications of our model. In particular, we contrast
our findings with possible interventions in the labor market or in the courts directly.
Most proofs are in the Appendix.


2       A Model of Crime, Punishment, and Prejudice
In our model, an individual must decide whether to commit a crime, and a judge or
jury must decide whether to convict and punish a defendant accused of committing a
crime. The individual is characterized by an exogenously given and publicly observable
variable w ∈ [w, ∞) (where w > 0), which we refer to as the individual’s type. Ceteris
paribus, individuals of a higher type receive a higher payoff, so that one may regard w
as an agent’s wealth, income, or social status. The events unfold as follows.

    1. The individual comes across an opportunity to commit a crime. The benefit to
       committing this crime is η ∈ [0, ∞), which is privately observable and drawn
       according to distribution Q. Q is continuous on [0, ∞) and independent of w.
       The individual’s decision is denoted d ∈ {0, 1}. If the crime is committed (d = 1)
       the individual receives the benefit η.

    2. If the individual has committed a crime, an investigation is initiated with cer-
       tainty. If the individual has not committed a crime, there is a probability
       λ ∈ (0, 1) that an investigation is initiated “by accident.” The assumption of
       an accidental investigation introduces the possibility that a person who faces
       trial is innocent.6

    3. If under investigation, a random amount of evidence t ∈ [0, 1] against the individ-
       ual is discovered. If the individual has committed the crime, t is a random draw
       from distribution F . In case of accidental investigation, t is drawn from G. We
       assume that F and G have support [0, 1], are continuous with densities f and g,
       and that f (t)/g(t) increases strictly in t. A higher value of t hence means stronger
    6
     If this possibility did not exist, every defendant would be guilty and criminal trials would be
meaningless. There are several possibilities why innocent persons may be investigated for a crime.
First, a person may be charged with a crime that has in fact happened, but which was committed by
somebody else. Second, an individual may be under investigation for events which may or may not
be the result of a crime. Consider, for example, an area such as tort law: Damaging events may take
place which may or may not be the result of negligence, and at trial it must be determined whether
the individual should be held responsible. Thus, even if the individual did in fact behave responsibly,
it is possible that he is tried and held responsible for damages that were caused by chance.


                                                  3
evidence against the individual. We further make the technical assumptions that
      0 < f (0) < ∞ and 0 < g(0) < ∞.

   4. After the evidence is discovered, the individual becomes a defendant and has to
      stand trial. A jury observes w as well as t and forms belief θ(w, t) = P [d = 1|w, t],
      which is the probability that the individual is guilty conditional on observables.
      The individual is convicted if θ(w, t) ≥ α, where α ∈ (0, 1) represents the standard
      of proof.7

    If the individual is not investigated, or if he is investigated and subsequently acquit-
ted, he receives utility u(w). We assume that u is twice differentiable with u (w) > 0
and u (w) ≤ 0.

2.1    Penalties
If the jury convicts the defendant (rightfully or wrongfully), the defendant is sentenced
to a punishment which reduces the payoff to the individual. We model punishments
by means of a penalty schedule, which is a mapping

                                       ρ : [w, ∞) → R

such that ρ(w) ∈ [0, w]. The interpretation is that, when sentenced, the individual’s
type is decreased by the amount ρ(w). By using the concept of a penalty schedule, we
can examine many important cases of penalties in our model:

Example 1. To characterize a (simple) fine, let δ be the constant amount an individual
must pay if convicted. Then the fine corresponds to the penalty schedule ρ(w) = δ.
For all individuals to be able to pay this fine, we assume that δ ≤ w.

Example 2. To characterize a prison sentence, let u0 be the fixed utility an individual
receives in prison; and set w0 = u−1 (u0 ). Then a prison sentence corresponds to the
penalty schedule ρ(w) = w − w0 . We assume that u0 > −∞.

Example 3. More generally, ρ can be a means-adjusted penalty. For example, a
proportional fine is given by the penalty schedule ρ(w) = γw, where γ ∈ (0, 1) is the
fraction of income taken away from convicted individuals.

2.2    The jury
At trial, the jury computes a belief of the defendant’s guilt through Bayesian updating.
Specifically, let p(w) denote the jury’s prior belief that an individual of income w
commits a crime. We will call p(w) the prejudice held against individuals of income w.
  7
    The interpretation is that courts must determine whether or not the evidence establishes the
defendant’s guilt beyond a “reasonable doubt.” In our model, α quantifies what reasonable means.


                                               4
The posterior Bayesian likelihood that the investigated individual is guilty, conditioning
on evidence t, is then

                                                    p(w)f (t)
             θ(w, t) ≡ P [d = 1|w, t] =                               ∈ [0, 1].       (1)
                                          p(w)f (t) + λ(1 − p(w))g(t)

Given that f (t)/g(t) increases, θ(w, t) increases in t and in p(w). Now recall that we
assume that the jury convicts the defendant if and only if the evidence results in a
posterior likelihood of the defendant’s guilt of at least α. Given α, let t(w) be such
that
                                    α = θ(w, t(w));
t(w) is then the conviction threshold that is applied to individuals of income w. Note
that α is the same for all defendants. However, because the jury’s prior belief depends
on the defendant’s type w, the actual amount of evidence t(w) required to prove guilt
beyond probability α depends on w.

2.3     The individual’s decision
Let m1 (w) denote the probability that an individual of income w is convicted condi-
tional on having committed the crime, and let m0 (w) denote the probability that the
same individual is (wrongfully) convicted conditional on not having committed the act.
We can express the probability of conviction following a crime from the individual’s
perspective as

           m1 (w) = P [θ(w, t) ≥ α|d = 1] = P [t ≥ t(w)|d = 1] = 1 − F (t(w)),

and the probability of wrongful conviction as

        m0 (w) = λP [θ(w, t) ≥ α|d = 0] = λP [t ≥ t(w)|d = 0] = λ(1 − G(t(w))).

The crime is then committed if and only if

                          η > q(w) ≡ [m1 (w) − m0 (w)] ∆(w),

where
                              ∆(w) = u(w) − u(w − ρ(w))
denotes the utility loss the individual experiences when sentenced under the penalty
schedule ρ. The variable q(w) is the expected cost of committing the crime, so that
the defendant decides to commit the act when the benefit of doing so, η, exceeds the
expected cost, q(w). We call q(w) the decision threshold for the individual.


                                              5
2.4     Rational expectations equilibrium
An equilibrium of this model consists of three elements: A prior belief, or prejudice,
for the jury (p(w)), a decision threshold for the individual (q(w)), and a conviction
threshold for the jury (t(w)). Note that these elements are functions of the individual’s
type w. We say that the tuple (p∗ , q ∗ , t∗ ) constitutes a rational expectations equilibrium
if it satisfies the following conditions:

    1. The prejudice toward defendants with income w is consistent with the probability
       that these agents actually commit crimes:

                                       p∗ (w) = 1 − Q(q ∗ (w)) ∀w.                                   (2)

    2. The decisions of agents with income w to commit crimes are optimal, given the
       conviction thresholds t∗ (w) applied to these individuals:

                       q ∗ (w) = [1 − F (t∗ (w)) − λ(1 − G(t∗ (w)))] ∆(w) ∀w.                        (3)

    3. The jury convicts a defendant if and only if the evidence establishes the defen-
       dant’s guilt beyond probability α, where this probability is computed by Bayes’
       Rule using the prejudice p∗ (w) as the prior:

                                           θ(w, t∗ (w)) = α ∀w.                                      (4)


3       Equilibrium Analysis
The following result establishes existence of equilibrium, as well as a condition for
uniqueness.

Lemma 1. A rational expectations equilibrium exists. Furthermore, if λ ≤ λ ≡
f (0)/g(0), the equilibrium is unique.

    We now examine how the equilibrium values p∗ (w), q ∗ (w), and t∗ (w) depend on
the individual’s type w. Throughout, we assume that the probability of accidental
investigation is small enough (0 < λ ≤ λ ) so that a unique equilibrium is guaranteed
by Lemma 1.8 We say that the equilibrium is biased against lower types if w > w
implies
                   p∗ (w) < p∗ (w ), t∗ (w) > t∗ (w ), q ∗ (w) > q ∗ (w ).
    8
     If the probability of an accidental investigation were large enough, then there could exist an equi-
librium in which a large number of people believe they will be convicted even if they don’t commit the
crime, so the crime rate is high and jurors require little evidence to convict, supporting the original
beliefs. This equilibrium would coexist with another one in which people did not believe there is much
chance that they would be convicted if they do not commit the crime, and so jurors require a lot of
evidence, again justifying the original beliefs.


                                                   6
That is, the jury favors richer defendants and applies a lower conviction threshold
to poorer ones. Conversely, richer defendants are less likely to commit a crime. An
equilibrium is biased against higher types if the reverse inequalities hold. Finally, if p∗ ,
q ∗ and t∗ are constant, the equilibrium is unbiased.

3.1   Penalties and equilibrium bias
An individual’s type w enters the equilibrium in condition (3), through the utility loss
∆(w). If ∆ increases—for example, if prison is used as punishment—richer defendants
are penalized more severely than poorer ones if convicted. One should then expect that
these individuals are more deterred by the threat of punishment and hence commit
crimes less frequently. The opposite should be expected if ∆ was decreasing in w.
While this argument is quite intuitive, it is important to recognize that we are looking
at an equilibrium relationship between several variables. In particular, the utility loss
effect is fully taken into account at trial: Jurors who realize that some individuals are
more severely affected by a particular punishment than others will think it less likely
that these individuals commit a crime. In equilibrium, therefore, jurors will entertain a
prejudice that favors those who experience large losses from punishment. These types
are less likely to be convicted should they commit a crime, which acts against the larger
utility loss if convicted. This effect creates a countervailing incentive to commit more
crimes. A priori, it is not obvious which of the two effects is stronger. Our next result
shows that the net effect is in the same direction as the utility loss effect:

Lemma 2. The equilibrium is (a) biased against higher types if ∆(w) strictly decreases
in w, (b) biased against lower types if ∆(w) strictly increases in w, and is (c) unbiased
if ∆(w) is constant.

   In order to determine whether a bias can arise for a certain penalty schedule, we
need to examine the monotonicity properties of ∆ implied by the penalty. To achieve
an unbiased equilibrium, the penalty schedule ρ must be such that ∆ is constant:
∆(w) = ∆ for all w, where ∆ is the utility loss inflicted on every convicted defendant
regardless of his type w. Differentiating ∆, we obtain

                        ∆ (w) = u (w) − (1 − ρ (w))u (w − ρ(w)).                         (5)

For unbiasedness we need ∆ (w) = 0, so that the penalty schedule ρ must satisfy the
differential equation
                                  u (w − ρ(w)) − u (w)
                          ρ (w) =                      .                        (6)
                                      u (w − ρ(w))
To solve for ρ, one requires an initial condition. This can be obtained by computing the
penalty ρ(w) required to achieve the desired utility loss for the lowest type: ∆(w) =
u(w) − u(w − ρ(w)) = ∆, or

                               ρ(w) = w − u−1 (u(w) − ∆).                                (7)

                                             7
The differential equation (6) describes how to trace out the penalty schedule ρ that
maintains the same utility loss ∆ for all types above w.9 This condition represents
a knife-edge case, in that it characterizes exactly those penalty schedules which lead
to unbiased equilibria. Departing from the knife-edge case in either direction leads to
biased equilibria. Specifically, using the same steps as above, the equilibrium is biased
against lower types if
                                      u (w − ρ(w)) − u (w)
                             ρ (w) >                       .                         (8)
                                          u (w − ρ(w))
and biased against higher types if

                                           u (w − ρ(w)) − u (w)
                                 ρ (w) <                        .                                   (9)
                                               u (w − ρ(w))

    From (6)–(9) it is apparent that the direction of equilibrium bias depends on the
utility function u as well as the penalty schedule ρ. Of course, if the utility loss
∆ induced by u and ρ is non-monotonic in w, the equilibrium is neither biased nor
unbiased according to our definitions. In this case, there would be a local bias against
lower types at some values of w, and a local bias against higher types at other values
of w.

3.2    Prison vs. fines
As shown earlier, our model encompasses many types of punishments commonly used
in the real world, such as prison sentences, simple fines, and means-adjusted fines. In
this section, we examine if these types of punishments lead to biased equilibria. The
next result states a number of sufficient conditions for unbiased and biased equilibria.

Theorem 3. The equilibrium is

 (a) unbiased if punishment is by a simple fine and individuals are risk-neutral,

 (b) unbiased if punishment is by a proportional fine and individuals have logarithmic
     utility,

 (c) biased against lower types if punishment is by imprisonment, and

 (d) biased against higher types if punishment is by a simple fine and individuals are
     strictly risk averse (i.e. u (w) < 0 ∀w).
   9
     Note that (6)–(7) describe the solution to a mechanism design problem which is quite similar
to, say, the problem of designing an auction or other allocation mechanism: Similar to an incentive
compatibility constraint, the unbiasedness requirement leads to a solution in terms of the slope of the
design object (the penalty schedule in this case). Similar to the individual rationality constraint, the
fact that a certain deterrence effect must be created for the lowest type yields an initial condition.


                                                   8
Thus, imprisonment automatically leads to a bias against lower types, and the
opposite is true for simple fines if agents are risk averse. A proportional fine, on
the other hand, is an intermediate form of punishment, and Theorem 3 (b) identifies a
special case for which it leads to unbiased equilibria. Note that with logarithmic utility,
the utility loss from a proportional fine can be written as

          ∆(w) = ln w − ln(1 − γ)w = ln w − ln(1 − γ) − ln w = − ln(1 − γ),

which is independent of w. Generally, however, a proportional fine can result in an
equilibrium bias.
    To examine the effects of different forms of punishment further, we now derive a sim-
ple sufficient condition for equilibrium bias in terms of risk preferences and elasticities.
First, let R(w) denote the coefficient of relative risk aversion of u at w:

                                                 u (w)
                                   R(w) = −w           .
                                                 u (w)

Observe that risk-neutral utility has R(w) = 0, and logarithmic utility has R(w) = 1.
Second, let ε(w) denote the elasticity of ρ at w:

                                                ρ (w)
                                     ε(w) = w         .
                                                ρ(w)

Observe that a simple fine has ε(w) = 0, a proportional fine has ε(w) = 1, and a prison
sentence has ε(w) > 1 if w0 > 0. We have the following result:

Theorem 4. The equilibrium is (a) biased against higher types if R(w) > 1 and ε(w) ≤
1 ∀w, and (b) biased against lower types if R(w) < 1 and ε(w) ≥ 1 ∀w.

    Note that the “separating line” between cases (a) and (b) in Theorem 4 is the knife-
edge case of logarithmic utility and a proportional fine. Suppose now that relative risk
aversion increases above the logarithmic case. In this case, poorer individuals will
experience more disutility if the same fraction of their income is confiscated, compared
to richer individuals. Similarly, if we assume logarithmic utility but decrease the income
elasticity of the penalty below the proportional case, poorer individuals are again hurt
more by the penalty than richer ones. Thus, when both changes occur together, the
deterrence effect ∆ unambiguously decreases in w, and as Theorem 4 (a) states the
equilibrium will be biased against higher types. An analogous intuition applies to case
(b), of course.
    Table 1 summarizes our results in the previous two Theorems. The superscripts
indicate the relevant theorems. (If the utility function u is such that its degree of risk
aversion is not uniformly above or below one, then Table 1 is still informative about
the local bias in a neighborhood of a certain value of w.)
    The practical relevance of our results hinges on whether the various forms of pun-
ishments do in fact impart a differential deterrence effect on individuals with differing

                                            9
Preferences                                        Penalties
                           Simple Fine            Proportional Fine            Imprisonment

    R(w) = 0                unbiased 3(a)             against low 4(b)           against low 3(c)

    R(w) ∈ (0, 1)         against high 3(d)           against low 4(b)           against low 3(c)

    R(w) = 1              against high 3(d)            unbiased 3(b)             against low 3(c)

    R(w) > 1              against high 3(d)           against high 4(a)          against low 3(c)


           Table 1: Equilibrium bias for different penalties and risk preferences


economic means. As noted in the introduction, the result that jail overdeters the rich
and underdeters the poor is common in the theoretical literature. Empirically, research
by Grasmick and Bryjak (1980) shows that individuals generally differ in how severe
they perceive various forms of criminal sanctions. Unfortunately, their study does not
relate perceived severity to economic covariates. Other papers have demonstrated a
negative relationship between wages and employment on the one hand, and criminal
participation on the other (e.g. Myers, 1983; Grogger, 1998; Gould et al., 2002). How-
ever, these studies leave unanswered the question whether this relationship is due to
deterrence effects.10 Bar-Ilan and Sacerdote (2004) examine the response of red-light
violations to fine increases in Israel and San Francisco. The study finds that the elas-
ticity of violations to fines is larger for younger drivers and owners of older cars, both
of which are correlated with the driver’s affluence.11


4        Social Norms and Statistical Discrimination
The previous section offered an explanation for why poorer individuals may be treated
less favorably than richer ones in the courts. If income or wealth is correlated with
    10
    There are many competing explanations. Low-wage earners may offend more because they have
more to gain from crime, especially property crime. Similarly, unemployed individuals may participate
in crime at a higher rate because they have more time to do so.
    11
    As far as prison is concerned, anecdotal evidence suggests that its deterrence effect is large
for the very affluent, and small or even negative for the very poor. For example, the 2002
Sabanes-Oxley Act increased the potential prison sentences for certain types of accounting fraud,
a crime typically committed by affluent offenders undeterred by financial penalties. At the other
end of the spectrum, on May 29, 2008, West Palm Beach, Florida, NBC affiliate WPTV re-
ported on a homeless man who committed a drug crime in order to be sent to jail. The re-
port quoted the man saying “I feel so much more free here. You can’t be free out there.”
(See http://www.wptv.com/news/local/story.aspx?content id=3f6063d4-b79d-4f8f-8d78-2103dc
8998ba.)


                                                 10
other characteristics, such as a person’s race, then the story we told can explain why
racial groups with poorer members may also be the ones whose members are more
easily convicted of crimes.12 In this section, we dispose of the assumption that indi-
viduals differ in terms of their income ex-ante. We show that prejudice against certain
identifiable subgroups of the population may nevertheless exist.

4.1    An extended model
In our extended model, there are L ≥ 2 subgroups of the population. Membership
in one group is a label l ∈ {1, . . . , L} that is publicly observable but a priori without
economic significance. Thus, in contrast to the previous section, all agents are ex-ante
alike with respect to such characteristics as their productivity, human capital, etc.,
which may influence a person’s income. We assume instead that differences in the
realized value of an agent’s income are the direct result of the bias held against the
agent’s group in the justice system. In particular, we let v : [0, 1] → [w, w] (w < w < ∞)
describe an agent’s income as a function of the prejudice held against the agent.
    We assume that v is continuous and weakly decreasing. This reflects the idea that it
may be harder for a person to find a job, or a high-paying job, if this person is assumed
to be more prone to criminal behavior. This can be for several reasons. First, criminal
activity may adversely affect an individual’s productivity in a job, for example because
of increased absenteeism. Second, criminal activity may be targeted at the employer
directly, for instance by stealing from a job site. Third, an employer may liable for an
employee’s criminal actions when the employee harms a customer or another employee
(under the legal theories of respondeat superior and negligent hiring).
    There is empiricial evidence that a feedback channel from (perceived) criminality
to labor market outcomes indeed exists. Numerous studies find a negative impact of
observed prior convictions on labor market outcomes, suggesting that employers are
adverse to hiring convicted criminals (e.g. Lott, 1992; Grogger, 1995; Nagin and Wald-
fogel, 1998; and many others). Other papers measure the effects of perceived crim-
inality toward minorities on labor market outcomes. Bushway (2004) demonstrates
that the black-white wage ratio is higher in states where criminal records databases
are more easily accesible to employers. Holzer et al. (2006) show that employers who
routinely conduct criminal background checks of applicants are more likely to hire
African-American applicants than employers who do not perform routine checks (after
controlling for characteristics of each firm’s applicant pool). Both studies suggest that
in the absence of information about an individual’s criminal history group character-
istics such as race may be used by employers to make inferences about an applicant’s
criminality, and that such inferences are indeed used in hiring or pay decisions.
  12
    Even if the income distribution is the same within all racial groups, it is possible that differences in
criminal participation and convictions emerge: If there are multiple prejudice levels consistent with a
particular income level (which is possible if the probability of accidental investigation is high enough),
then a person’s race may serve as a coordination device by which a particular equilibrium is selected.


                                                    11
4.2   Equilibrium
Since the only observable difference between individuals is that they belong to differ-
ent subgroups of the population, we now replace the prejudice p(w) against persons
of income w by a prejudice pl against persons who belong to group l. Similarly, re-
place q(w) by ql , and t(w) by tl . An equilibrium in this case is now a collection
(wl , p∗ , ql∗ , t∗ )l∈{1,...,L} such that for all l ∈ {1, . . . , L},
   ∗
       l          l

                           p∗ = 1 − Q(ql∗ ),
                            l                                                       (10)

                           ql∗ = [1 − F (t∗ ) − λ(1 − G(t∗ )] ∆l ,
                                          l              l                          (11)

                      θ(pl , t∗ ) = α,
                              l                                                     (12)
                           ∗
                          wl = v(p∗ ),
                                  l                                                 (13)
                  ∗        ∗       ∗
where ∆l = u(wl ) − u(wl − ρ(wl )) is defined as before. This is essentially the same
set of defining equations as (2)–(4), except that a fourth condition has been added
(condition (13)). This condition states that the equilibrium income level of group l,
wl , must be consistent with the prejudice level p∗ held against group l. We now say an
  ∗
                                                   l
equilibrium is biased if there exist two different groups l and l such that p∗ > p∗ . If
                                                                              l    l
such real inter-group differences arise in equilibrium, then these outcomes are “sunspot
equilibria.” An equilibrium is unbiased if p∗ = . . . = p∗ .
                                             1           L
    Equilibria can be derived from the intersection of p∗ (w) defined through (2) with
the income function v(p). Let

                     S = {(p, w) ∈ [0, 1] × [w, w] : p = p∗ (v(p))}

be the set of all intersecting points of the two curves. An equilibrium in the extended
model can then be constructed by assigning to each group l ∈ {1, . . . , L} an element
in S, corresponding to the prejudice p∗ against group l and the income level wl of its
                                         l
                                                                                 ∗

members. If S = ∅ an equilibrium exists, in which case there must be an unbiased
equilibrium, as all groups can be assigned the same (p, w)-pair. However, if S contains
more than one element there are also biased equilibria, as any assignment of groups to
(p, w)-pairs contained in S represents an equilibrium in the extended model. We have
the following result

Lemma 5. Regardless of the punishment used, if 0 < λ ≤ λ there exists an equilibrium
in the extended model. Furthermore,

 (a) if ∆ strictly decreases in w or is constant, then the equilibrium is unique and
     unbiased, and

 (b) if ∆ increases in w, biased equilibria exist for certain income functions v.

   We illustrate Lemma 5 in Figure 1. Note that the income function v that is depicted
in both diagrams exhibits a drop at an interior p, and this will play a role for the

                                          12
multiplicity of equilibria in case (b) of the result. Such a drop can happen if there are
two main job types that pay different wages—managerial and simple jobs, say—and
each employer has a threshold for p at which they are willing to hire workers into the
high-wage job. If the job-specific wages and prejudice thresholds are similar across
firms, then the resulting income function will look like the one in Figure 1.

      w                                                w
               p*(w)                                               p*(w)


  w                                                w
  w*1


                                               w* = w*
                                                1    2


  w*                               v(p)                                         v(p)
    2
  w                                                w


        0     p*
               1
                             p*
                              2
                                          1              0     p* = p*
                                                                1    2
                                                                                       1


              Figure 1: Biased and unbiased equilibrium in the extended model


    The left diagram depicts the case of Lemma 5 (b), which applies to prison sentences.
A stereotyping equilibrium can arise, in which different identifiable subgroups face an
unfavorable bias in the courts. In this case, there are two groups: Group 1 earns a
relatively high income w1 and faces a relatively low prejudice p∗ . The opposite holds
                         ∗
                                                                1
for group 2. In contrast, the right diagram shows the same v-curve as before, but a
simple fine is used instead of prison to punish convicted agents. This corresponds to
Theorem 2 (a). It is easy to see that there cannot be multiple intersections of p∗ and
v now, so that the only equilibrium is an unbiased one.

4.3         Example: A dynamic link from prejudice to income
In this section, we provide an example that demonstrates how a feedback channel from
prejudice to income may arise within the criminal justice system. That is, we do
not rely on labor market interactions to generate discriminatory outcomes. By using
expected lifetime earnings as the relevant income variable, we show that the sanctions
imposed by the courts can be directly responsible for differences in lifetime earnings.
    Consider the following stylized environment. Agents live for infinitely many peri-
ods. At the beginning of each period, an agent works and earns a fixed wage of y, which
is the same for all individuals, unless the individual is imprisoned and earns zero. All

                                              13
income is consumed in the period it is earned, and at the end of each period the events
described in Section 2 unfold: Agents observe their i.i.d. η-shocks, decide whether
to commit the crime, and possibly stand trial. If an agent is convicted (rightfully or
wrongfully), he is removed from employment and sentenced to life in prison, represent-
ing a permanent reduction in income. Otherwise, the agent starts the next period as
a working individual. In computing their expected lifetime earnings, individuals apply
a discount factor β < 1 and do not include future realizations of η.13 At the time
the agent decides whether to commit a crime, the expected lifetime consumption for
an agent from the next period on, conditional on entering the next period as a free
individual, is
                                              β
                                v(p) =                y,
                                         1 − βξ(q, t)
where ξ(q, t) = [1 − Q(q)] F (t)+Q(q) [1 − λ(1 − G(t))] is the period-to-period “survival
probability” associated with the tuple (q, t). The deterrence effect of the punishment
is therefore the prospect of earning zero from the next period onward if convicted,
instead of earning an expected continuation utility v(p). We hence set ∆ = v(p) − 0 =
y · β/(1 − βξ(q, t)) and compute v(p) and p∗ (w) for the following parameter values:14

       y = 1, α = 0.95, β = 0.95, λ = 0.01, η ∼ U [0, 5], F (t) = t2 , G(t) = 2t − t2 .

The result is plotted in Figure 2. One can see that there are in fact three intersections
of the two curves. Thus, if there are two or more racial (or otherwise distinguishable)
groups in the population, whose members all earn y = 1 when not incarcerated, biased
equilibria can arise simply because two different groups can be “assigned” different
prejudice-lifetime income pairs which correspond to the intersections in Figure 2.
     This dynamic model can explain why some individuals choose to live a “life of crime”
and why this choice may be correlated with characteristics such as race. Consider an
individual in the high crime/low lifetime income group. Each time he decides whether
to commit a crime he compares the benefit (η), which is distributed equally across the
entire population, against the expected cost. The expected cost is that the individual
(with some probability) loses his criminal career and goes to jail. However, continuing a
life of crime is not a very enticing prospect either, because a career criminal expects to
be jailed sooner or later anyways. Such a person is therefore less likely to be deterred by
this prospect. The opposite holds for the choice to live a low-crime life, and the usual
stereotyping argument can be made to sort individuals into different such equilibria
based on some observable characteristic. The crucial aspect here is that, because
  13
    Unless η is literally regarded as the material benefit from a crime (for instance money stolen), this
assumption seems not unreasonable. For offenses such as drug consumption, it seems indeed natural
to impose a strong bias for the presence regarding the benefit η.
  14
    This is not entirely in line with some of our previous assumptions; for instance f (0) = 0 and η is
bounded in this example. However, these assumptions are sufficient to ensure equilibria existed but
not necessary, and our example illustrates that the same biased outcomes can also arise in other cases.


                                                  14
w


                                     v(p)


                                                 p*(w)


                                                                           p


    Figure 2: Numerical example, where v(p) is expected discounted lifetime income


group membership cannot be altered, it is not possible for individuals to break out of
the high-crime equilibrium—they would be treated in an adverse manner by the courts
even if they decided not to commit crime ever.
     Finally, note that in this example observed wages are entirely uncorrelated with
crime and conviction rates, while judicial stereotyping based on race still persists. This
is interesting, as several empirical studies find that in the U.S. race is predictive of the
incarceration rate even after controlling for economic factors (e.g. Bjerk, 2006; Krivo
and Peterson, 1996; Raphael and Winter-Ebmer, 2001; and Trumbull, 1989).


5     Discussion and Policy Implications
This paper demonstrates how statistical discrimination can result in the judicial system
in much the same way as economists have considered it in the labor market. Our
results yield a number of policy implications and suggest several extensions worthwhile
pursuing. Below, we discuss some of them.

Labor market interactions. It is worth discussing the linkage between discrimina-
tion in the criminal justice system and the labor market. As shown in Section 3, lower
incomes for certain groups can lead to increased incentives to commit crime. Such
labor market differences can themselves be the result of (past) discrimination in the
labor market. People who observe the increased crime rate among such groups may
conclude that members of these groups are inherently more likely to commit crime,
rather than attribute the increased crime to lower incomes. It is conceivable that such


                                            15
a prejudice can become self-fulfilling, even under policies which aim to eliminate these
income differences across groups (see, for example, Sah, 1991). Thus, discrimination in
the legal system which originally arose from discrimination in the labor market would
be unaffected by policies such as affirmative action.

Monetary vs. non-monetary sanctions. In order to eliminate prejudice in the
legal system, policies targeted at the courts can be employed. Obviously, the equiva-
lent policy to affirmative action—setting conviction quotas—would not be appealing.
However, we show that prejudices can be eliminated through the choice of punishment.
Biased equilibria arise when penalties are solely in terms of jail time, and the amount of
time is independent of the defendant’s type. On the other hand, fines and in particular
means-adjusted fines can avoid this problem. Of course, in order to achieve a desired
deterrence effect through fines, it is possible that the fine must be chosen so high that
some defendants would not be able to pay it (defendants are judgement proof). In
such a case, penalties that first confiscate an individual’s wealth and then assign jail
time based on the amount of fine left to pay would eliminate such equilibria. This form
of penalty is prescribed by Polinsky and Shavell (1984, 2000). Thus, the question as
to why jail (without first confiscating wealth) is used so frequently as a punishment
remains.

The role of information at trials. The discriminatory outcomes we explore in
Section 4 are the result of a “sunspot effect,” where labels such as race are used as
coordination devices. It is important to notice that the criminal justice system itself
can generate such sunspots through its record-keeping technology. A case in point is
whether or not juries should be informed of a defendant’s prior convictions. If this
characteristic is observable to the jury, it can act as a coordination device. That is,
there can be a social expectation that persons convicted before are more likely to
commit further crimes. This expectation can become self-fulfilling, for reasons similar
to the ones explored in Section 4.3. Moreover, this belief may be grounded in an entirely
different theory, namely that some individuals are inherently more prone to commit
crime than others.15 The obvious way to eliminate this bias is to restrict information
about prior convictions at trials. If this is not possible, then a schedule of graduated
penalties for repeat offenders (e.g. Emons, 2007) may be desirable, as it increases the
deterrence effect for individuals subject to an unfavorable prejudice (i.e., individuals
with prior convictions).

The effects of policing. In this paper we do not formally consider the process by
which suspects are apprehended and evidence is generated. Such an analysis could
be an interesting extension of the model we present. That is, one could investigate
how the results change when the evidence generating functions F and G are altered.
  15
     While this may or may not be the case, our argument is that the statistical discrimination theory
is observationally equivalent.


                                                 16
For example, if an increase in policing were to increase (proportionally) the evidence
generated for both innocent and guilty parties, then an increase in expenditures on
police would have no effect on the existence of a biased equilibrium. If, however, an
increase in policing increased evidence against guilty parties and decreased (or had no
effect) on evidence against innocent parties, then an increase in policing could eliminate
stereotyping equilibria. In order to explore the “true” properties of evidence generation,
empirical studies of the effect of policing (e.g. Knowles, Persico and Todd, 2001) could
perhaps be used. However, since it cannot be known with certainty if convicted parties
are actually innocent or guilty, it is unclear how much light such studies can ultimately
shed on this issue.


Appendix
We start with two preliminary observations. First, note that 1 − F (t) − λ(1 − G(t))
is weakly decreasing in t if and only if λ ≤ f (t)/g(t). Since f (t)/g(t) is increasing by
assumption, if λ ≤ λ then 1 − F (t) − λ(1 − G(t)) is non-increasing. For λ ≤ λ we
therefore get
                                    ∂
                       λ≤λ ⇒          q = [−f (t) + λg(t)] ∆ ≤ 0.                     (14)
                                   ∂t
Thus, if λ ≤ λ, an increase in the conviction threshold t indeed leads to a decrease in
the decision threshold q of the agent. Second, since 1 − F (1) − λ(1 − G(1)) = 0, we
have
                                                             1
                ∂
   λ≤λ ⇒          q = 1 − F (t) − λ(1 − G(t)) = −                [−f (s) + λg(s)] ds ≥ 0.   (15)
               ∂∆                                        t

Thus, if λ ≤ λ, an increase in the potential penalty ∆ leads to an increase in the
decision threshold q of the agent.

Proof of Lemma 1. To prove an equilibrium exists, we make a standard fixed point
argument. Fix any w and define three maps,

                            T1    : q → p : [0, ∞) → [0, 1],

                            T2w : t → q : [0, 1] → [0, ∞),

                            T3    : p → t : (0, 1) → [0, 1]

by (2), (3) (given w), and (4), respectively; these are all given in Section 2.4. Note
that T1 , T2w and T3 are continuous on their respective domains. T3 is well-defined
through (4) on (0, 1) only; however it can be extended continuously to [0, 1] by setting
T3 (0) = 1 and T3 (1) = 0. Further, as T2w is continuous on a compact domain, its image
is bounded. We can hence restrict the range of T2w , as well as the domain of T1 , to
[0, q (w)] for sufficiently large q (w). Now define a new map
    ˆ                           ˆ

               T w : [0, 1] × [0, q (w)] × [0, 1] → [0, 1] × [0, q (w)] × [0, 1]
                                  ˆ                              ˆ

                                              17
by setting T w (p, q, t) = (T1 (q), T2w (t), T3 (p)). Since T w is continuous and maps a
compact subset of R3 into itself, we can apply Brouwer’s fixed point theorem to show,
for given w, there exists (p∗ (w), q ∗ (w), t∗ (w)) such that

                    (p∗ (w), q ∗ (w), t∗ (w)) = T w (p∗ (w), q ∗ (w), t∗ (w));

thus it solves (2)–(4) simultaneously. Since such a fixed point can be constructed for
each w independently, an equilibrium as defined above exists.
      To prove uniqueness, let λ ≤ λ and suppose there are two equilibria, (p∗ , q ∗ , t∗ ) =
(p ∗ , q ∗ , t∗ ). Thus there exists w such that q ∗ (w) = q ∗ (w) (otherwise p∗ (w) = p∗ (w)

∀w by (2), which implies t∗ (w) = t∗ (w) ∀w, by (4), but then the equilibrium would
be unique). So suppose, without loss of generality, that q ∗ (w) > q ∗ (w) for some w.
Condition (2) then implies p∗ (w) < p∗ (w), and using (4) we have t∗ (w) > t∗ (w). If
λ ≤ λ then using (14) we get q ∗ (w) ≤ q ∗ (w), a contradiction. Hence the equilibrium is
unique if λ ≤ λ.

Proof of Lemma 2. Let w > w and suppose ∆(w) > ∆(w ). If p(w) ≥ p(w ), then by
condition (2), q(w) ≤ q(w ). However, by condition (4) and the fact that f /g increases,
we have t(w) ≤ t(w ). Thus if ∆(w) > ∆(w ) then (14)–(15) imply q(w) > q(w ),
which is a contradiction, and therefore p(w) < p(w ). From (4) it follows then that
t(w) > t(w ), and from (2) it follows that q(w) > q(w ). Exactly the opposite argument
can be made when w > w and ∆(w) < ∆(w ). Finally, when ∆ is a constant then
(3) is independent of w so that p∗ , q ∗ , and t∗ are constant and hence constitute an
unbiased equilibrium.

Proof of Theorem 3. If u (w) = 0, then ∆ (w) = u (w) − u (w − δ) = 0, and Lemma 2
(iii) implies (a). If ρ(w) = γw and u(w) = a ln w + b, then ∆ (w) = a/w − a/w = 0,
and Lemma 2 (iii) implies (b) as well. In case of imprisonment, ∆(w) = u(w) − u(w0 ),
which is strictly increasing in w since u (w) > 0, and applying Lemma 2 (ii) yields (c).
In case of a simple fine, ∆(w) = u(w) − u(w − δ), which is strictly decreasing in w if
u (w) < 0 ∀w. Thus, applying Lemma 2 (i) yields (d).

Proof of Theorem 4. Suppose R(w) > 1 for all w, or equivalently −γwu (γw)/u (γw) >
1 ∀γ, and thus
                    ∂
                       γu (γw) = u (γw) + γwu (γw) < 0 ∀γ.                    (16)
                    ∂γ
Let µ(w) = w − ρ(w) be the income left to the individual after the fine ρ(w). Since
µ(w) < w, (16) implies
                                                  1
               µ(w)
                    u (µ(w)) = u (w) −                   γu (γw) dγ > u (w).            (17)
                w                               µ(w)/w

Suppose now that ε(w) ≤ 1 ∀w: wρ (w)/ρ(w) ≤ 1. Multiplying this inequality by
ρ(w)/w yields ρ (w) ≤ ρ(w)/w, and expressing the fine as ρ(w) = w − µ(w) we get

                                               18
µ (w) ≥ µ(w)/w. Then by (17)

                      ∂
          ∆ (w) =       [u(w) − u(µ(w))] = u (w) − µ (w)u (µ(w))
                     ∂w
                                                             ρ(w)
                                                 ≤ u (w) −        u (µ(w)) < 0.
                                                              w
By Lemma 2 (i), therefore, the equilibrium is biased against higher types. Analogous
steps can be repeated for R(w) < 1 and ε(w) ≥ 1, in which case ∆ (w) > 0 and the
equilibrium is biased against lower types by Lemma 2 (ii).

Proof of Lemma 5. We first prove the existence part. Note that v is a continuous
function mapping p ∈ [0, 1] to w ∈ [w, w]. If λ ≤ λ, p∗ (w) is a function by Lemma 1.
As ∆ is continuous in w regardless of the punishment used, w enters the mapping T
defined in the proof of Lemma 1 continuously, so p∗ is continuous. This implies that in
[0, 1] × [,w], the graphs of v and p∗ intersect at least once, so S = ∅.
     We now prove statements (a) and (b) of the result. For (a) note that by Lemma 2 (i)
p∗ strictly increases for strictly decreasing ∆. Therefore, for each v there is exactly one
w ∈ [0, 1] such that v(p∗ (w)) = w. If ∆ is constant, then by Lemma 2 (iii) p∗ is constant.
It will hence become a vertical line in p-w space, which is intersected by any decreasing,
continuous v exactly once. Hence |S| = 1, so that exactly one equilibrium exists, which
must be unbiased. For (b), note that by Lemma 2 (ii) p∗ strictly decreases for strictly
increasing ∆. Therefore, there exists a continuous, decreasing function v for which the
following holds: There exists w1 , w2 ∈ [w, w], w1 = w2 , such that v(p∗ (w1 )) = w1 and
v(p∗ (w2 )) = w2 . For such v, |S| > 1, and a biased equilibrium exists.


References
Alexeev, M. and J. Leitzel (2004): “Racial Profiling,” mimeo, Indiana University.

Arrow, K. (1973): “The Theory of Discrimination,” in: O. Ashenfelter and A. Rees
(eds.): Discrimination in Labor Markets, Princeton University Press, 3–33.

Bar-Ilan, A. and B. Sacerdote (2004): “The Response of Criminals and Noncrim-
inals to Fines,” Journal of Law and Economics, 47, 1–17.

Becker, G. (1968): “Crime and Punishment: An Economic Approach,” Journal of
Political Economy, 76, 169–217.

Bjerk, D. (2006): “Theory and Evidence Regarding the Effects of Segregation on
Crime Rates,” mimeo, Claremont McKenna College.

Bjerk, D. (2007): “Racial Profiling, Statistical Discrimination, and the Effect of a
Colorblind Policy on the Crime Rate,” Journal of Public Economic Theory, 9, 425–
545.

                                            19
Burke, A. (2007): “Neutralizing Cognitive Bias: An Invitation to Prosecutors,” NYU
Journal of Law and Liberty, 2, 512–530.

Bushway, S. (2004): “Labor Market Effects of Permitting Employer Access to Crim-
inal History Records,” Journal of Contemporary Criminal Justice, 20, 276–291.

Coate, S. and G. Loury (1993): “Will Affirmative-Action Policies Eliminate Nega-
tive Stereotypes?” American Economic Review, 83, 1220–1240.

Emons, W. (2007): “Escalating Penalties for Repeat Offenders,” International Review
of Law and Economics, 27, 170–178.

Georgakopoulos, N. (2004): “Self-fulfilling Impressions of Criminality: Uninten-
tional Race Profiling,” International Review of Law and Economics, 24, 169–190.

Gould, E., B. Weinberg, and D. Mustard (2002): “Crime Rates and Local Labor
Market Opportunities in the United States: 1979-1997,” The Review of Economics and
Statistics, 84, 45–61.

Grasmick, H. and G. Bryjak (1980): “The Deterrent Effect of Perceived Severity
of Punishment,” Social Forces, 59, 471–491.

Grogger, J. (1995): “The Effect of Arrests on the Employment and Earnings of
Young Men,” Quarterly Journal of Economics, 110, 51-71.

Grogger, J. (1998): “Market Wages and Youth Crime,” Journal of Labor Economics,
16, 756-791.

Hillsman, S. (1990): “Fines and Day Fines,” Crime and Justice, 12, 49–98.

Holzer, H., S. Raphael, and M. Stoll (2006): “Perceived Criminality, Criminal
Background Checks, and the Racial Hiring Practices of Employers,” Journal of Law
and Economics, 49, 451–480.

Knowles, J., N. Persico, and P. Todd (2001): “Racial Bias in Motor-Vehicle
Searches: Theory and Evidence,” Journal of Political Economy, 109, 203–229.

Krivo, L. and R. Peterson (1996): “Extremely Disadvantaged Neighborhoods and
Urban Crime,” Social Forces, 75, 619–650.

Levitt, S. (1997): “Incentive Compatibility Constraints as an Explanation for the Use
of Prison Sentences Instead of Fines,” International Review of Law and Economics, 17,
179–192.

Lott, J. (1987): “Should the Wealthy Be Able to ‘Buy Justice’ ?” Journal of Political
Economy, 95, 1307–1316.

Lott, J. (1992): “An Attempt at Measuring the Total Monetary Penalty from Drug
Convictions: The Importance of an Individual’s Reputation,” Journal of Legal Studies,


                                         20
11, 159–187.

Morris, N. and M. Tonry (1990): Between Prison and Probation, Oxford University
Press, Oxford.

Myers, S. (1983): “Estimating the Economic Model of Crime: Employment Versus
Punishment Effects,” Quarterly Journal of Economics, 98, 157–166.

Nagin, D. and J. Waldfogel (1998): “The Effect of Conviction in Income Through
the Life Cycle,” International Review of Law and Economics, 18, 25–40.

Persico, N. (2002): “Racial Profiling, Fairness, and Effectiveness of Policing,” Amer-
ican Economic Review, 92, 1472–1497.

Phelps, E. (1972): “The Statistical Theory of Racism and Sexism,” American Eco-
nomic Review, 62, 659–661.

Polinsky A. and S. Shavell (1984): “The Optimal Use of Fines and Imprisonment,”
Journal of Public Economics, 24, 89–99.

Polinsky A. and S. Shavell (2000): “The Economic Theory of Public Enforcement
of Law,” Journal of Economic Literature, 38, 45–76.

Posner, R. (1992): Economic Analysis of Law, 4th Edition, Little, Brown and Com-
pany, Boston.

Raphael, S. and R. Winter-Ebmer (2001): “Identifying the Effect of Unemploy-
ment on Crime,” Journal of Law and Economics, 44, 259–283.

Sah, R. (1991): “Social Osmosis and Patterns of Crime,” Journal of Political Economy,
99, 1272–1295.

Spiegel, U. and J. Templeman (1989): “Economics of Discriminatory Sentencing,”
Journal of Quantitative Criminology, 5, 317–332.

Trumbull, W. (1989): “Estimations of the Economic Model of Crime Using Aggre-
gate and Individual Level Data,” Southern Economic Journal, 56, 423–439.

Verdier, T. and Y. Zenou (2004): “Racial Beliefs, Location, and the Cause of
Crime,” International Economic Review, 45, 731–760.


                                         21

More Related Content

What's hot

Junior paper2
Junior paper2Junior paper2
Junior paper2Angelia16
 
FIVE TESTS FOR A THEORY OF THE CRIME DROP
FIVE TESTS FOR A THEORY OF THE CRIME DROP FIVE TESTS FOR A THEORY OF THE CRIME DROP
FIVE TESTS FOR A THEORY OF THE CRIME DROP Louise Grove
 
Criminal Justice
Criminal JusticeCriminal Justice
Criminal JusticeSami Tolle
 
Harsher Punishments: Solution to crime?
Harsher Punishments: Solution to crime?Harsher Punishments: Solution to crime?
Harsher Punishments: Solution to crime?Tony Ng
 
Crime Control and Due Process in the United States
Crime Control and Due Process in the United StatesCrime Control and Due Process in the United States
Crime Control and Due Process in the United StatesROBELYN GARCIA PhD
 
Ethnicity and crime
Ethnicity and crimeEthnicity and crime
Ethnicity and crimesmccormac7
 
Pollock ethics 8e_ch07
Pollock ethics 8e_ch07Pollock ethics 8e_ch07
Pollock ethics 8e_ch07windleh
 
Packer's models of criminal justice
Packer's models of criminal justicePacker's models of criminal justice
Packer's models of criminal justicesevans-idaho
 
Chapter 2 Criminal Justice
Chapter 2 Criminal JusticeChapter 2 Criminal Justice
Chapter 2 Criminal JusticeKatrina Homer
 
KKykerAFGResearchPaper
KKykerAFGResearchPaperKKykerAFGResearchPaper
KKykerAFGResearchPaperKrista Kyker
 
Chapter 4 - Updated
Chapter 4 - UpdatedChapter 4 - Updated
Chapter 4 - Updatedglickauf
 
Issues in Policing SAR 1
Issues in Policing SAR 1Issues in Policing SAR 1
Issues in Policing SAR 1Marcos Corley
 
Precursors-of-Crime-Report
Precursors-of-Crime-ReportPrecursors-of-Crime-Report
Precursors-of-Crime-ReportFletcher Damon
 
Cja 498 Enthusiastic Study / snaptutorial.com
Cja 498 Enthusiastic Study / snaptutorial.comCja 498 Enthusiastic Study / snaptutorial.com
Cja 498 Enthusiastic Study / snaptutorial.comStephenson26
 

What's hot (18)

Junior paper2
Junior paper2Junior paper2
Junior paper2
 
FIVE TESTS FOR A THEORY OF THE CRIME DROP
FIVE TESTS FOR A THEORY OF THE CRIME DROP FIVE TESTS FOR A THEORY OF THE CRIME DROP
FIVE TESTS FOR A THEORY OF THE CRIME DROP
 
Criminal Justice
Criminal JusticeCriminal Justice
Criminal Justice
 
Issues Final
Issues FinalIssues Final
Issues Final
 
Harsher Punishments: Solution to crime?
Harsher Punishments: Solution to crime?Harsher Punishments: Solution to crime?
Harsher Punishments: Solution to crime?
 
Crime Control and Due Process in the United States
Crime Control and Due Process in the United StatesCrime Control and Due Process in the United States
Crime Control and Due Process in the United States
 
Ethnicity and crime
Ethnicity and crimeEthnicity and crime
Ethnicity and crime
 
Pollock ethics 8e_ch07
Pollock ethics 8e_ch07Pollock ethics 8e_ch07
Pollock ethics 8e_ch07
 
Packer's models of criminal justice
Packer's models of criminal justicePacker's models of criminal justice
Packer's models of criminal justice
 
Chapter 2 Criminal Justice
Chapter 2 Criminal JusticeChapter 2 Criminal Justice
Chapter 2 Criminal Justice
 
SociologyExchange.co.uk Shared Resource
SociologyExchange.co.uk Shared ResourceSociologyExchange.co.uk Shared Resource
SociologyExchange.co.uk Shared Resource
 
KKykerAFGResearchPaper
KKykerAFGResearchPaperKKykerAFGResearchPaper
KKykerAFGResearchPaper
 
Chapter 4 - Updated
Chapter 4 - UpdatedChapter 4 - Updated
Chapter 4 - Updated
 
Issues in Policing SAR 1
Issues in Policing SAR 1Issues in Policing SAR 1
Issues in Policing SAR 1
 
Criminology and crime notes
Criminology and crime notesCriminology and crime notes
Criminology and crime notes
 
Precursors-of-Crime-Report
Precursors-of-Crime-ReportPrecursors-of-Crime-Report
Precursors-of-Crime-Report
 
Cja 498 Enthusiastic Study / snaptutorial.com
Cja 498 Enthusiastic Study / snaptutorial.comCja 498 Enthusiastic Study / snaptutorial.com
Cja 498 Enthusiastic Study / snaptutorial.com
 
Chapter 7
Chapter 7Chapter 7
Chapter 7
 

Viewers also liked

Crij 103 001 w intro to law and justice summer 2012 schedule
Crij 103 001 w  intro to law and justice summer 2012 scheduleCrij 103 001 w  intro to law and justice summer 2012 schedule
Crij 103 001 w intro to law and justice summer 2012 schedulesevans-idaho
 
Cwi crij 103 intro to law and justice summer 2012 syllabus
Cwi crij 103 intro to law and justice summer 2012 syllabusCwi crij 103 intro to law and justice summer 2012 syllabus
Cwi crij 103 intro to law and justice summer 2012 syllabussevans-idaho
 
Walsh power point_chapter 12
Walsh power point_chapter 12Walsh power point_chapter 12
Walsh power point_chapter 12sevans-idaho
 
Implementing ebp in community corrections the principles of effective interv...
Implementing ebp in community corrections  the principles of effective interv...Implementing ebp in community corrections  the principles of effective interv...
Implementing ebp in community corrections the principles of effective interv...sevans-idaho
 
Public opinion and ussc
Public opinion and usscPublic opinion and ussc
Public opinion and usscsevans-idaho
 

Viewers also liked (7)

0131389033 ppt02
0131389033 ppt020131389033 ppt02
0131389033 ppt02
 
Crij 103 001 w intro to law and justice summer 2012 schedule
Crij 103 001 w  intro to law and justice summer 2012 scheduleCrij 103 001 w  intro to law and justice summer 2012 schedule
Crij 103 001 w intro to law and justice summer 2012 schedule
 
Cwi crij 103 intro to law and justice summer 2012 syllabus
Cwi crij 103 intro to law and justice summer 2012 syllabusCwi crij 103 intro to law and justice summer 2012 syllabus
Cwi crij 103 intro to law and justice summer 2012 syllabus
 
Walsh power point_chapter 12
Walsh power point_chapter 12Walsh power point_chapter 12
Walsh power point_chapter 12
 
0131389033 ppt11
0131389033 ppt110131389033 ppt11
0131389033 ppt11
 
Implementing ebp in community corrections the principles of effective interv...
Implementing ebp in community corrections  the principles of effective interv...Implementing ebp in community corrections  the principles of effective interv...
Implementing ebp in community corrections the principles of effective interv...
 
Public opinion and ussc
Public opinion and usscPublic opinion and ussc
Public opinion and ussc
 

Similar to Crime, punishment and prejudice

Senior Thesis- New Thesis version
Senior Thesis- New Thesis versionSenior Thesis- New Thesis version
Senior Thesis- New Thesis versionLance Hagen
 
Running head ISSUES AND TRENDS1ISSUES AND TRENDS8ISUE.docx
Running head ISSUES AND TRENDS1ISSUES AND TRENDS8ISUE.docxRunning head ISSUES AND TRENDS1ISSUES AND TRENDS8ISUE.docx
Running head ISSUES AND TRENDS1ISSUES AND TRENDS8ISUE.docxcharisellington63520
 
Pre Sentence CJ202 Pre-Sentence Inv.docx
Pre Sentence      CJ202 Pre-Sentence Inv.docxPre Sentence      CJ202 Pre-Sentence Inv.docx
Pre Sentence CJ202 Pre-Sentence Inv.docxChantellPantoja184
 
The field of corrections, which will be the topic in this next set.docx
The field of corrections, which will be the topic in this next set.docxThe field of corrections, which will be the topic in this next set.docx
The field of corrections, which will be the topic in this next set.docxtodd771
 
Forum PostWhy does sentencing disparity existAre there programs .docx
Forum PostWhy does sentencing disparity existAre there programs .docxForum PostWhy does sentencing disparity existAre there programs .docx
Forum PostWhy does sentencing disparity existAre there programs .docxVannaJoy20
 
Running Head CORUPTION IN CORRECTIONAL SYSTEM CORUPTIO.docx
Running Head CORUPTION IN CORRECTIONAL SYSTEM          CORUPTIO.docxRunning Head CORUPTION IN CORRECTIONAL SYSTEM          CORUPTIO.docx
Running Head CORUPTION IN CORRECTIONAL SYSTEM CORUPTIO.docxjoellemurphey
 
Invitation and program_-_scholars_workshop
Invitation and program_-_scholars_workshopInvitation and program_-_scholars_workshop
Invitation and program_-_scholars_workshopAkshayKhandale3
 
Respond as to why you agree or disagree with the discussion respon
Respond as to why you agree or disagree with the discussion responRespond as to why you agree or disagree with the discussion respon
Respond as to why you agree or disagree with the discussion responmickietanger
 
FINDING DIRECTIONEXPANDING CRIMINAL JUSTICE OPTIONS BY CONSIDER
FINDING DIRECTIONEXPANDING CRIMINAL JUSTICE OPTIONS BY CONSIDERFINDING DIRECTIONEXPANDING CRIMINAL JUSTICE OPTIONS BY CONSIDER
FINDING DIRECTIONEXPANDING CRIMINAL JUSTICE OPTIONS BY CONSIDERShainaBoling829
 
Deterrence%20 briefing%20
Deterrence%20 briefing%20Deterrence%20 briefing%20
Deterrence%20 briefing%20sevans-idaho
 
CJ302 Final Exam1. What is your response to the argument t.docx
CJ302 Final Exam1. What is your response to the argument t.docxCJ302 Final Exam1. What is your response to the argument t.docx
CJ302 Final Exam1. What is your response to the argument t.docxmonicafrancis71118
 
Running head DEATH SENTENCE .docx
Running head DEATH SENTENCE                                      .docxRunning head DEATH SENTENCE                                      .docx
Running head DEATH SENTENCE .docxsusanschei
 
Hall Elizabeth Analysis Essay Unit 3
Hall Elizabeth Analysis Essay Unit 3Hall Elizabeth Analysis Essay Unit 3
Hall Elizabeth Analysis Essay Unit 3Elizabeth Hall
 

Similar to Crime, punishment and prejudice (16)

Senior Thesis- New Thesis version
Senior Thesis- New Thesis versionSenior Thesis- New Thesis version
Senior Thesis- New Thesis version
 
Running head ISSUES AND TRENDS1ISSUES AND TRENDS8ISUE.docx
Running head ISSUES AND TRENDS1ISSUES AND TRENDS8ISUE.docxRunning head ISSUES AND TRENDS1ISSUES AND TRENDS8ISUE.docx
Running head ISSUES AND TRENDS1ISSUES AND TRENDS8ISUE.docx
 
Pre Sentence CJ202 Pre-Sentence Inv.docx
Pre Sentence      CJ202 Pre-Sentence Inv.docxPre Sentence      CJ202 Pre-Sentence Inv.docx
Pre Sentence CJ202 Pre-Sentence Inv.docx
 
The field of corrections, which will be the topic in this next set.docx
The field of corrections, which will be the topic in this next set.docxThe field of corrections, which will be the topic in this next set.docx
The field of corrections, which will be the topic in this next set.docx
 
Criminal Policy Taskforce
Criminal Policy TaskforceCriminal Policy Taskforce
Criminal Policy Taskforce
 
Forum PostWhy does sentencing disparity existAre there programs .docx
Forum PostWhy does sentencing disparity existAre there programs .docxForum PostWhy does sentencing disparity existAre there programs .docx
Forum PostWhy does sentencing disparity existAre there programs .docx
 
Running Head CORUPTION IN CORRECTIONAL SYSTEM CORUPTIO.docx
Running Head CORUPTION IN CORRECTIONAL SYSTEM          CORUPTIO.docxRunning Head CORUPTION IN CORRECTIONAL SYSTEM          CORUPTIO.docx
Running Head CORUPTION IN CORRECTIONAL SYSTEM CORUPTIO.docx
 
3 argue race
3 argue race3 argue race
3 argue race
 
Invitation and program_-_scholars_workshop
Invitation and program_-_scholars_workshopInvitation and program_-_scholars_workshop
Invitation and program_-_scholars_workshop
 
Respond as to why you agree or disagree with the discussion respon
Respond as to why you agree or disagree with the discussion responRespond as to why you agree or disagree with the discussion respon
Respond as to why you agree or disagree with the discussion respon
 
FINDING DIRECTIONEXPANDING CRIMINAL JUSTICE OPTIONS BY CONSIDER
FINDING DIRECTIONEXPANDING CRIMINAL JUSTICE OPTIONS BY CONSIDERFINDING DIRECTIONEXPANDING CRIMINAL JUSTICE OPTIONS BY CONSIDER
FINDING DIRECTIONEXPANDING CRIMINAL JUSTICE OPTIONS BY CONSIDER
 
Deterrence%20 briefing%20
Deterrence%20 briefing%20Deterrence%20 briefing%20
Deterrence%20 briefing%20
 
Prison Over Crowding Research Paper
Prison Over Crowding Research PaperPrison Over Crowding Research Paper
Prison Over Crowding Research Paper
 
CJ302 Final Exam1. What is your response to the argument t.docx
CJ302 Final Exam1. What is your response to the argument t.docxCJ302 Final Exam1. What is your response to the argument t.docx
CJ302 Final Exam1. What is your response to the argument t.docx
 
Running head DEATH SENTENCE .docx
Running head DEATH SENTENCE                                      .docxRunning head DEATH SENTENCE                                      .docx
Running head DEATH SENTENCE .docx
 
Hall Elizabeth Analysis Essay Unit 3
Hall Elizabeth Analysis Essay Unit 3Hall Elizabeth Analysis Essay Unit 3
Hall Elizabeth Analysis Essay Unit 3
 

More from sevans-idaho

Walsh power point_chapter 1
Walsh power point_chapter 1Walsh power point_chapter 1
Walsh power point_chapter 1sevans-idaho
 
Future forensic science
Future forensic scienceFuture forensic science
Future forensic sciencesevans-idaho
 
Timeline of forensic science
Timeline of forensic scienceTimeline of forensic science
Timeline of forensic sciencesevans-idaho
 
Forensic science%20from%20fingerprints%20to%20 dna
Forensic science%20from%20fingerprints%20to%20 dnaForensic science%20from%20fingerprints%20to%20 dna
Forensic science%20from%20fingerprints%20to%20 dnasevans-idaho
 
The origins of islamic law
The origins of islamic lawThe origins of islamic law
The origins of islamic lawsevans-idaho
 
Commonvs civillaw chart
Commonvs civillaw chartCommonvs civillaw chart
Commonvs civillaw chartsevans-idaho
 
Walsh power point_chapter 14
Walsh power point_chapter 14Walsh power point_chapter 14
Walsh power point_chapter 14sevans-idaho
 
Topic paper week 16 cja 101 intro to criminal justice
Topic paper week 16 cja 101 intro to criminal justiceTopic paper week 16 cja 101 intro to criminal justice
Topic paper week 16 cja 101 intro to criminal justicesevans-idaho
 
Topic paper week 14 cja 104 intro to corrections
Topic paper week 14 cja 104 intro to correctionsTopic paper week 14 cja 104 intro to corrections
Topic paper week 14 cja 104 intro to correctionssevans-idaho
 
Marshall trilogy cases
Marshall trilogy casesMarshall trilogy cases
Marshall trilogy casessevans-idaho
 
Walsh power point_chapter 13
Walsh power point_chapter 13Walsh power point_chapter 13
Walsh power point_chapter 13sevans-idaho
 
Restorative justice and response
Restorative justice and responseRestorative justice and response
Restorative justice and responsesevans-idaho
 

More from sevans-idaho (20)

Walsh power point_chapter 1
Walsh power point_chapter 1Walsh power point_chapter 1
Walsh power point_chapter 1
 
0495808652 282845
0495808652 2828450495808652 282845
0495808652 282845
 
Ch13 overview
Ch13 overviewCh13 overview
Ch13 overview
 
Future forensic science
Future forensic scienceFuture forensic science
Future forensic science
 
Timeline of forensic science
Timeline of forensic scienceTimeline of forensic science
Timeline of forensic science
 
Forensic science%20from%20fingerprints%20to%20 dna
Forensic science%20from%20fingerprints%20to%20 dnaForensic science%20from%20fingerprints%20to%20 dna
Forensic science%20from%20fingerprints%20to%20 dna
 
Dna testing
Dna testingDna testing
Dna testing
 
The origins of islamic law
The origins of islamic lawThe origins of islamic law
The origins of islamic law
 
Commonvs civillaw chart
Commonvs civillaw chartCommonvs civillaw chart
Commonvs civillaw chart
 
Civil law
Civil lawCivil law
Civil law
 
Walsh power point_chapter 14
Walsh power point_chapter 14Walsh power point_chapter 14
Walsh power point_chapter 14
 
Topic paper week 16 cja 101 intro to criminal justice
Topic paper week 16 cja 101 intro to criminal justiceTopic paper week 16 cja 101 intro to criminal justice
Topic paper week 16 cja 101 intro to criminal justice
 
Fagin 13 images
Fagin 13 imagesFagin 13 images
Fagin 13 images
 
0131389033 ppt13
0131389033 ppt130131389033 ppt13
0131389033 ppt13
 
Topic paper week 14 cja 104 intro to corrections
Topic paper week 14 cja 104 intro to correctionsTopic paper week 14 cja 104 intro to corrections
Topic paper week 14 cja 104 intro to corrections
 
0495808652 282844
0495808652 2828440495808652 282844
0495808652 282844
 
Ch12 overview
Ch12 overviewCh12 overview
Ch12 overview
 
Marshall trilogy cases
Marshall trilogy casesMarshall trilogy cases
Marshall trilogy cases
 
Walsh power point_chapter 13
Walsh power point_chapter 13Walsh power point_chapter 13
Walsh power point_chapter 13
 
Restorative justice and response
Restorative justice and responseRestorative justice and response
Restorative justice and response
 

Recently uploaded

slides CapTechTalks Webinar May 2024 Alexander Perry.pptx
slides CapTechTalks Webinar May 2024 Alexander Perry.pptxslides CapTechTalks Webinar May 2024 Alexander Perry.pptx
slides CapTechTalks Webinar May 2024 Alexander Perry.pptxCapitolTechU
 
Basic phrases for greeting and assisting costumers
Basic phrases for greeting and assisting costumersBasic phrases for greeting and assisting costumers
Basic phrases for greeting and assisting costumersPedroFerreira53928
 
How to Break the cycle of negative Thoughts
How to Break the cycle of negative ThoughtsHow to Break the cycle of negative Thoughts
How to Break the cycle of negative ThoughtsCol Mukteshwar Prasad
 
Forest and Wildlife Resources Class 10 Free Study Material PDF
Forest and Wildlife Resources Class 10 Free Study Material PDFForest and Wildlife Resources Class 10 Free Study Material PDF
Forest and Wildlife Resources Class 10 Free Study Material PDFVivekanand Anglo Vedic Academy
 
Sectors of the Indian Economy - Class 10 Study Notes pdf
Sectors of the Indian Economy - Class 10 Study Notes pdfSectors of the Indian Economy - Class 10 Study Notes pdf
Sectors of the Indian Economy - Class 10 Study Notes pdfVivekanand Anglo Vedic Academy
 
Matatag-Curriculum and the 21st Century Skills Presentation.pptx
Matatag-Curriculum and the 21st Century Skills Presentation.pptxMatatag-Curriculum and the 21st Century Skills Presentation.pptx
Matatag-Curriculum and the 21st Century Skills Presentation.pptxJenilouCasareno
 
Students, digital devices and success - Andreas Schleicher - 27 May 2024..pptx
Students, digital devices and success - Andreas Schleicher - 27 May 2024..pptxStudents, digital devices and success - Andreas Schleicher - 27 May 2024..pptx
Students, digital devices and success - Andreas Schleicher - 27 May 2024..pptxEduSkills OECD
 
Basic_QTL_Marker-assisted_Selection_Sourabh.ppt
Basic_QTL_Marker-assisted_Selection_Sourabh.pptBasic_QTL_Marker-assisted_Selection_Sourabh.ppt
Basic_QTL_Marker-assisted_Selection_Sourabh.pptSourabh Kumar
 
aaaaaaaaaaaaaaaaaaaaaaaaaaaaaaaaaaaaaaaaa
aaaaaaaaaaaaaaaaaaaaaaaaaaaaaaaaaaaaaaaaaaaaaaaaaaaaaaaaaaaaaaaaaaaaaaaaaaaaaaaaaa
aaaaaaaaaaaaaaaaaaaaaaaaaaaaaaaaaaaaaaaaasiemaillard
 
PART A. Introduction to Costumer Service
PART A. Introduction to Costumer ServicePART A. Introduction to Costumer Service
PART A. Introduction to Costumer ServicePedroFerreira53928
 
Application of Matrices in real life. Presentation on application of matrices
Application of Matrices in real life. Presentation on application of matricesApplication of Matrices in real life. Presentation on application of matrices
Application of Matrices in real life. Presentation on application of matricesRased Khan
 
Advances in production technology of Grapes.pdf
Advances in production technology of Grapes.pdfAdvances in production technology of Grapes.pdf
Advances in production technology of Grapes.pdfDr. M. Kumaresan Hort.
 
Adversarial Attention Modeling for Multi-dimensional Emotion Regression.pdf
Adversarial Attention Modeling for Multi-dimensional Emotion Regression.pdfAdversarial Attention Modeling for Multi-dimensional Emotion Regression.pdf
Adversarial Attention Modeling for Multi-dimensional Emotion Regression.pdfPo-Chuan Chen
 
Phrasal Verbs.XXXXXXXXXXXXXXXXXXXXXXXXXX
Phrasal Verbs.XXXXXXXXXXXXXXXXXXXXXXXXXXPhrasal Verbs.XXXXXXXXXXXXXXXXXXXXXXXXXX
Phrasal Verbs.XXXXXXXXXXXXXXXXXXXXXXXXXXMIRIAMSALINAS13
 
Synthetic Fiber Construction in lab .pptx
Synthetic Fiber Construction in lab .pptxSynthetic Fiber Construction in lab .pptx
Synthetic Fiber Construction in lab .pptxShajedul Islam Pavel
 
How to Create Map Views in the Odoo 17 ERP
How to Create Map Views in the Odoo 17 ERPHow to Create Map Views in the Odoo 17 ERP
How to Create Map Views in the Odoo 17 ERPCeline George
 
MARUTI SUZUKI- A Successful Joint Venture in India.pptx
MARUTI SUZUKI- A Successful Joint Venture in India.pptxMARUTI SUZUKI- A Successful Joint Venture in India.pptx
MARUTI SUZUKI- A Successful Joint Venture in India.pptxbennyroshan06
 
Industrial Training Report- AKTU Industrial Training Report
Industrial Training Report- AKTU Industrial Training ReportIndustrial Training Report- AKTU Industrial Training Report
Industrial Training Report- AKTU Industrial Training ReportAvinash Rai
 

Recently uploaded (20)

Introduction to Quality Improvement Essentials
Introduction to Quality Improvement EssentialsIntroduction to Quality Improvement Essentials
Introduction to Quality Improvement Essentials
 
slides CapTechTalks Webinar May 2024 Alexander Perry.pptx
slides CapTechTalks Webinar May 2024 Alexander Perry.pptxslides CapTechTalks Webinar May 2024 Alexander Perry.pptx
slides CapTechTalks Webinar May 2024 Alexander Perry.pptx
 
Basic phrases for greeting and assisting costumers
Basic phrases for greeting and assisting costumersBasic phrases for greeting and assisting costumers
Basic phrases for greeting and assisting costumers
 
How to Break the cycle of negative Thoughts
How to Break the cycle of negative ThoughtsHow to Break the cycle of negative Thoughts
How to Break the cycle of negative Thoughts
 
Forest and Wildlife Resources Class 10 Free Study Material PDF
Forest and Wildlife Resources Class 10 Free Study Material PDFForest and Wildlife Resources Class 10 Free Study Material PDF
Forest and Wildlife Resources Class 10 Free Study Material PDF
 
Sectors of the Indian Economy - Class 10 Study Notes pdf
Sectors of the Indian Economy - Class 10 Study Notes pdfSectors of the Indian Economy - Class 10 Study Notes pdf
Sectors of the Indian Economy - Class 10 Study Notes pdf
 
Matatag-Curriculum and the 21st Century Skills Presentation.pptx
Matatag-Curriculum and the 21st Century Skills Presentation.pptxMatatag-Curriculum and the 21st Century Skills Presentation.pptx
Matatag-Curriculum and the 21st Century Skills Presentation.pptx
 
Students, digital devices and success - Andreas Schleicher - 27 May 2024..pptx
Students, digital devices and success - Andreas Schleicher - 27 May 2024..pptxStudents, digital devices and success - Andreas Schleicher - 27 May 2024..pptx
Students, digital devices and success - Andreas Schleicher - 27 May 2024..pptx
 
Basic_QTL_Marker-assisted_Selection_Sourabh.ppt
Basic_QTL_Marker-assisted_Selection_Sourabh.pptBasic_QTL_Marker-assisted_Selection_Sourabh.ppt
Basic_QTL_Marker-assisted_Selection_Sourabh.ppt
 
Operations Management - Book1.p - Dr. Abdulfatah A. Salem
Operations Management - Book1.p  - Dr. Abdulfatah A. SalemOperations Management - Book1.p  - Dr. Abdulfatah A. Salem
Operations Management - Book1.p - Dr. Abdulfatah A. Salem
 
aaaaaaaaaaaaaaaaaaaaaaaaaaaaaaaaaaaaaaaaa
aaaaaaaaaaaaaaaaaaaaaaaaaaaaaaaaaaaaaaaaaaaaaaaaaaaaaaaaaaaaaaaaaaaaaaaaaaaaaaaaaa
aaaaaaaaaaaaaaaaaaaaaaaaaaaaaaaaaaaaaaaaa
 
PART A. Introduction to Costumer Service
PART A. Introduction to Costumer ServicePART A. Introduction to Costumer Service
PART A. Introduction to Costumer Service
 
Application of Matrices in real life. Presentation on application of matrices
Application of Matrices in real life. Presentation on application of matricesApplication of Matrices in real life. Presentation on application of matrices
Application of Matrices in real life. Presentation on application of matrices
 
Advances in production technology of Grapes.pdf
Advances in production technology of Grapes.pdfAdvances in production technology of Grapes.pdf
Advances in production technology of Grapes.pdf
 
Adversarial Attention Modeling for Multi-dimensional Emotion Regression.pdf
Adversarial Attention Modeling for Multi-dimensional Emotion Regression.pdfAdversarial Attention Modeling for Multi-dimensional Emotion Regression.pdf
Adversarial Attention Modeling for Multi-dimensional Emotion Regression.pdf
 
Phrasal Verbs.XXXXXXXXXXXXXXXXXXXXXXXXXX
Phrasal Verbs.XXXXXXXXXXXXXXXXXXXXXXXXXXPhrasal Verbs.XXXXXXXXXXXXXXXXXXXXXXXXXX
Phrasal Verbs.XXXXXXXXXXXXXXXXXXXXXXXXXX
 
Synthetic Fiber Construction in lab .pptx
Synthetic Fiber Construction in lab .pptxSynthetic Fiber Construction in lab .pptx
Synthetic Fiber Construction in lab .pptx
 
How to Create Map Views in the Odoo 17 ERP
How to Create Map Views in the Odoo 17 ERPHow to Create Map Views in the Odoo 17 ERP
How to Create Map Views in the Odoo 17 ERP
 
MARUTI SUZUKI- A Successful Joint Venture in India.pptx
MARUTI SUZUKI- A Successful Joint Venture in India.pptxMARUTI SUZUKI- A Successful Joint Venture in India.pptx
MARUTI SUZUKI- A Successful Joint Venture in India.pptx
 
Industrial Training Report- AKTU Industrial Training Report
Industrial Training Report- AKTU Industrial Training ReportIndustrial Training Report- AKTU Industrial Training Report
Industrial Training Report- AKTU Industrial Training Report
 

Crime, punishment and prejudice

  • 1. Crime, Punishment, and Prejudice∗ Philip A. Curry† Tilman Klumpp‡ Simon Fraser University Emory University June 2008 Abstract We examine the link between the penalties used to punish convicted criminals, and judicial prejudice against defendants. In our model, agents choose to commit crimes if their privately observed utility from doing so is high enough. A crime generates noisy evidence, and defendants are convicted when the realized amount of evidence is sufficiently strong to establish the probability of guilt beyond a fixed threshold. We show that if convicted offenders are incarcerated, poorer individuals face a strong prior prejudice in trials and are therefore convicted with less evidence than members of the other group. At the same time, they commit crimes more frequently. Penalties such as monetary fines can eliminate this bias, but may also reverse it. We fully characterize the penalty schedule that guarantees an unbiased equilbrium. We extend the model such that agents also differ in characteristics such as race or gender. We show biased outcomes (targeted at subgroups of the population) may still exist, even if all members of the population are ex-ante alike in their economic characteristics. Keywords: Crime, punishment, statistical discrimination, stereotypes, prejudice. JEL code: D82, J71, K14, K42. ∗ We thank the editor Kai Konrad and two anonymous referees for their helpful suggestions. We also thank David Bjerk, Amie Broder, Steve Easton, Hugo Mialon, Scott Moss, Paul Rubin, David Scoones, Xuejuan Su, Eric Talley, as well as participants at the 2006 Meetings of the Canadian Law and Economics Asociation, and the 2007 Meetings of the American Law and Economics Association, for fruitful discussions. † Department of Economics, Simon Fraser University, 8888 University Dr., Burnaby, BC, V6A 1S6, Canada. E-mail: pcurry@sfu.ca. ‡ Corresponding author. Department of Economics, Emory University, Rich Building 316, 1602 Fishburne Dr., Atlanta, GA 30322, USA. E-mail: tklumpp@emory.edu.
  • 2. “It is in justice that the ordering of society is centered.” — Aristotle 1 Introduction Criminal conviction rates in the United States differ drastically across racial groups. The jail incarceration rates for African-Americans, for example, is 800 people per 100,000, while the rate for white Americans is 166 per 100,000. An estimated 12% of U.S. black males in their late twenties were incarcerated in 2005, as opposed to 1.7% of white males.1 That these differences exist is undisputed. It is much less clear, however, why they exist. One possible explanation is that blacks commit more crimes than whites. For example, criminal participation tends to be correlated with economic characteristics such as income, education, or area of residence, and these characteristics differ across racial groups. Another possibility is that the criminal justice system is somehow “biased” in that blacks are more easily convicted than whites are. This paper pursues a twofold objective. First, we demonstrate that differences in crime rates as well as judicial prejudice against certain individuals can arise simultane- ously in a single model. Second, we ask whether our model can inform policies aimed at reducing racial differences in the criminal justice system. The suggestions we derive from our framework are novel and perhaps unexpected: To understand, and perhaps reduce, the aforementioned differences, one should consider the way by which certain crimes are punished. In our model, a Bayesian jury must decide whether a given amount of evidence is sufficient to convict a defendant. Suppose that the defendant is sent to prison if convicted. Because the deterrence effect of incarceration increases in the defendant’s wealth, richer individuals are ex-ante less likely to commit crimes than poorer ones. Economic variables such as the defendant’s income or social status may hence enter the jury’s prior belief (i.e. their prejudice) about the guilt of the defendant.2 Our framework thus exposes a new mechanism by which economic differences across indi- viduals can cause differences not only in criminal behavior, but also in how defendants are treated in the courts. We then consider the possibility that income differences not only generate prejudice, but are also the result of such prejudice. For example, persons believed to be more prone to criminal behavior may have a harder time finding well- paying employment opportunities. Such persons are therefore poorer and less likely to be deterred by the threat of losing their income, justifying the initial prejudice. If there are multiple equilibria, in each of which an individual’s income is consistent with the 1 Source: Bureau of Justice Statistics Prison and Jail Inmates at Midyear 2005. 2 We assume that convictions are issued if only if the posterior probability of guilt is beyond a certain threshold of reasonable doubt, which is the same for all individuals. However, since there are differences in prior beliefs, the amount of evidence required to convict a defendant must differ across defendants. 1
  • 3. judicial bias against the individual, a social norm may develop that associates different subgroups of the population with different such equilibria. In such an overall “stereo- typing equilibrium,” race or ethnicity serves as a coordination device through which individual roles and commonly expected behaviors are developed.3 Corrective policies aimed solely at the labor market, such as affirmative action, may then have a limited effect because of discrimination in the judicial system. We show that other forms of punishment can, in principle, eliminate such outcomes. In particular, the adoption of a schedule of monetary fines (which may depend on the defendant’s wealth) as a means of punishment may reduce unfavorable prejudice. For certain felonies such monetary penalties may indeed be considered an alternative to incarceration.4 We remark that, at this point, we do not undertake any formal welfare analysis of different approaches to punishing criminals. We do not formally consider the costs to either crime or corrections. There are many reasons, besides the one examined in this paper, why one form of punishment may be preferable over another. Our concern here is with which types of penalties can lead to judicial biases, and which ones do not. Our paper is related to several strands of theoretical literature (empirical papers, as they relate to our assumptions and results, will be discussed later in Section 3 and Section 4.) Our work contributes to the research on the optimal use of fines and impris- onment (e.g. Becker, 1968; Posner, 1992; Polinsky and Shavell, 1984; Morris and Tonry, 1990; Levitt, 1997; and many others). No attempt of a thorough review of this exten- sive literature will be made here. The idea that the deterrence effect of a jail sentence may depend on the defendant’s income appears in Lott (1987), and Spiegel and Tem- pleman (1989); however, neither considers how this affects jury beliefs in equilibrium, or how an unbiased penalty schedule can be constructed. Our stereotyping argument is related to the literature on statistical discrimination in labor markets, which includes seminal contributions by Phelps (1972) and Arrow (1973), and important applications by Coate and Loury (1993) and others. An application to crime is Verdier and Zenou (2004), who examine a model of statistical discrimination, location choice, and criminal activity; however, their paper neither examines Bayesian updating in the courts nor the impact of various forms of penalties on beliefs. Finally, several papers consider racial profiling by the police (e.g. Knowles et al., 2001; Persico, 2002; Alexeev and Leitzel, 2004; Bjerk, 2007). These papers assume ex-ante differences in criminal behavior across racial subgroups and are not concerned with how such difference might come to be.5 3 In economic terms, racial labels are “sunspots”: economically meaningless events, which derive significance only because they coordinate individual actions and social expectations. 4 For example, West Germany in 1969 eliminated prison sentences of under six months from its penal code and, except for rare circumstances, replaced them with day fines. Several other European countries, and some Latin American countries, have adopted similar systems, and U.S. courts have been experimenting with replacing jail time by montary sanctions since the 1980s (Hillsman, 1990). 5 There is also a literature on false beliefs by prosecutors and judges (e.g. Georgakopoulos, 2004; Burke, 2007). In our paper, on the other hand, all beliefs will be correct in equilibrium. 2
  • 4. We proceed as follows. Section 2 describes our theoretical model, assuming that agents’ economic characteristics are exogenously given and observable. In Section 3 we derive a number of results for this case, as well as various comparative results with respect to different forms of penalties. In Section 4 we look at the possibility of statistical discrimination when there is a feedback from prejudice to income. In Section 5, we discuss some policy implications of our model. In particular, we contrast our findings with possible interventions in the labor market or in the courts directly. Most proofs are in the Appendix. 2 A Model of Crime, Punishment, and Prejudice In our model, an individual must decide whether to commit a crime, and a judge or jury must decide whether to convict and punish a defendant accused of committing a crime. The individual is characterized by an exogenously given and publicly observable variable w ∈ [w, ∞) (where w > 0), which we refer to as the individual’s type. Ceteris paribus, individuals of a higher type receive a higher payoff, so that one may regard w as an agent’s wealth, income, or social status. The events unfold as follows. 1. The individual comes across an opportunity to commit a crime. The benefit to committing this crime is η ∈ [0, ∞), which is privately observable and drawn according to distribution Q. Q is continuous on [0, ∞) and independent of w. The individual’s decision is denoted d ∈ {0, 1}. If the crime is committed (d = 1) the individual receives the benefit η. 2. If the individual has committed a crime, an investigation is initiated with cer- tainty. If the individual has not committed a crime, there is a probability λ ∈ (0, 1) that an investigation is initiated “by accident.” The assumption of an accidental investigation introduces the possibility that a person who faces trial is innocent.6 3. If under investigation, a random amount of evidence t ∈ [0, 1] against the individ- ual is discovered. If the individual has committed the crime, t is a random draw from distribution F . In case of accidental investigation, t is drawn from G. We assume that F and G have support [0, 1], are continuous with densities f and g, and that f (t)/g(t) increases strictly in t. A higher value of t hence means stronger 6 If this possibility did not exist, every defendant would be guilty and criminal trials would be meaningless. There are several possibilities why innocent persons may be investigated for a crime. First, a person may be charged with a crime that has in fact happened, but which was committed by somebody else. Second, an individual may be under investigation for events which may or may not be the result of a crime. Consider, for example, an area such as tort law: Damaging events may take place which may or may not be the result of negligence, and at trial it must be determined whether the individual should be held responsible. Thus, even if the individual did in fact behave responsibly, it is possible that he is tried and held responsible for damages that were caused by chance. 3
  • 5. evidence against the individual. We further make the technical assumptions that 0 < f (0) < ∞ and 0 < g(0) < ∞. 4. After the evidence is discovered, the individual becomes a defendant and has to stand trial. A jury observes w as well as t and forms belief θ(w, t) = P [d = 1|w, t], which is the probability that the individual is guilty conditional on observables. The individual is convicted if θ(w, t) ≥ α, where α ∈ (0, 1) represents the standard of proof.7 If the individual is not investigated, or if he is investigated and subsequently acquit- ted, he receives utility u(w). We assume that u is twice differentiable with u (w) > 0 and u (w) ≤ 0. 2.1 Penalties If the jury convicts the defendant (rightfully or wrongfully), the defendant is sentenced to a punishment which reduces the payoff to the individual. We model punishments by means of a penalty schedule, which is a mapping ρ : [w, ∞) → R such that ρ(w) ∈ [0, w]. The interpretation is that, when sentenced, the individual’s type is decreased by the amount ρ(w). By using the concept of a penalty schedule, we can examine many important cases of penalties in our model: Example 1. To characterize a (simple) fine, let δ be the constant amount an individual must pay if convicted. Then the fine corresponds to the penalty schedule ρ(w) = δ. For all individuals to be able to pay this fine, we assume that δ ≤ w. Example 2. To characterize a prison sentence, let u0 be the fixed utility an individual receives in prison; and set w0 = u−1 (u0 ). Then a prison sentence corresponds to the penalty schedule ρ(w) = w − w0 . We assume that u0 > −∞. Example 3. More generally, ρ can be a means-adjusted penalty. For example, a proportional fine is given by the penalty schedule ρ(w) = γw, where γ ∈ (0, 1) is the fraction of income taken away from convicted individuals. 2.2 The jury At trial, the jury computes a belief of the defendant’s guilt through Bayesian updating. Specifically, let p(w) denote the jury’s prior belief that an individual of income w commits a crime. We will call p(w) the prejudice held against individuals of income w. 7 The interpretation is that courts must determine whether or not the evidence establishes the defendant’s guilt beyond a “reasonable doubt.” In our model, α quantifies what reasonable means. 4
  • 6. The posterior Bayesian likelihood that the investigated individual is guilty, conditioning on evidence t, is then p(w)f (t) θ(w, t) ≡ P [d = 1|w, t] = ∈ [0, 1]. (1) p(w)f (t) + λ(1 − p(w))g(t) Given that f (t)/g(t) increases, θ(w, t) increases in t and in p(w). Now recall that we assume that the jury convicts the defendant if and only if the evidence results in a posterior likelihood of the defendant’s guilt of at least α. Given α, let t(w) be such that α = θ(w, t(w)); t(w) is then the conviction threshold that is applied to individuals of income w. Note that α is the same for all defendants. However, because the jury’s prior belief depends on the defendant’s type w, the actual amount of evidence t(w) required to prove guilt beyond probability α depends on w. 2.3 The individual’s decision Let m1 (w) denote the probability that an individual of income w is convicted condi- tional on having committed the crime, and let m0 (w) denote the probability that the same individual is (wrongfully) convicted conditional on not having committed the act. We can express the probability of conviction following a crime from the individual’s perspective as m1 (w) = P [θ(w, t) ≥ α|d = 1] = P [t ≥ t(w)|d = 1] = 1 − F (t(w)), and the probability of wrongful conviction as m0 (w) = λP [θ(w, t) ≥ α|d = 0] = λP [t ≥ t(w)|d = 0] = λ(1 − G(t(w))). The crime is then committed if and only if η > q(w) ≡ [m1 (w) − m0 (w)] ∆(w), where ∆(w) = u(w) − u(w − ρ(w)) denotes the utility loss the individual experiences when sentenced under the penalty schedule ρ. The variable q(w) is the expected cost of committing the crime, so that the defendant decides to commit the act when the benefit of doing so, η, exceeds the expected cost, q(w). We call q(w) the decision threshold for the individual. 5
  • 7. 2.4 Rational expectations equilibrium An equilibrium of this model consists of three elements: A prior belief, or prejudice, for the jury (p(w)), a decision threshold for the individual (q(w)), and a conviction threshold for the jury (t(w)). Note that these elements are functions of the individual’s type w. We say that the tuple (p∗ , q ∗ , t∗ ) constitutes a rational expectations equilibrium if it satisfies the following conditions: 1. The prejudice toward defendants with income w is consistent with the probability that these agents actually commit crimes: p∗ (w) = 1 − Q(q ∗ (w)) ∀w. (2) 2. The decisions of agents with income w to commit crimes are optimal, given the conviction thresholds t∗ (w) applied to these individuals: q ∗ (w) = [1 − F (t∗ (w)) − λ(1 − G(t∗ (w)))] ∆(w) ∀w. (3) 3. The jury convicts a defendant if and only if the evidence establishes the defen- dant’s guilt beyond probability α, where this probability is computed by Bayes’ Rule using the prejudice p∗ (w) as the prior: θ(w, t∗ (w)) = α ∀w. (4) 3 Equilibrium Analysis The following result establishes existence of equilibrium, as well as a condition for uniqueness. Lemma 1. A rational expectations equilibrium exists. Furthermore, if λ ≤ λ ≡ f (0)/g(0), the equilibrium is unique. We now examine how the equilibrium values p∗ (w), q ∗ (w), and t∗ (w) depend on the individual’s type w. Throughout, we assume that the probability of accidental investigation is small enough (0 < λ ≤ λ ) so that a unique equilibrium is guaranteed by Lemma 1.8 We say that the equilibrium is biased against lower types if w > w implies p∗ (w) < p∗ (w ), t∗ (w) > t∗ (w ), q ∗ (w) > q ∗ (w ). 8 If the probability of an accidental investigation were large enough, then there could exist an equi- librium in which a large number of people believe they will be convicted even if they don’t commit the crime, so the crime rate is high and jurors require little evidence to convict, supporting the original beliefs. This equilibrium would coexist with another one in which people did not believe there is much chance that they would be convicted if they do not commit the crime, and so jurors require a lot of evidence, again justifying the original beliefs. 6
  • 8. That is, the jury favors richer defendants and applies a lower conviction threshold to poorer ones. Conversely, richer defendants are less likely to commit a crime. An equilibrium is biased against higher types if the reverse inequalities hold. Finally, if p∗ , q ∗ and t∗ are constant, the equilibrium is unbiased. 3.1 Penalties and equilibrium bias An individual’s type w enters the equilibrium in condition (3), through the utility loss ∆(w). If ∆ increases—for example, if prison is used as punishment—richer defendants are penalized more severely than poorer ones if convicted. One should then expect that these individuals are more deterred by the threat of punishment and hence commit crimes less frequently. The opposite should be expected if ∆ was decreasing in w. While this argument is quite intuitive, it is important to recognize that we are looking at an equilibrium relationship between several variables. In particular, the utility loss effect is fully taken into account at trial: Jurors who realize that some individuals are more severely affected by a particular punishment than others will think it less likely that these individuals commit a crime. In equilibrium, therefore, jurors will entertain a prejudice that favors those who experience large losses from punishment. These types are less likely to be convicted should they commit a crime, which acts against the larger utility loss if convicted. This effect creates a countervailing incentive to commit more crimes. A priori, it is not obvious which of the two effects is stronger. Our next result shows that the net effect is in the same direction as the utility loss effect: Lemma 2. The equilibrium is (a) biased against higher types if ∆(w) strictly decreases in w, (b) biased against lower types if ∆(w) strictly increases in w, and is (c) unbiased if ∆(w) is constant. In order to determine whether a bias can arise for a certain penalty schedule, we need to examine the monotonicity properties of ∆ implied by the penalty. To achieve an unbiased equilibrium, the penalty schedule ρ must be such that ∆ is constant: ∆(w) = ∆ for all w, where ∆ is the utility loss inflicted on every convicted defendant regardless of his type w. Differentiating ∆, we obtain ∆ (w) = u (w) − (1 − ρ (w))u (w − ρ(w)). (5) For unbiasedness we need ∆ (w) = 0, so that the penalty schedule ρ must satisfy the differential equation u (w − ρ(w)) − u (w) ρ (w) = . (6) u (w − ρ(w)) To solve for ρ, one requires an initial condition. This can be obtained by computing the penalty ρ(w) required to achieve the desired utility loss for the lowest type: ∆(w) = u(w) − u(w − ρ(w)) = ∆, or ρ(w) = w − u−1 (u(w) − ∆). (7) 7
  • 9. The differential equation (6) describes how to trace out the penalty schedule ρ that maintains the same utility loss ∆ for all types above w.9 This condition represents a knife-edge case, in that it characterizes exactly those penalty schedules which lead to unbiased equilibria. Departing from the knife-edge case in either direction leads to biased equilibria. Specifically, using the same steps as above, the equilibrium is biased against lower types if u (w − ρ(w)) − u (w) ρ (w) > . (8) u (w − ρ(w)) and biased against higher types if u (w − ρ(w)) − u (w) ρ (w) < . (9) u (w − ρ(w)) From (6)–(9) it is apparent that the direction of equilibrium bias depends on the utility function u as well as the penalty schedule ρ. Of course, if the utility loss ∆ induced by u and ρ is non-monotonic in w, the equilibrium is neither biased nor unbiased according to our definitions. In this case, there would be a local bias against lower types at some values of w, and a local bias against higher types at other values of w. 3.2 Prison vs. fines As shown earlier, our model encompasses many types of punishments commonly used in the real world, such as prison sentences, simple fines, and means-adjusted fines. In this section, we examine if these types of punishments lead to biased equilibria. The next result states a number of sufficient conditions for unbiased and biased equilibria. Theorem 3. The equilibrium is (a) unbiased if punishment is by a simple fine and individuals are risk-neutral, (b) unbiased if punishment is by a proportional fine and individuals have logarithmic utility, (c) biased against lower types if punishment is by imprisonment, and (d) biased against higher types if punishment is by a simple fine and individuals are strictly risk averse (i.e. u (w) < 0 ∀w). 9 Note that (6)–(7) describe the solution to a mechanism design problem which is quite similar to, say, the problem of designing an auction or other allocation mechanism: Similar to an incentive compatibility constraint, the unbiasedness requirement leads to a solution in terms of the slope of the design object (the penalty schedule in this case). Similar to the individual rationality constraint, the fact that a certain deterrence effect must be created for the lowest type yields an initial condition. 8
  • 10. Thus, imprisonment automatically leads to a bias against lower types, and the opposite is true for simple fines if agents are risk averse. A proportional fine, on the other hand, is an intermediate form of punishment, and Theorem 3 (b) identifies a special case for which it leads to unbiased equilibria. Note that with logarithmic utility, the utility loss from a proportional fine can be written as ∆(w) = ln w − ln(1 − γ)w = ln w − ln(1 − γ) − ln w = − ln(1 − γ), which is independent of w. Generally, however, a proportional fine can result in an equilibrium bias. To examine the effects of different forms of punishment further, we now derive a sim- ple sufficient condition for equilibrium bias in terms of risk preferences and elasticities. First, let R(w) denote the coefficient of relative risk aversion of u at w: u (w) R(w) = −w . u (w) Observe that risk-neutral utility has R(w) = 0, and logarithmic utility has R(w) = 1. Second, let ε(w) denote the elasticity of ρ at w: ρ (w) ε(w) = w . ρ(w) Observe that a simple fine has ε(w) = 0, a proportional fine has ε(w) = 1, and a prison sentence has ε(w) > 1 if w0 > 0. We have the following result: Theorem 4. The equilibrium is (a) biased against higher types if R(w) > 1 and ε(w) ≤ 1 ∀w, and (b) biased against lower types if R(w) < 1 and ε(w) ≥ 1 ∀w. Note that the “separating line” between cases (a) and (b) in Theorem 4 is the knife- edge case of logarithmic utility and a proportional fine. Suppose now that relative risk aversion increases above the logarithmic case. In this case, poorer individuals will experience more disutility if the same fraction of their income is confiscated, compared to richer individuals. Similarly, if we assume logarithmic utility but decrease the income elasticity of the penalty below the proportional case, poorer individuals are again hurt more by the penalty than richer ones. Thus, when both changes occur together, the deterrence effect ∆ unambiguously decreases in w, and as Theorem 4 (a) states the equilibrium will be biased against higher types. An analogous intuition applies to case (b), of course. Table 1 summarizes our results in the previous two Theorems. The superscripts indicate the relevant theorems. (If the utility function u is such that its degree of risk aversion is not uniformly above or below one, then Table 1 is still informative about the local bias in a neighborhood of a certain value of w.) The practical relevance of our results hinges on whether the various forms of pun- ishments do in fact impart a differential deterrence effect on individuals with differing 9
  • 11. Preferences Penalties Simple Fine Proportional Fine Imprisonment R(w) = 0 unbiased 3(a) against low 4(b) against low 3(c) R(w) ∈ (0, 1) against high 3(d) against low 4(b) against low 3(c) R(w) = 1 against high 3(d) unbiased 3(b) against low 3(c) R(w) > 1 against high 3(d) against high 4(a) against low 3(c) Table 1: Equilibrium bias for different penalties and risk preferences economic means. As noted in the introduction, the result that jail overdeters the rich and underdeters the poor is common in the theoretical literature. Empirically, research by Grasmick and Bryjak (1980) shows that individuals generally differ in how severe they perceive various forms of criminal sanctions. Unfortunately, their study does not relate perceived severity to economic covariates. Other papers have demonstrated a negative relationship between wages and employment on the one hand, and criminal participation on the other (e.g. Myers, 1983; Grogger, 1998; Gould et al., 2002). How- ever, these studies leave unanswered the question whether this relationship is due to deterrence effects.10 Bar-Ilan and Sacerdote (2004) examine the response of red-light violations to fine increases in Israel and San Francisco. The study finds that the elas- ticity of violations to fines is larger for younger drivers and owners of older cars, both of which are correlated with the driver’s affluence.11 4 Social Norms and Statistical Discrimination The previous section offered an explanation for why poorer individuals may be treated less favorably than richer ones in the courts. If income or wealth is correlated with 10 There are many competing explanations. Low-wage earners may offend more because they have more to gain from crime, especially property crime. Similarly, unemployed individuals may participate in crime at a higher rate because they have more time to do so. 11 As far as prison is concerned, anecdotal evidence suggests that its deterrence effect is large for the very affluent, and small or even negative for the very poor. For example, the 2002 Sabanes-Oxley Act increased the potential prison sentences for certain types of accounting fraud, a crime typically committed by affluent offenders undeterred by financial penalties. At the other end of the spectrum, on May 29, 2008, West Palm Beach, Florida, NBC affiliate WPTV re- ported on a homeless man who committed a drug crime in order to be sent to jail. The re- port quoted the man saying “I feel so much more free here. You can’t be free out there.” (See http://www.wptv.com/news/local/story.aspx?content id=3f6063d4-b79d-4f8f-8d78-2103dc 8998ba.) 10
  • 12. other characteristics, such as a person’s race, then the story we told can explain why racial groups with poorer members may also be the ones whose members are more easily convicted of crimes.12 In this section, we dispose of the assumption that indi- viduals differ in terms of their income ex-ante. We show that prejudice against certain identifiable subgroups of the population may nevertheless exist. 4.1 An extended model In our extended model, there are L ≥ 2 subgroups of the population. Membership in one group is a label l ∈ {1, . . . , L} that is publicly observable but a priori without economic significance. Thus, in contrast to the previous section, all agents are ex-ante alike with respect to such characteristics as their productivity, human capital, etc., which may influence a person’s income. We assume instead that differences in the realized value of an agent’s income are the direct result of the bias held against the agent’s group in the justice system. In particular, we let v : [0, 1] → [w, w] (w < w < ∞) describe an agent’s income as a function of the prejudice held against the agent. We assume that v is continuous and weakly decreasing. This reflects the idea that it may be harder for a person to find a job, or a high-paying job, if this person is assumed to be more prone to criminal behavior. This can be for several reasons. First, criminal activity may adversely affect an individual’s productivity in a job, for example because of increased absenteeism. Second, criminal activity may be targeted at the employer directly, for instance by stealing from a job site. Third, an employer may liable for an employee’s criminal actions when the employee harms a customer or another employee (under the legal theories of respondeat superior and negligent hiring). There is empiricial evidence that a feedback channel from (perceived) criminality to labor market outcomes indeed exists. Numerous studies find a negative impact of observed prior convictions on labor market outcomes, suggesting that employers are adverse to hiring convicted criminals (e.g. Lott, 1992; Grogger, 1995; Nagin and Wald- fogel, 1998; and many others). Other papers measure the effects of perceived crim- inality toward minorities on labor market outcomes. Bushway (2004) demonstrates that the black-white wage ratio is higher in states where criminal records databases are more easily accesible to employers. Holzer et al. (2006) show that employers who routinely conduct criminal background checks of applicants are more likely to hire African-American applicants than employers who do not perform routine checks (after controlling for characteristics of each firm’s applicant pool). Both studies suggest that in the absence of information about an individual’s criminal history group character- istics such as race may be used by employers to make inferences about an applicant’s criminality, and that such inferences are indeed used in hiring or pay decisions. 12 Even if the income distribution is the same within all racial groups, it is possible that differences in criminal participation and convictions emerge: If there are multiple prejudice levels consistent with a particular income level (which is possible if the probability of accidental investigation is high enough), then a person’s race may serve as a coordination device by which a particular equilibrium is selected. 11
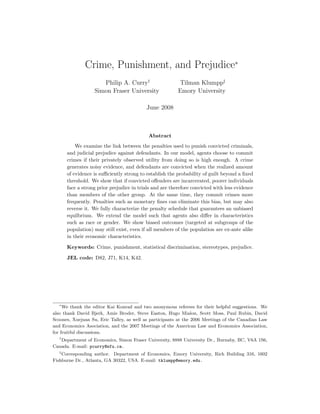
  • 13. 4.2 Equilibrium Since the only observable difference between individuals is that they belong to differ- ent subgroups of the population, we now replace the prejudice p(w) against persons of income w by a prejudice pl against persons who belong to group l. Similarly, re- place q(w) by ql , and t(w) by tl . An equilibrium in this case is now a collection (wl , p∗ , ql∗ , t∗ )l∈{1,...,L} such that for all l ∈ {1, . . . , L}, ∗ l l p∗ = 1 − Q(ql∗ ), l (10) ql∗ = [1 − F (t∗ ) − λ(1 − G(t∗ )] ∆l , l l (11) θ(pl , t∗ ) = α, l (12) ∗ wl = v(p∗ ), l (13) ∗ ∗ ∗ where ∆l = u(wl ) − u(wl − ρ(wl )) is defined as before. This is essentially the same set of defining equations as (2)–(4), except that a fourth condition has been added (condition (13)). This condition states that the equilibrium income level of group l, wl , must be consistent with the prejudice level p∗ held against group l. We now say an ∗ l equilibrium is biased if there exist two different groups l and l such that p∗ > p∗ . If l l such real inter-group differences arise in equilibrium, then these outcomes are “sunspot equilibria.” An equilibrium is unbiased if p∗ = . . . = p∗ . 1 L Equilibria can be derived from the intersection of p∗ (w) defined through (2) with the income function v(p). Let S = {(p, w) ∈ [0, 1] × [w, w] : p = p∗ (v(p))} be the set of all intersecting points of the two curves. An equilibrium in the extended model can then be constructed by assigning to each group l ∈ {1, . . . , L} an element in S, corresponding to the prejudice p∗ against group l and the income level wl of its l ∗ members. If S = ∅ an equilibrium exists, in which case there must be an unbiased equilibrium, as all groups can be assigned the same (p, w)-pair. However, if S contains more than one element there are also biased equilibria, as any assignment of groups to (p, w)-pairs contained in S represents an equilibrium in the extended model. We have the following result Lemma 5. Regardless of the punishment used, if 0 < λ ≤ λ there exists an equilibrium in the extended model. Furthermore, (a) if ∆ strictly decreases in w or is constant, then the equilibrium is unique and unbiased, and (b) if ∆ increases in w, biased equilibria exist for certain income functions v. We illustrate Lemma 5 in Figure 1. Note that the income function v that is depicted in both diagrams exhibits a drop at an interior p, and this will play a role for the 12
  • 14. multiplicity of equilibria in case (b) of the result. Such a drop can happen if there are two main job types that pay different wages—managerial and simple jobs, say—and each employer has a threshold for p at which they are willing to hire workers into the high-wage job. If the job-specific wages and prejudice thresholds are similar across firms, then the resulting income function will look like the one in Figure 1. w w p*(w) p*(w) w w w*1 w* = w* 1 2 w* v(p) v(p) 2 w w 0 p* 1 p* 2 1 0 p* = p* 1 2 1 Figure 1: Biased and unbiased equilibrium in the extended model The left diagram depicts the case of Lemma 5 (b), which applies to prison sentences. A stereotyping equilibrium can arise, in which different identifiable subgroups face an unfavorable bias in the courts. In this case, there are two groups: Group 1 earns a relatively high income w1 and faces a relatively low prejudice p∗ . The opposite holds ∗ 1 for group 2. In contrast, the right diagram shows the same v-curve as before, but a simple fine is used instead of prison to punish convicted agents. This corresponds to Theorem 2 (a). It is easy to see that there cannot be multiple intersections of p∗ and v now, so that the only equilibrium is an unbiased one. 4.3 Example: A dynamic link from prejudice to income In this section, we provide an example that demonstrates how a feedback channel from prejudice to income may arise within the criminal justice system. That is, we do not rely on labor market interactions to generate discriminatory outcomes. By using expected lifetime earnings as the relevant income variable, we show that the sanctions imposed by the courts can be directly responsible for differences in lifetime earnings. Consider the following stylized environment. Agents live for infinitely many peri- ods. At the beginning of each period, an agent works and earns a fixed wage of y, which is the same for all individuals, unless the individual is imprisoned and earns zero. All 13
  • 15. income is consumed in the period it is earned, and at the end of each period the events described in Section 2 unfold: Agents observe their i.i.d. η-shocks, decide whether to commit the crime, and possibly stand trial. If an agent is convicted (rightfully or wrongfully), he is removed from employment and sentenced to life in prison, represent- ing a permanent reduction in income. Otherwise, the agent starts the next period as a working individual. In computing their expected lifetime earnings, individuals apply a discount factor β < 1 and do not include future realizations of η.13 At the time the agent decides whether to commit a crime, the expected lifetime consumption for an agent from the next period on, conditional on entering the next period as a free individual, is β v(p) = y, 1 − βξ(q, t) where ξ(q, t) = [1 − Q(q)] F (t)+Q(q) [1 − λ(1 − G(t))] is the period-to-period “survival probability” associated with the tuple (q, t). The deterrence effect of the punishment is therefore the prospect of earning zero from the next period onward if convicted, instead of earning an expected continuation utility v(p). We hence set ∆ = v(p) − 0 = y · β/(1 − βξ(q, t)) and compute v(p) and p∗ (w) for the following parameter values:14 y = 1, α = 0.95, β = 0.95, λ = 0.01, η ∼ U [0, 5], F (t) = t2 , G(t) = 2t − t2 . The result is plotted in Figure 2. One can see that there are in fact three intersections of the two curves. Thus, if there are two or more racial (or otherwise distinguishable) groups in the population, whose members all earn y = 1 when not incarcerated, biased equilibria can arise simply because two different groups can be “assigned” different prejudice-lifetime income pairs which correspond to the intersections in Figure 2. This dynamic model can explain why some individuals choose to live a “life of crime” and why this choice may be correlated with characteristics such as race. Consider an individual in the high crime/low lifetime income group. Each time he decides whether to commit a crime he compares the benefit (η), which is distributed equally across the entire population, against the expected cost. The expected cost is that the individual (with some probability) loses his criminal career and goes to jail. However, continuing a life of crime is not a very enticing prospect either, because a career criminal expects to be jailed sooner or later anyways. Such a person is therefore less likely to be deterred by this prospect. The opposite holds for the choice to live a low-crime life, and the usual stereotyping argument can be made to sort individuals into different such equilibria based on some observable characteristic. The crucial aspect here is that, because 13 Unless η is literally regarded as the material benefit from a crime (for instance money stolen), this assumption seems not unreasonable. For offenses such as drug consumption, it seems indeed natural to impose a strong bias for the presence regarding the benefit η. 14 This is not entirely in line with some of our previous assumptions; for instance f (0) = 0 and η is bounded in this example. However, these assumptions are sufficient to ensure equilibria existed but not necessary, and our example illustrates that the same biased outcomes can also arise in other cases. 14
  • 16. w v(p) p*(w) p Figure 2: Numerical example, where v(p) is expected discounted lifetime income group membership cannot be altered, it is not possible for individuals to break out of the high-crime equilibrium—they would be treated in an adverse manner by the courts even if they decided not to commit crime ever. Finally, note that in this example observed wages are entirely uncorrelated with crime and conviction rates, while judicial stereotyping based on race still persists. This is interesting, as several empirical studies find that in the U.S. race is predictive of the incarceration rate even after controlling for economic factors (e.g. Bjerk, 2006; Krivo and Peterson, 1996; Raphael and Winter-Ebmer, 2001; and Trumbull, 1989). 5 Discussion and Policy Implications This paper demonstrates how statistical discrimination can result in the judicial system in much the same way as economists have considered it in the labor market. Our results yield a number of policy implications and suggest several extensions worthwhile pursuing. Below, we discuss some of them. Labor market interactions. It is worth discussing the linkage between discrimina- tion in the criminal justice system and the labor market. As shown in Section 3, lower incomes for certain groups can lead to increased incentives to commit crime. Such labor market differences can themselves be the result of (past) discrimination in the labor market. People who observe the increased crime rate among such groups may conclude that members of these groups are inherently more likely to commit crime, rather than attribute the increased crime to lower incomes. It is conceivable that such 15
  • 17. a prejudice can become self-fulfilling, even under policies which aim to eliminate these income differences across groups (see, for example, Sah, 1991). Thus, discrimination in the legal system which originally arose from discrimination in the labor market would be unaffected by policies such as affirmative action. Monetary vs. non-monetary sanctions. In order to eliminate prejudice in the legal system, policies targeted at the courts can be employed. Obviously, the equiva- lent policy to affirmative action—setting conviction quotas—would not be appealing. However, we show that prejudices can be eliminated through the choice of punishment. Biased equilibria arise when penalties are solely in terms of jail time, and the amount of time is independent of the defendant’s type. On the other hand, fines and in particular means-adjusted fines can avoid this problem. Of course, in order to achieve a desired deterrence effect through fines, it is possible that the fine must be chosen so high that some defendants would not be able to pay it (defendants are judgement proof). In such a case, penalties that first confiscate an individual’s wealth and then assign jail time based on the amount of fine left to pay would eliminate such equilibria. This form of penalty is prescribed by Polinsky and Shavell (1984, 2000). Thus, the question as to why jail (without first confiscating wealth) is used so frequently as a punishment remains. The role of information at trials. The discriminatory outcomes we explore in Section 4 are the result of a “sunspot effect,” where labels such as race are used as coordination devices. It is important to notice that the criminal justice system itself can generate such sunspots through its record-keeping technology. A case in point is whether or not juries should be informed of a defendant’s prior convictions. If this characteristic is observable to the jury, it can act as a coordination device. That is, there can be a social expectation that persons convicted before are more likely to commit further crimes. This expectation can become self-fulfilling, for reasons similar to the ones explored in Section 4.3. Moreover, this belief may be grounded in an entirely different theory, namely that some individuals are inherently more prone to commit crime than others.15 The obvious way to eliminate this bias is to restrict information about prior convictions at trials. If this is not possible, then a schedule of graduated penalties for repeat offenders (e.g. Emons, 2007) may be desirable, as it increases the deterrence effect for individuals subject to an unfavorable prejudice (i.e., individuals with prior convictions). The effects of policing. In this paper we do not formally consider the process by which suspects are apprehended and evidence is generated. Such an analysis could be an interesting extension of the model we present. That is, one could investigate how the results change when the evidence generating functions F and G are altered. 15 While this may or may not be the case, our argument is that the statistical discrimination theory is observationally equivalent. 16
  • 18. For example, if an increase in policing were to increase (proportionally) the evidence generated for both innocent and guilty parties, then an increase in expenditures on police would have no effect on the existence of a biased equilibrium. If, however, an increase in policing increased evidence against guilty parties and decreased (or had no effect) on evidence against innocent parties, then an increase in policing could eliminate stereotyping equilibria. In order to explore the “true” properties of evidence generation, empirical studies of the effect of policing (e.g. Knowles, Persico and Todd, 2001) could perhaps be used. However, since it cannot be known with certainty if convicted parties are actually innocent or guilty, it is unclear how much light such studies can ultimately shed on this issue. Appendix We start with two preliminary observations. First, note that 1 − F (t) − λ(1 − G(t)) is weakly decreasing in t if and only if λ ≤ f (t)/g(t). Since f (t)/g(t) is increasing by assumption, if λ ≤ λ then 1 − F (t) − λ(1 − G(t)) is non-increasing. For λ ≤ λ we therefore get ∂ λ≤λ ⇒ q = [−f (t) + λg(t)] ∆ ≤ 0. (14) ∂t Thus, if λ ≤ λ, an increase in the conviction threshold t indeed leads to a decrease in the decision threshold q of the agent. Second, since 1 − F (1) − λ(1 − G(1)) = 0, we have 1 ∂ λ≤λ ⇒ q = 1 − F (t) − λ(1 − G(t)) = − [−f (s) + λg(s)] ds ≥ 0. (15) ∂∆ t Thus, if λ ≤ λ, an increase in the potential penalty ∆ leads to an increase in the decision threshold q of the agent. Proof of Lemma 1. To prove an equilibrium exists, we make a standard fixed point argument. Fix any w and define three maps, T1 : q → p : [0, ∞) → [0, 1], T2w : t → q : [0, 1] → [0, ∞), T3 : p → t : (0, 1) → [0, 1] by (2), (3) (given w), and (4), respectively; these are all given in Section 2.4. Note that T1 , T2w and T3 are continuous on their respective domains. T3 is well-defined through (4) on (0, 1) only; however it can be extended continuously to [0, 1] by setting T3 (0) = 1 and T3 (1) = 0. Further, as T2w is continuous on a compact domain, its image is bounded. We can hence restrict the range of T2w , as well as the domain of T1 , to [0, q (w)] for sufficiently large q (w). Now define a new map ˆ ˆ T w : [0, 1] × [0, q (w)] × [0, 1] → [0, 1] × [0, q (w)] × [0, 1] ˆ ˆ 17
  • 19. by setting T w (p, q, t) = (T1 (q), T2w (t), T3 (p)). Since T w is continuous and maps a compact subset of R3 into itself, we can apply Brouwer’s fixed point theorem to show, for given w, there exists (p∗ (w), q ∗ (w), t∗ (w)) such that (p∗ (w), q ∗ (w), t∗ (w)) = T w (p∗ (w), q ∗ (w), t∗ (w)); thus it solves (2)–(4) simultaneously. Since such a fixed point can be constructed for each w independently, an equilibrium as defined above exists. To prove uniqueness, let λ ≤ λ and suppose there are two equilibria, (p∗ , q ∗ , t∗ ) = (p ∗ , q ∗ , t∗ ). Thus there exists w such that q ∗ (w) = q ∗ (w) (otherwise p∗ (w) = p∗ (w) ∀w by (2), which implies t∗ (w) = t∗ (w) ∀w, by (4), but then the equilibrium would be unique). So suppose, without loss of generality, that q ∗ (w) > q ∗ (w) for some w. Condition (2) then implies p∗ (w) < p∗ (w), and using (4) we have t∗ (w) > t∗ (w). If λ ≤ λ then using (14) we get q ∗ (w) ≤ q ∗ (w), a contradiction. Hence the equilibrium is unique if λ ≤ λ. Proof of Lemma 2. Let w > w and suppose ∆(w) > ∆(w ). If p(w) ≥ p(w ), then by condition (2), q(w) ≤ q(w ). However, by condition (4) and the fact that f /g increases, we have t(w) ≤ t(w ). Thus if ∆(w) > ∆(w ) then (14)–(15) imply q(w) > q(w ), which is a contradiction, and therefore p(w) < p(w ). From (4) it follows then that t(w) > t(w ), and from (2) it follows that q(w) > q(w ). Exactly the opposite argument can be made when w > w and ∆(w) < ∆(w ). Finally, when ∆ is a constant then (3) is independent of w so that p∗ , q ∗ , and t∗ are constant and hence constitute an unbiased equilibrium. Proof of Theorem 3. If u (w) = 0, then ∆ (w) = u (w) − u (w − δ) = 0, and Lemma 2 (iii) implies (a). If ρ(w) = γw and u(w) = a ln w + b, then ∆ (w) = a/w − a/w = 0, and Lemma 2 (iii) implies (b) as well. In case of imprisonment, ∆(w) = u(w) − u(w0 ), which is strictly increasing in w since u (w) > 0, and applying Lemma 2 (ii) yields (c). In case of a simple fine, ∆(w) = u(w) − u(w − δ), which is strictly decreasing in w if u (w) < 0 ∀w. Thus, applying Lemma 2 (i) yields (d). Proof of Theorem 4. Suppose R(w) > 1 for all w, or equivalently −γwu (γw)/u (γw) > 1 ∀γ, and thus ∂ γu (γw) = u (γw) + γwu (γw) < 0 ∀γ. (16) ∂γ Let µ(w) = w − ρ(w) be the income left to the individual after the fine ρ(w). Since µ(w) < w, (16) implies 1 µ(w) u (µ(w)) = u (w) − γu (γw) dγ > u (w). (17) w µ(w)/w Suppose now that ε(w) ≤ 1 ∀w: wρ (w)/ρ(w) ≤ 1. Multiplying this inequality by ρ(w)/w yields ρ (w) ≤ ρ(w)/w, and expressing the fine as ρ(w) = w − µ(w) we get 18
  • 20. µ (w) ≥ µ(w)/w. Then by (17) ∂ ∆ (w) = [u(w) − u(µ(w))] = u (w) − µ (w)u (µ(w)) ∂w ρ(w) ≤ u (w) − u (µ(w)) < 0. w By Lemma 2 (i), therefore, the equilibrium is biased against higher types. Analogous steps can be repeated for R(w) < 1 and ε(w) ≥ 1, in which case ∆ (w) > 0 and the equilibrium is biased against lower types by Lemma 2 (ii). Proof of Lemma 5. We first prove the existence part. Note that v is a continuous function mapping p ∈ [0, 1] to w ∈ [w, w]. If λ ≤ λ, p∗ (w) is a function by Lemma 1. As ∆ is continuous in w regardless of the punishment used, w enters the mapping T defined in the proof of Lemma 1 continuously, so p∗ is continuous. This implies that in [0, 1] × [,w], the graphs of v and p∗ intersect at least once, so S = ∅. We now prove statements (a) and (b) of the result. For (a) note that by Lemma 2 (i) p∗ strictly increases for strictly decreasing ∆. Therefore, for each v there is exactly one w ∈ [0, 1] such that v(p∗ (w)) = w. If ∆ is constant, then by Lemma 2 (iii) p∗ is constant. It will hence become a vertical line in p-w space, which is intersected by any decreasing, continuous v exactly once. Hence |S| = 1, so that exactly one equilibrium exists, which must be unbiased. For (b), note that by Lemma 2 (ii) p∗ strictly decreases for strictly increasing ∆. Therefore, there exists a continuous, decreasing function v for which the following holds: There exists w1 , w2 ∈ [w, w], w1 = w2 , such that v(p∗ (w1 )) = w1 and v(p∗ (w2 )) = w2 . For such v, |S| > 1, and a biased equilibrium exists. References Alexeev, M. and J. Leitzel (2004): “Racial Profiling,” mimeo, Indiana University. Arrow, K. (1973): “The Theory of Discrimination,” in: O. Ashenfelter and A. Rees (eds.): Discrimination in Labor Markets, Princeton University Press, 3–33. Bar-Ilan, A. and B. Sacerdote (2004): “The Response of Criminals and Noncrim- inals to Fines,” Journal of Law and Economics, 47, 1–17. Becker, G. (1968): “Crime and Punishment: An Economic Approach,” Journal of Political Economy, 76, 169–217. Bjerk, D. (2006): “Theory and Evidence Regarding the Effects of Segregation on Crime Rates,” mimeo, Claremont McKenna College. Bjerk, D. (2007): “Racial Profiling, Statistical Discrimination, and the Effect of a Colorblind Policy on the Crime Rate,” Journal of Public Economic Theory, 9, 425– 545. 19
  • 21. Burke, A. (2007): “Neutralizing Cognitive Bias: An Invitation to Prosecutors,” NYU Journal of Law and Liberty, 2, 512–530. Bushway, S. (2004): “Labor Market Effects of Permitting Employer Access to Crim- inal History Records,” Journal of Contemporary Criminal Justice, 20, 276–291. Coate, S. and G. Loury (1993): “Will Affirmative-Action Policies Eliminate Nega- tive Stereotypes?” American Economic Review, 83, 1220–1240. Emons, W. (2007): “Escalating Penalties for Repeat Offenders,” International Review of Law and Economics, 27, 170–178. Georgakopoulos, N. (2004): “Self-fulfilling Impressions of Criminality: Uninten- tional Race Profiling,” International Review of Law and Economics, 24, 169–190. Gould, E., B. Weinberg, and D. Mustard (2002): “Crime Rates and Local Labor Market Opportunities in the United States: 1979-1997,” The Review of Economics and Statistics, 84, 45–61. Grasmick, H. and G. Bryjak (1980): “The Deterrent Effect of Perceived Severity of Punishment,” Social Forces, 59, 471–491. Grogger, J. (1995): “The Effect of Arrests on the Employment and Earnings of Young Men,” Quarterly Journal of Economics, 110, 51-71. Grogger, J. (1998): “Market Wages and Youth Crime,” Journal of Labor Economics, 16, 756-791. Hillsman, S. (1990): “Fines and Day Fines,” Crime and Justice, 12, 49–98. Holzer, H., S. Raphael, and M. Stoll (2006): “Perceived Criminality, Criminal Background Checks, and the Racial Hiring Practices of Employers,” Journal of Law and Economics, 49, 451–480. Knowles, J., N. Persico, and P. Todd (2001): “Racial Bias in Motor-Vehicle Searches: Theory and Evidence,” Journal of Political Economy, 109, 203–229. Krivo, L. and R. Peterson (1996): “Extremely Disadvantaged Neighborhoods and Urban Crime,” Social Forces, 75, 619–650. Levitt, S. (1997): “Incentive Compatibility Constraints as an Explanation for the Use of Prison Sentences Instead of Fines,” International Review of Law and Economics, 17, 179–192. Lott, J. (1987): “Should the Wealthy Be Able to ‘Buy Justice’ ?” Journal of Political Economy, 95, 1307–1316. Lott, J. (1992): “An Attempt at Measuring the Total Monetary Penalty from Drug Convictions: The Importance of an Individual’s Reputation,” Journal of Legal Studies, 20
  • 22. 11, 159–187. Morris, N. and M. Tonry (1990): Between Prison and Probation, Oxford University Press, Oxford. Myers, S. (1983): “Estimating the Economic Model of Crime: Employment Versus Punishment Effects,” Quarterly Journal of Economics, 98, 157–166. Nagin, D. and J. Waldfogel (1998): “The Effect of Conviction in Income Through the Life Cycle,” International Review of Law and Economics, 18, 25–40. Persico, N. (2002): “Racial Profiling, Fairness, and Effectiveness of Policing,” Amer- ican Economic Review, 92, 1472–1497. Phelps, E. (1972): “The Statistical Theory of Racism and Sexism,” American Eco- nomic Review, 62, 659–661. Polinsky A. and S. Shavell (1984): “The Optimal Use of Fines and Imprisonment,” Journal of Public Economics, 24, 89–99. Polinsky A. and S. Shavell (2000): “The Economic Theory of Public Enforcement of Law,” Journal of Economic Literature, 38, 45–76. Posner, R. (1992): Economic Analysis of Law, 4th Edition, Little, Brown and Com- pany, Boston. Raphael, S. and R. Winter-Ebmer (2001): “Identifying the Effect of Unemploy- ment on Crime,” Journal of Law and Economics, 44, 259–283. Sah, R. (1991): “Social Osmosis and Patterns of Crime,” Journal of Political Economy, 99, 1272–1295. Spiegel, U. and J. Templeman (1989): “Economics of Discriminatory Sentencing,” Journal of Quantitative Criminology, 5, 317–332. Trumbull, W. (1989): “Estimations of the Economic Model of Crime Using Aggre- gate and Individual Level Data,” Southern Economic Journal, 56, 423–439. Verdier, T. and Y. Zenou (2004): “Racial Beliefs, Location, and the Cause of Crime,” International Economic Review, 45, 731–760. 21