250 words each agree or disagree each questions Q 1.Sent.docx
Does_Pay_to_Stay_Policy_Work
1. Does Pay-to-Stay policy work? Evidence from Michigan
By Haogong Tong∗
This article explored the effect of a jail policy called Pay-to-Stay,
which requires prisoners to pay for some of their expenditures oc-
curred in jails. The article used differences estimator with regres-
sion controls to test the policy’s impact on crime rate, incarceration
rate and jail expenditure. Among pooled OLS, random effect and
fixed effect methods, pooled OLS was used to estimate the mod-
el due to data limitation. The results showed that when holding
the pretreatment characteristics constant, Pay-to-Stay significant-
ly increased both crime rate and incarceration rate on relative large
scales. But it did not have significant influence on jail expendi-
ture. We conjectured that Pay-to-Stay increased incarceration rate
through its influence on crime rate, but regression result showed
that crime rate did not significantly affect incarceration rate. Re-
gression result of jail expenditure model also negated our hypoth-
esis that Pay-to-Stay may increase jail expenditure by increasing
jail population.
I. Introduction
This article explores the effect of a jail policy called Pay-to-Stay, which re-
quires jail inmates to pay for a fraction of their own expenditure occurred in
jails. A common form of this policy is to charge inmates a fixed amount of re-
imbursement fee for each day they spend in jail. Between 2000 and 2007, the
growth rate of imprisonment in US has exceeded the growth rate of total popu-
lation (Western and Pettit, 2010). In 2000, while federal prisons are designed to
hold approximately 83,000 prisoners, they were actually holding approximately
111,000 prisoners (Gershowitz, 2008). With rapid growth in incarceration, states
prisons are experiencing budget deficits, which are expected to increase in the fu-
ture (Scott-Hayward, 2009). Stephan (1999) also discovered an increasing trend
in correction expenditure1 over the past thirty years. Pay-to-Stay was introduced
under the background of over-incarceration and rapid growth of jail expenditure.
Eisen (2013) summarized four major rationales of this policy. The first rationale
∗ Tong: Economic department, Georgetown University, ht343@georgetown.edu. The author is grateful
to Agnieszka Postepska for advice. The author also thanks Jinting Li, Yingwen Yu and Chenzhe Du for
assistance in finding data. The usual disclaimer applies.
1According to Bureau of Justice Statistics’ definition, correction refers to the supervision of arrested,
convicted and sentenced people. The concept of correction institution is larger than the so-called jails.
On county level, however, correction institution is not very different from jails. Since county government
budgets do not have a jail expenditure term, we use correction expenditure as the proxy of jail expen-
diture. The words of correction expenditure and jail expenditure will be used interchangeably in this
article.
1
2. is that the revenue stream helps to offset expensive incarceration budgets. The
fact that Pay-to-Stay programs charge inmates for the cost of their incarceration
may provide a financial solution for jail’s budget problems (Andolena, 2010). The
second rationale is punitive in nature and focuses on teaching inmates a lesson
for their criminal acts. The policy should ”send a message to criminals that if
you do the crime, you pay to do the time” (Press, 2003) and therefore restrain
people’s attempt in doing crimes. The third rationale is that politicians can often
gain the support of constituents by supporting inmate Pay-to-Stay fees. A fourth
rationale is to reduce frivolous requests for services by inmates. I will focus on the
first and second rationales to answer the question of whether Pay-to-Stay policy
can really reduce crime rate and jail expenditure.
This article is organized as follows. Section II analyzes the mechanism of how
Pay-to-Stay will affect crime rate and jail expenditure. It also explores other
possible factors that may have significant effect on crime rates or jail expenditure
from former researches. Former articles would provide the basic model of crime
rate and jail expenditure, on which I would build my own. I will further explain
the data source and sample selection process in Section III. Some raw evidence
would be shown in this section too. Using the findings in Section II, I will estab-
lish three regression models to test the sole effect of Pay-to-Stay in Section IV.
Endogeneity problem and possible solution will be addressed in Section IV. Sec-
tion V shows the results of regressions. Finally, I will summarize the conclusions
and discuss the limitations of this article in Section VI.
II. The economics of Pay-to-Stay’s effect
Not many sound researches have studied the effect of Pay-to-Stay, so this re-
search would be a fresh start on this subject. Eisen (2013) classified Pay-to-Stay
into three categories. The first type refers to charging individuals a fixed amount
of fee per day. The second type of Pay-to-Stay program charges inmates for extra
living necessities. The third type refers to purchasing four-star accommodations
for those who can afford to pay to do their time in a more desirable facility. Let-
ting inmates pay to upgrade their living standard in jails does not reduce the jail
expenditures, because jail administration will spend the same amount of money
on extra facilities. Also, if the Pay-to-Stay reimbursement fee is optional for each
inmate, it will not increase the cost of crime and thus will not affect the crime
rate. Therefore this article focused on the first type of Pay-to-Stay policy.
Ever since Becker (1974) explained the decision of whether to conduct a crime
as a rational choice based on costs and gains of crimes, the theory has been
refined by others for decades. Empirical tests supported Becker’s theory. Since
Pay-to-Stay increases the cost of crime, the supply of offences should theoretically
decrease. Therefore, other conditions being constant, crime rate should fall once
Pay-to-Stay is implemented. But Pay-to-Stay also has an opposing effect on crime
rates. Charging inmates for a large amount of money will make them poorer after
they got released. Intuitively speaking, the poorer a person is, the more likely
2
3. he is to conduct crimes. Thus, Pay-to-Stay can also increase the overall crime
rate by increasing recidivism rate2. Also, since most criminals are not capable
of paying their debt occurred in jail, their Pay-to-Stay fee may become a burden
of their families’ instead of their own (Michtom, 2003). If Pay-to-Stay fee does
not impose extra cost on potential criminals, it may not affect their decision of
conducting crimes.
Aside from Pay-to-Stay, other factors affect crime rate as well. Trumbull (1989)
examined a large number of determinants that may have effects on crime rate.
The following factors were found significant: ratio of arrests to crimes, ratio of
convictions to arrests, proportion of convicted offenders sent to jail, county type
(urban or rural), average sentence length, unemployment rate, location, police
employment per capita, population density, proportion of white people in the
population. Allison (1972) used data of the city of Chicago and nearby communi-
ties, to regress the actual crime rate of the community on 14 variables that were
found in the Uniform Crime Reports. In the order of importance, six variables
were found most significant: unemployment rate, the percentage of males in the
population, expenditures for parks and recreation by the community, the mean
number of years of schooling of the population, the proportion of the population
age 15 through 24, and the distance the community is from the core of the city.
Among these six variables, the first two variables were statistically significant at
5% level. Cho (1972) established regression models measuring the relationship be-
tween policy and crime rates of different crime types. Cho found that correctional
policies and environmental service policies are most likely to be significant deter-
minants of crime rates. Therefore, Pay-to-Stay, a correctional policy in nature,
is very likely to affect crime rate. The overall change in crime rates depends on
the combined effect of Pay-to-Stay and other possible determinants. Only when
controlling all non-relevant factors can we test the sole effect of Pay-to-Stay.
Suppose Pay-to-Stay’s overall effect on crime rate is positive. Higher crime rate
may lead to higher jail population. We would be curious about if Pay-to-Stay fur-
ther increases jail population. To specify Pay-to-Stay’s impact on jail population,
other factors need to be taken into account too. A common determinant of jail
population is race. Jacobs and Carmichael (2001) provided evidence suggesting
that fear of Hispanics may lead to more repressive control efforts by showing that
imprisonment rates are greater in states with a larger Hispanic population. An-
other important determinant would be unemployment rate. It has been argued
that unemployed workers are less committed to the law and the dominant moral
order and are therefore more likely to be punished for conduct that threatens
this order. For this reason, Jankovic (1977) hypothesized that ”a rise in un-
employment will lead to an increase in prison commitments because the policy
2Recidivism refers to a person’s relapse into criminal behavior, often after the person receives sanctions
or undergoes intervention for a previous crime. Recidivism is measured by criminal acts that resulted
in rearrest, reconviction or return to prison with or without a new sentence during a three-year period
following the prisoner’s release. See details in http://www.nij.gov/topics/corrections/recidivism/
pages/welcome.aspx
3
4. of deterrence dictates an intensification of punishment to combat the increasing
temptation to commit crime”. Also, an unemployed individual is usually con-
sidered imposing a higher threat to community safety among common opinions.
Greenberg (1977) maintains that it is ”plausible to assume that judges are less
willing to grant probation to offenders when they are unemployed, or that unem-
ployment affects levels of community tolerance toward offenders, to which judges
respond in sentencing”. ”Age and sex are the staples of demographic analysis,
and the relative youth of the largely male incarcerated population foreshadows
much about the effects of mass incarceration” (Western and Pettit, 2010). Jacob-
s and Helms (1996) discovered that variance in income, which is used to depict
income inequality, has a positive effect on incarceration rate. Last, but not least,
the capacity of jails determines the upper limit of jail population.
Can Pay-to-Stay really reduce jail expenditure? The answer is not necessarily.
This policy should have reduced jail expenditure per individual as inmates pay a
fraction of their own cost occurred in jails. But, as discussed above, in the worst
case, Pay-to-Stay may lead to an overall increase on crime rate,and could further
increase jail population. If so, even if the per individual expenditure in jail may
decreases under Pay-to-Stay, the overall expenditure on inmates may still rise due
to more rapid growth of jail population. Also, most offenders locked up in jails
would not have conducted crimes if they had money. Jail administration may find
it very hard to collect Pay-to-Stay fee from inmates. ”The likelihood of getting a
high-percentage reimbursement is small” (Rawlings, 2013).
As in the discussion of crime rate and jail population, other factors besides Pay-
to-Stay can affect jail expenditure as well. Schmitt et al. (2010) discovered that
correction costs are mainly correlated with incarceration rate. They demonstrat-
ed that the total cost (in inflation-adjusted dollars) of government corrections
budgets has increased almost in lock-step with the incarceration rate. Taggart
(1989) combined Autoregressive Model, Share-of-the-Pie Model and Constituen-
cy Model together and formulated a General Model that can be represented as
follows:
Et = b0 + b1Et−1 + b2Pt−1 + b3Ct−1 + t(1)
where Et is a state’s expenditures for corrections in a given year, Et−1 is the
expenditure total for corrections in the previous year, Pt−1 is total government
spending in the previous year, Ct−1 is the state’s prison population in the pre-
vious year, t is the error, and bi are parameters to be estimated. This model
almost perfectly predicted the state correction expenditures in Taggart’s research.
Taggart used OLS to estimate the model for every State in US and achieved very
promising R2 for each State. I will adapt this model to county-level jails instead
of state prisons.
In conclusion, Pay-to-Stay can either decrease crime rate by increasing the cost
of crime, or increase the the crime rate by increasing the possibility of recidivism.
4
5. The overall effect of Pay-to-Stay is unclear. Pay-to-Stay may affect jail population
and thus affect jail expenditure through its influence on crimes. Even though this
policy reduces the per individual expenditure in jails, it may not reduce the total
jail expenditure.
III. The data
The sample came from 11 counties in the state of Michigan, from 2000 to 20143.
The sample was limited in one state to eliminate any possible effect caused by
different state laws. There are three main reasons why Michigan as chosen as the
sample state. First, Michigan counties are practicing the first type of Pay-to-Stay
programs as discussed in Section II. Only the first type will affect jail expenditure
and people’s decision in whether to conduct crimes. Second, Michigan’s inmate
reimbursement law (Prisoner Reimbursement to the County Act PA. 1984 No 118)
allows, instead of requires, counties to charge inmates for their time in jails. So,
it is still possible to find non-Pay-to-Stay counties to be included in the control
group. Third, according to the law, whoever failed to pay this reimbursement
fee would be imposed a debt after he got released from the jail. A failure to pay
the debt would go into one’s credit record. Therefore, the policy’s impact on
individuals would be universal.
Not only should we specify which counties have adopted the Pay-to-Stay policy,
but should also know explicitly in which years the policy was implemented as well.
Unfortunately there is no official record for the starting and ending date of this
policy at county level. I contacted all county sheriff offices in Michigan to confirm
which counties have implemented Pay-to-Stay and their exact implementing years.
I looked for clear answers for two questions from every county sheriff in Michigan:
(1) Does your county engage in Pay-to-Stay practice? (2) If yes, when did you
start? 11 counties gave clear answers of whether they have the policy and in
which years the policy was implemented4. These 11 counties shown in Table 1
would be the sample base5. The total number of observations is 165 (11 counties
× 15 years).
Among the counties that have engaged in Pay-to-Stay, only Ingham and Washt-
enaw started their Pay-to-Stay practice between 2000 and 2014, while others in
1980s. Seven counties are urban and four counties are rural. Seven counties have
3Since most counties started their implementation of Pay-to-Stay in 1980s, it would be better if we
could find data before 1980s. However, some of the control variables in the model do not have county
level data before 2000. So I only used the data from 2000 to 2014.
4Neither the sheriffs’ offices nor the county jail administrations have official record, I need to find
staffs in sheriffs’ offices who can confirm with the starting policy, mostly the sheriffs who had witnessed
the starting year of the policy in their counties. Unfortunately, most staffs who could confirm this
information are either retired or dead. To ensure the accuracy of data, only the counties that were able
to gave clear and firm answers were included in the sample.
5The sheriffs and staffs who provided clear answers are as follows: Sheriff Gene Wriggelsworth (In-
gham), Sheriff Dale Malone (Monroe), Sheriff Bradley Balk (St. Joseph), Sheriff Anthony Wickersham
(Macomb), Sheriff Michael Bouchard (Oakland), Sheriff Pete Wallin (Emmet), Gary Greenfield (Washt-
enaw), Sheriff John Pollack (Branch), Sheriff Jack Welsh (Lenawee), Paul G. Matyas (Kalamazoo).
5
6. Table 1—List of counties
County Location Type Pay-to-Stay Implementing years
Ingham Central Michigan Urban Yes 2004 - 2015
Monroe Southeast Michigan Urban Yes 1994 - 2015
St. Joseph West Michigan Rural Yes 1990 - 2015
Macomb Southeast Michigan Urban Yes 1985 - 2015
Oakland Southeast Michigan Urban Yes 1985 - 2015
Emmet North Michigan Rural Yes 1984 - 2015
Washtenaw Southeast Michigan Urban Yes 2005 - 2010
Branch Central Michigan Rural No
Lenawee Southeast Michigan Rural No
Kalamazoo West Michigan Urban No
Genesee Flint/Tri-city Urban No
practiced Pay-to-Stay and four counties have never engaged in Pay-to-Stay pro-
gram. Washtenaw terminated their implementation in 2010. Aside from Ingham
and Washtenaw, some average data for the other nine counties, which had consis-
tently implemented or ignored the policy from 2000 to 2012, are shown in Table
2. Counties with Pay-to-Stay policy have a higher average crime rate of 7.33 com-
paring to 5.37 for those that never implemented the policy. Pay-to-Stay counties
also have higher average growth rate in jail expenditure, 1.88%, comparing to
1.02% for non Pay-to-Stay counties. It suggests Pay-to-Stay may have done more
harm than good. But Pay-to-Stay counties have a lower average growth rate in
incarceration rate. A more accurate model will be established in Section IV to
examine if Pay-to-Stay is the cause of differences between the two types of coun-
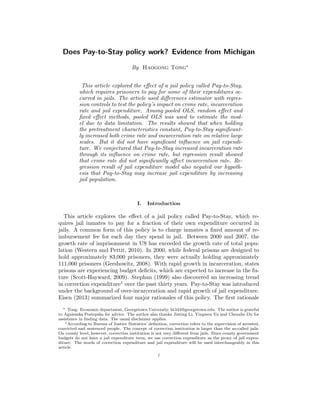
ties. Figure 1 and Figure 2 showed that about half of the counties have been
experiencing growth in total jail population and incarceration rate6.
Table 2—Summary data classified by Pay-to-Stay
Pay-to-Stay Yes No
Average crime rate 7.33 5.37
Annual growth of jail expenditure 1.88% 1.02%
Annual growth of incarceration rate 5.83% 7.54%
Average unemployment rate 7.98 7.37
Average per capita police 0.00050 0.00048
Possible control variables for estimating Pay-to-Stay’s effect on crime rates were
6Incarceration rate refers to number of prisoners in every 100,000 population.
6
7. 050010001500
JailPopulation
2000 2005 2010 2015
Year
Branch Emmet
Genesee Ingham
Kalamazoo Lenawee
Macomb Monroe
Oakland St. Joseph
Washtenaw
Figure 1. Trend of jail population
0100200300400
IncarcerationRate
2000 2005 2010 2015
Year
Branch Emmet
Genesee Ingham
Kalamazoo Lenawee
Macomb Monroe
Oakland St. Joseph
Washtenaw
Figure 2. Trend of incarceration rate
discussed by Trumbull (1989) and Allison (1972) , the significant factors that
may have effects on crime rates are as follows: ratio of arrests to crimes, ratio
of convictions to arrests, proportion of convicted offenders sent to prison, county
type (urban7 or rural), average sentence length, unemployment rate, location,
police employment per capita, population density, proportion of white people in
the population, proportion of males in the population, proportion of youths (15-
24) in the population, expenditures for parks and recreation by the community,
7According to definition by US census, an urban county contains a city of greater than 50,000 people
or has an area with at least 100,000 people and has a substantial commuting interchange with a city of
greater than 50,000 people.
7
8. average years of schooling of the population, distance from the core of the city.
Trumbull (1989) collected data of crime rate, ratio of arrests to crimes, ratio of
convictions to arrests, per capita police force, and proportion of convicted offend-
ers sent to prison from Uniform Crime Report (UCR). But UCR does not include
the ratio of arrests to crimes and ratio of convictions to arrests at county level. I
will use ratio of arrests to offenses and ratio of charges to arrests as proxies8. As I
collected data from UCR, I did not find data on proportion of convicted offenders
sent to prison, or average sentence length at county level. Unemployment rate
was drawn from US Bureau of Labor Statistics. Data of population density, frac-
tion of white people in population, fraction of black people in population, fraction
of Hispanic people in population, male population, and youth population came
from US Census Bureau9. Data of average years of schooling are not available
before 2009 so it will not be included in the model. Data of jail expenditure and
total government expenditure were collected from annual budget reports of the
11 counties in the sample.
Summary data of control variables are shown in Table 3. The overall average
crime rate in the sample is 6.493 with standard deviation of 4.505. The majority
of the population are white people, accounting for about 85% of the population.
About 7% of the population are African-American, and about 4% are Hispanics.
The rest of the population are mainly Asians according to census report. About
one third of the offenders are arrested, and one third of the arrested offenders
will be charged. Average of population density is about 435 people per square
mile, with a considerably large standard deviation of 450.906. By definition,
urban counties have much larger population density comparing to rural counties.
About half of the population are males, 16% of the population are between the
age of 16 and 24. Proportion of males does not vary much in the sample.
IV. Empirical approach
Consider the decision of whether implement Pay-to-Stay as an experimental
treatment. The control group is those observations that are not engaged in Pay-
to-Stay and the treatment group is the observations that are engaged in Pay-to-
Stay. The assignment of subjects are not strictly randomized in this experiment.
There are two major methods to examine the effect of treatment variable in a
quasi-experiment: differences estimator and differences-in-differences estimator10.
The core idea is to isolate the sole impact of Pay-to-Stay, meaning that we need
to control all the non-relevant variables. The selection process is not likely to
be random, but by adding control variables into the model, we can avoid sample
selection bias. Since only 11 counties could be included in the sample, the sample
8I did not find any sort of data as ratio of arrests to crimes. I could only find ratio of arrests to offenses.
I believe Trumbull referred to crime as offense. It seemed that he misunderstood the terminology.
9Though national census is conducted every ten years, data of population, race, sex, education, and
age are estimated annually. Details are shown at http://www.census.gov/popest/about/terms.html.
10See Meyer (1995) for details.
8
9. Table 3—Summary data of control variables
Variable Mean Std.Dev. Min Max
Ratio of arrests to offenses 0.334 0.059 0.193 0.511
Ratio of charges to arrests 0.330 0.122 0.020 0.630
Unemployment rate 7.728 2.9054 2.4 15.8
Urban dummy 0.618 0.487 0 1
Police force per capita 0.000475 0.000141 0.000256 0.000759
Population density 434.709 450.906 35.783 1499.995
Proportion of whites 0.847 0.077 0.718 0.964
Proportion of blacks 0.073 0.057 0.004 0.204
Proportion of Hispanics 0.038 0.019 0.009 0.076
Proportion of youths 0.156 0.046 0.113 0.263
Proportion of males 0.493 0.009 0.481 0.527
Crime rate 6.493 4.505 1.049 22.541
size is insufficient for differences-in-differences estimator. Also, to use differences-
in-differences estimator with regression controls, we need data around 1980s, but
the data on several control variables is not available before 2000. Three differences
estimator models will be established to examine Pay-to-Stay’s effect.
A. Crime rate model
Factors that may have influence on crime rate have been discussed in Section 2.
Ideally, we hope to include all the factors into the model as regression controls.
However, a few variables have to be omitted. The first omitted variable is average
sentence length. Since longer average sentence length increases cost of jails and
thus lead jail administration more likely to adopt Pay-to-Stay, average sentence
length may be correlated with the decision of whether to engage in Pay-to-Stay.
But it was removed from the model because there was no official data of average
sentence length at county level. The second omitted variable is recreation ex-
penditure. Allison (1972) used samples drawn from communities and recreation
expenditure is recorded by communities. But county governments do not have
such expenditure term on their budgets, so it could not be included in the model.
The third omitted variable is proportion of convicted offenders sent to jail. This
data is recorded by local courts in Michigan on individual basis but I did not
have access to the judicial files. The fourth omitted variable is average years of
schooling of the population. US Census Bureau did not have county level data
on education statistics until 2009. The fifth omitted variable is distance from the
core of the city. It is not applicable at county level.
These omitted variables could be a source of bias in regression. Omitted vari-
able bias will occur if these variables are also correlated with at least one of the
included regressors in our model (Stock and Watson, 2003). For example, aver-
9
10. age years of schooling of the population might be correlated with proportion of
youths in the population because the more youths a county has, the less average
years of education people will have. Average sentence lengths is an important
measure of cost of jails and counties that have higher average sentence lengths
may be more willing to adopt Pay-to-Stay. Therefore average sentence lengths
is very likely to be positively correlated to the decision of practicing Pay-to-Stay
policy. Longer average sentence length should be theoretically negatively corre-
lated with crime rate according to Becker’s theory. Therefore, omitting average
sentence length will result in a downward bias in the estimation of b1. Notice
that b1’s significance and sign are all that matter in this model. As long as the
bias does not inverse the sign of b1, the conclusion drawn from the regression
would be reliable. Another way to justify the model is through conditional mean
independence assumption11. If the conditional mean independence assumption
holds, the coefficient on treatment variable, which should be binary variable in-
dicating if the observation is engaged in Pay-to-Stay, would still be unbiased and
the statistical inference on b1 is still reliable. The distinction between treatment
and control variables is captured by conditional mean independence assumption.
Under conditional mean independence assumption, ˆb1 does have a causal inter-
pretation even though the coefficients on control variables do not. A rough test
of conditional mean independence assumption is shown in Appendix12.
Removing the variables that are not applicable on county levels or do not have
reliable data, the following variables were included in the model as regression
controls: arrest ratio, clearance rate, unemployment rate, police force per capita,
population density, percentage of youth in the population, percentage of males
in the population, county type, county location. Table 4 shows all variables in
crime rate model. Each county is indexed by i(1, 2, ..., 11) and each time period is
indexed by t(2000, 2001, ..., 2014). Both indexes were used to keep track of both
the county and the time period.
The regression model of crime rate shows as Formula (2), where bj(j = 1, 2..., 14)
are the coefficients, it is the error term. αi(i = 1, 2..., 11) are the individual fixed
effects, which reflects all the unobserved time-invariant county-specific character-
istics that may be correlated with other regressors (Cornwell & Trumbull 1994).
Yit = αi + b1Xit +
8
j=1
bj+1Wj,it +
5
j=1
bj+9Dj,it + it(2)
The sign of b1 indicates whether Pay-to-Stay increases or decreases crime rates.
11Conditional mean independence assumption requires that the conditional expectation of error term
given all the control variables and treatment variable does not depend on the treatment variable, but it
can depend on control variables.
12The test assumes a linear form of conditional expectation function, which is not necessarily true in
real case. The test results do not necessarily support conditional mean independence assumption if the
function form is wrongly specified, but it provides us a general sense of how the error term is distributed.
10
11. Table 4—Variables in the crime rate model
Variable Explanation
Yit Number of crimes in 1,000 people
Xit Dummy variable, =1 if engaged in Pay-to-Stay practice
W1,it Ratio of arrests to offenses
W2,it Ratio of charges to arrests
W3,it Unemployment rate
W4,it Police force per capita
W5,it Population / County’s area
W6,it Proportion of whites in the population
W7,it Proportion of youths (15-24) in the population
W8,it Proportion of males in the population
D1,it Dummy variable, =1 if the observation is a urban county
D2,it Dummy variable, =1 if the county is in west Michigan
D3,it Dummy variable, =1 of the county is in north Michigan
D4,it Dummy variable, =1 of the county is in central Michigan
D5,it Dummy variable, =1 of the county is in southeast Michigan
The significance on b1 will shows whether the policy’s impact on crime rate is
statistically significant.
Notice that only two counties changed the value of Xit between 2000 and 2014,
which means Xit is almost time-invariant. Therefore, since we are studying the
effect of this treatment, fixed effect is not applicable in our models. But are
we justified to use random effect or pooled OLS to estimate the effect of Pay-
to-Stay? The question need to be answered is whether there is a time-invariant
county-specific factor that affect crime rate and is correlated with the regressors
in Table 4. If there is no such factor, then random effect method will be justified.
Unfortunately there is no clear answer to this question. Former literatures did
not provide possible factors that may invalidate random effect.
B. Incarceration rate model
As we discussed, if Pay-to-Stay increases crime rate, it would probably further
increases jail population and larger jail population may offset the reduction on jail
expenditure per individual. Therefore a jail population model is included in this
article to help us better understand if the conjecture holds. In order to examine
the universal effect of Pay-to-Stay on counties with various population, incarcer-
ation rate instead of jail population is used as dependent variable. Section II has
discussed possible control variables in jail population model. Combining the pos-
sible determinants discussed in Section II and adding location dummy variables
to depict some endogenous geographic differences among counties, variables of
incarceration model are shown in Table 5.
11
12. Table 5—Variables in the incarceration rate model
Variable Explanation
Iit Current year incarceration rate
Xit Dummy variable, =1 if engaged in Pay-to-Stay practice
Z1,it Proportion of youths (15-24) in the population
Z2,it Proportion of males in the population
Z3,it Proportion of blacks in the population
Z4,it Proportion of Hispanics in the population
Z5,it Unemployment rate
Z6,it Crime rate
D1,it Dummy variable, =1 if the county is in west Michigan
D2,it Dummy variable, =1 of the county is in north Michigan
D3,it Dummy variable, =1 of the county is in central Michigan
D4,it Dummy variable, =1 of the county is in southeast Michigan
The regression model of incarceration shows as Formula (3), where bj(1, 2..., 11)
are the coefficients, it is the error term. αi(i = 1, 2..., 11) are the individual fixed
effects.
Iit = αi + b1Xit +
6
j=1
bj+1Zj,it +
4
j=1
bj+7Dj,it + it(3)
Social inequality is removed from the model due to data unavailability. Ideally,
Gini index would capture income inequality and ratio of blacks’ per capita income
to whites’ per capita income would capture racial inequality. But these two
variables do not have data at county level. Past researches have shown social
inequality is a significant determinant of incarceration rate. Racial inequality is
correlated with racial variables in the model and thus may cause omitted variable
bias. I found it hard to explain any possible correlation between a county’s
extent of social inequality and its decision of whether to engage in Pay-to-Stay.
Omitting social inequality may not necessarily make the statistical inference of
b1 unreliable. Another possible source of endogeneity is simultaneous causality.
Not only would Pay-to-Stay affect jail population, the jail population could also
influent a county’s decision in implementing Pay-to-Stay. Counties that have
higher incarceration rate would be more willing to implement the policy. Possible
solution to simultaneous causality is to use instrument variable, which in this case
is very hard to find. An instrument variable should be uncorrelated with the error
term it and highly correlated with Xit.
12
13. C. Jail expenditure model
To estimate Pay-to-Stay’s effect on jail expenditure, we will use the same strat-
egy as in crime rate model. By adopting the model of Taggart (1989), we could
specify the control variables in the jail expenditure model as: jail expenditure
of previous year, government expenditure of previous year and jail population of
previous year.
Table 6—Variables in the jail expenditure model
Variable Explanation
Eit Current year jail expenditure
Xit Dummy variable, =1 if engaged in Pay-to-Stay practice
Ei,t−1 Previous year jail expenditure
Pi,t−1 Previous year government expenditure
Ci,t−1 Previous year jail population
Formula (4) is the jail expenditure regression model, where bj(j = 1, 2, 3, 4) are
the coefficients, αi(i = 1, 2..., 11) are individual fixed effects and it is the error
term.
Eit = αi + b1Xit + b2Ei,t−1 + b3Pi,t−1 + b4Ci,t−1 + it(4)
Endogeneity could occur in the jail expenditure model too. In Taggart’s article,
the model was estimated for each state respectively and therefore each state has
unique set of coefficients. But since we have a spell of only 15 years in the sample,
the sample size is not sufficient to estimate each county respectively. Putting
all observations together creates problems. A pooled time series-cross sectional
approach is best suited to situations in which the number of cases is greater
than the number of time points and breaks down when working with a lagged
endogenous variable in the presence of serial correlation (Pindyck and Rubinfeld,
1998). In our case, we have 11 counties and 15 time points. Since the number of
time points is small, test of serial correlation is not reliable either and therefore we
did not adjust for serial correlation in the estimation of error term. Other issues
may also arise with pooled regression. For instance, each county have different
jail facilities of different standards. Counties with better imprisonment facilities
have endogenously higher fixed cost and higher marginal cost of incarcerating one
more inmate. The most appropriate method should be estimating 11 counties
respectively. But county level jail population data is not available before 1970.
Even if we expand time range to 1970 - 2014 in the jail expenditure model, 45
observations for each county would still not be enough to get reliable statistical
inference on the coefficients. Fixed effect would capture the endogenous difference
in fixed cost but as Xit is almost time-invariant, fixed effect will not give us reliable
13
14. estimation of b1. As in crime rate model, time-invariant county-specific factors
that are correlated with included regressors may invalidate random effect method.
For example, capacity of jail is correlated with jail population. So, random effect
method may not be appropriate in jail expenditure model.
V. Results
Pooled OLS, random effect and fixed effect were used to estimate three models
in Section IV. Since fixed effect almost entirely eliminated the effect of Pay-to-
Stay dummy from the model, it should not be used to test the policy’s impact.
Breusch and Pagan Lagrangian multiplier test for random effects shows that there
is no random individual effect13 (χ2
1 statistics is 0.000 for all three models). The
data does not have enough variance to explore panel structure. Therefore the
conclusions will be drawn from the results of pooled OLS. Time dimension func-
tions as an expansion of sample size. Only the results of pooled OLS are reported
in this section
A. Crime rate model
Regression result is shown in Table 7. White’s heteroskedasticity test shows
existence of heteroskedasticity with a p-value of 0.015 and therefore robust stan-
dard error was used to test significance. The coefficient on Pay-to-Stay dummy
is larger than 0 at a significance level of 1%. Holding other conditions constant,
Pay-to-Stay policy significantly increases crime rate by 1.277, which is nearly a
fourth of standard deviation of crime rate. Given that the overall average crime
rate in the samples is 6.493, Pay-to-Stay’s impact on crime rates is considerably
large.
The sign of unemployment rate, police per capita, proportion of whites, pro-
portion of youths, and proportion of males are different from expected. These
contradictions may be a result of omitted variable bias or simultaneous causality.
The classic simultaneous causality issue between police force and crime rate could
be solved by instrument variables. For simplicity, I still assume conditional mean
independence assumption holds and I will not use instruments in this article. The
estimation and statistical inference on police per capita does not matter for this
research, same idea applies to other possible endogenous control variables.
B. Incarceration rate model
Pooled OLS regression result is shown in Table 8. White’s test shows het-
eroskedasticity with p-value of 0.0045.
The coefficient on Pay-to-Stay dummy is significantly larger than 0. It suggests
that Pay-to-Stay increases incarceration rate. But notice that crime rate does
13See Breusch and Pagan (1980) for details.
14
15. Table 7—Pooled OLS result of crime rate model
Variable Explanation (expected sign) Coefficient
Xit Pay-to-Stay dummy (?) 1.277∗∗∗
(0.308)
W1,it Ratio of arrests to offenses (-) −1.527
(2.850)
W2,it Ratio of charges to arrests (-) −2.388∗∗
(1.051)
W3,it Unemployment rate (+) −.0359
(0.035)
W4,it Police force per capita (-) 4039.129∗∗∗
(1248.829)
W5,it Population density (?) −.0104∗∗∗
(0.001)
W6,it Proportion of whites in the population (-) 18.955∗∗∗
(3.824)
W7,it Proportion of youths (15-24) in the population (+) −31.196∗∗∗
(7.488)
W8,it Proportion of males in the population (+) −6.086
(26.431)
D1,it Urban county dummy (?) 10.523∗∗∗
(0.813)
D2,it Western county dummy (?) 11.357∗∗∗
(1.547)
D3,it Northern county dummy (?) 9.366∗∗∗
(1.547)
D4,it Central county dummy (?) 9.764∗∗∗
(1.301)
D5,it Southeastern county dummy (?) 12.220∗∗∗
(1.202)
Note: Values in parentheses are robust standard errors. Asterisks indicates level of significance: ***=1%
level, **=5% level, *=10% level. Number of observations 150, R2=0.9334.
Source: Table notes environment with optional leadin (Source, in this case).
not have significant influence on incarceration rate. So it contradicts our earlier
hypothesis that Pay-to-Stay affects incarceration through crime rates. This is
might because after jail population reached a jail’s total capacity, Pay-to-Stay
cannot further increase jail population. The capacity of jails is difficult to measure
because even if county jail reached its upper limit of jail population, local courts
can still temporarily send offenders to other correctional facilities. Measuring
the real upper limit of how many inmates a county can hold can face serious
measurement error. The average incarceration rate in the sample is only 93.56,
the fact that Pay-to-Stay significantly increases incarceration rate by 23.27 is
15
16. surprising! Given that incarceration rate is positively correlated with Pay-to-Stay,
the potential simultaneous causality problem discussed in Section 4 could result
in a upward bias in the estimation of the Pay-to-Stay’s effect on incarceration
rate.
Table 8—Pooled OLS results of the incarceration model
Variable Explanation (expected sign) Coefficient
Xit Pay-to-Stay dummy (?) 23.273∗∗
(10.118)
Z1,it Proportion of youths (15-24) in the population (+) −2.066∗∗∗
(87.606)
Z2,it Proportion of males in the population (+) −284.773
(551.328)
Z3,it Proportion of blacks in the population (+) 397.553∗∗∗
(96.619)
Z4,it Proportion of Hispanics in the population (+) −503.355∗∗
(203.626)
Z5,it Unemployment rate (+) 3.947∗∗∗
(1.169)
Z6,it Crime rate (+) −0.806
(0.552)
D1,it Western Michigan dummy (?) 259.232∗∗∗
(23.887)
D2,it Northern Michigan dummy (?) 33.850∗
(22.366)
D3,it Central Michigan dummy (?) 132.202∗∗∗
(20.961)
D4,it Southeastern Michigan dummy (?) 86.162∗∗∗
(18.765)
Note: Values in parentheses are robust standard errors. Asterisks indicates level of significance: ***=1%
level, **=5% level, *=10% level. Number of observations 137, R2=0.8331.
C. Jail expenditure model
The pooled OLS regression result is shown in Table 9. White’s heteroskedas-
ticity test does not reject the null hypothesis of homoskedasticity (p-value=0.99).
Jail expenditure and government expenditure are inflation-adjusted. The coef-
ficient on Pay-to-Stay dummy variable is insignificant. Pay-to-Stay policy does
not have significant effect on county jail expenditure. As conjectured before, if
Pay-to-Stay increased jail population, the total correction expenditure may go up.
But jail population does not significantly affect jail expenditure. So, Pay-to-Stay
16
17. must have affected jail expenditure in some other way. The fact that jail popu-
lation does not significantly affect jail expenditure contradict economic intuition
and it raises doubts on the efficiency of estimation.
Table 9—Pooled OLS results of jail expenditure model
Variable Explanation Coefficient
Xit Pay-to-Stay dummy 3.548
(13.501)
Ei,t−1 Jail expenditure of previous year (in millions) 0.088∗∗∗
(0.030)
Pi,t−1 Government expenditure of previous year (in millions) −0.006∗∗
(0.003)
Ci,t−1 Jail population of previous year 0.023
(0.017)
Note: Values in parentheses are robust standard errors. Asterisks indicates level of significance: ***=1%
level, **=5% level, *=10% level. Number of observations 106, R2=0.0388
The R2 is apparently too small. As suspected, the marginal cost of different jails
may vary from each other. But when adding interaction term of jail population
and county identity binary variables into the model, none of the coefficients on
interaction terms was found significant.
VI. Conclusion
This research shows that when holding other conditions constant, the Pay-to-
Stay policy failed to achieve its two main purposes. First, the policy did not
reduce the overall crime rate. Instead, it significantly increased the crime rate on
a relatively large scale. Controversial as it seems to be, I do believe Pay-to-Stay
may have increased the crime rate by making inmates poorer and more likely
to recidivate after they got released from jails. Following this thought, I want to
further examine Pay-to-Stay’s effect on recidivism rate. Unfortunately, recidivism
data is unavailable so I could not test if this theory holds.
Pay-to-Stay also significantly increases incarceration rate, but not through its
influence on crime rate. The regression result shows that crime rate does not
affect incarceration at any significance level. Another possible reason that Pay-
to-Stay increases incarceration is that in a Pay-to-Stay county, judges may be less
willing to grant probations if he assumes the policy worked well and increased
jails’ willingness to take more imprisonment.
Despite that Pay-to-Stay should reduce the jail expenditure per individual, it
does not significantly reduce the overall jail expenditure. Since most criminals
have been already facing financial problems, jail administrations may not be able
17
18. to collect reimbursement fee from inmates. That is to say, Pay-to-Stay has a
poor implementation effect. During the interviews with the sheriffs in Michigan,
many of them did complain about the difficulty in collecting Pay-to-Stay reim-
bursement fee in real practice. I also conjectured that the rapid growth in jail
population caused by Pay-to-Stay may have offset the reduction in jail expendi-
ture per individual. But the regression result in jail expenditure model shows that
jail population does not significantly affect jail expenditure. Therefore I believe
the inefficiency in reducing jail expenditure is mostly due to failure in collecting
the Pay-to-Stay reimbursement fee from inmates.
Some cases were not taken into account in this article. First, the Michigan state
law allows county jails to charge a fixed amount of reimbursement fee between 0
and 60 dollars. As each county may set their own Pay-to-Stay fee level, the actual
number of Pay-to-Stay fee may have effect on crime rate and jail expenditure.
Charging 5 dollars per day would make it much easier to collect the Pay-to-
Stay fee comparing to charging 50 dollars per day. The Pay-to-Stay fee in most
counties in Michigan is approximately 30 to 40 dollars per day. Second, the
geographical relation between the counties may affect Pay-to-Stay’s outcome. For
example, knowing his county is implementing Pay-to-Stay, a criminal may choose
to conduct crimes in its non Pay-to-Stay neighbour counties and thus increase
the crime rates in non Pay-to-Stay counties. Intuitively, this might not be a
significant effect, so I did not include it in the models.
REFERENCES
Allison, John P. 1972. “Economic factors and the rate of crime.” Land Eco-
nomics, 193–196.
Andolena, Alison Bo. 2010. “Can They Lock You up and Charge You For It:
How Pay-to-Stay Corrections Programs May Provide a Financial Solution for
New York and New Jersey.” Seton Hall Legis. J., 35: 94.
Becker, Gary S. 1974. “Crime and punishment: An economic approach.” In
Essays in the Economics of Crime and Punishment. 1–54. NBER.
Breusch, Trevor Stanley, and Adrian Rodney Pagan. 1980. “The Lagrange
multiplier test and its applications to model specification in econometrics.” The
Review of Economic Studies, 239–253.
Cho, Yong Hyo. 1972. “A multiple regression model for the measurement of
the public policy impact on big city crime.” Policy sciences, 3(4): 435–455.
Eisen, Lauren-Brooke. 2013. “Paying for Your Time: How Charging Inmates
Fees behind Bars May Violate the Excessive Fines Clause.” Loy. J. Pub. Int.
L., 15: 319.
Gershowitz, Adam M. 2008. “Informational Approach to the Mass Imprison-
ment Problem, An.” Ariz. St. LJ, 40: 47.
18
19. Greenberg, David F. 1977. “The dynamics of oscillatory punishment process-
es.” Journal of Criminal Law and Criminology, 643–651.
Jacobs, David, and Jason T Carmichael. 2001. “The politics of punishment
across time and space: A pooled time-series analysis of imprisonment rates.”
Social Forces, 80(1): 61–89.
Jacobs, David, and Ronald E Helms. 1996. “Toward a political model of
incarceration: a time-series examination of multiple explanations for prison
admission rates.” American Journal of Sociology, 323–357.
Jankovic, Ivan. 1977. “Labor market and imprisonment.” Crime and Social
Justice, 17–31.
Meyer, Breed D. 1995. “Natural and quasi-experiments in economics.” Journal
of business & economic statistics, 13(2): 151–161.
Michtom, Joshua. 2003. “Making prisoners pay for their stay: How a popu-
lar correctional program violates the ex post facto clause.” BU Pub. Int. LJ,
13: 187.
Pindyck, Robert S, and Daniel L Rubinfeld. 1998. Econometric models and
economic forecasts. Vol. 4, Irwin/McGraw-Hill Boston.
Press, St. Paul Pioneer. 2003. “Inmates jail fee yields little green for Minn.”
Rawlings, Nate. 2013. “Welcome to Prison. Will You Be Paying Cash or Cred-
it?”
Schmitt, John, Kris Warner, Sarika Gupta, et al. 2010. “The high bud-
getary cost of incarceration.” Washington, DC: Center for Economic and
Policy Research. http://www. cepr. net/documents/publications/incarceration-
2010-06. pdf.
Scott-Hayward, Christine S. 2009. The fiscal crisis in corrections: Rethinking
policies and practices. Vera Institute of Justice.
Stephan, James J. 1999. State prison expenditures. US Department of Justice,
Office of Justice Programs, Bureau of Justice Statistics.
Stock, James H, and Mark W Watson. 2003. Introduction to econometrics.
Vol. 104, Addison Wesley Boston.
Taggart, William A. 1989. “Redefining the power of the federal judiciary: The
impact of court-ordered prison reform on state expenditures for corrections.”
Law and Society Review, 241–271.
Trumbull, William N. 1989. “Estimations of the economic model of crime using
aggregate and individual level data.” Southern Economic Journal, 423–439.
19
20. Western, Bruce, and Becky Pettit. 2010. “Incarceration & social inequality.”
Daedalus, 139(3): 8–19.
Appendix
For crime rate model, specifically, we can assume under conditional mean in-
dependence assumption, the conditional mean of error term on control variables
has the following form:
E( it|Xit, W1,it, ..., W8,it, D1,it, ..., D5,it) = γ0 +
8
j=1
γj+1Wj,it +
5
j=1
γj+9Dj,it + it
(A1)
To roughly test whether conditional mean independence assumption holds, we can
first obtain estimations of E( it|Xit, W1it, ..., W8it, D1it, ..., D5it) by calculating the
predicted residuals, ˆit, of Formula 4.1 and run the following regression.
ˆit = γ0 + γ1Xit +
8
j=1
γj+1Wj,it +
5
j=1
γj+9Dj,it + uit(A2)
Test the null hypothesis that γ1 = 0, if we cannot reject the null hypothesis, then
we can conclude that conditional mean independence assumption holds under
linear function form.
Conducting the above test on all three models in Section IV, it shows the con-
ditional mean independence assumption holds in light of the specific linear form
of conditional mean function. Statistical inference does not reject the hypoth-
esis that γ1 = 0 in three models. But this does not imply conditional mean
assumption holds for other function forms.
20