Download to read offline

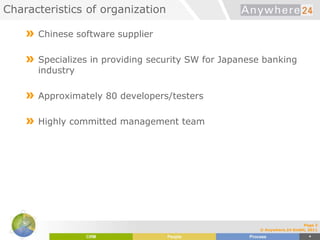
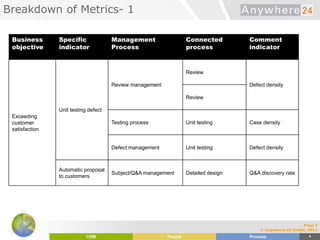
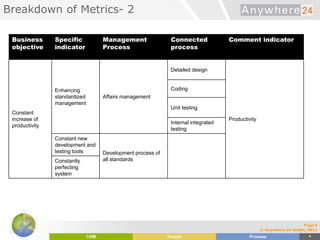
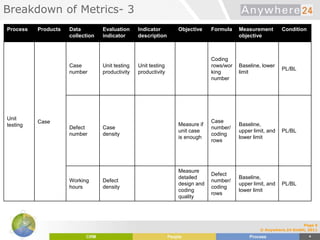
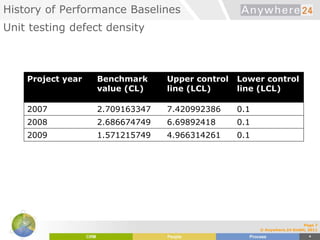
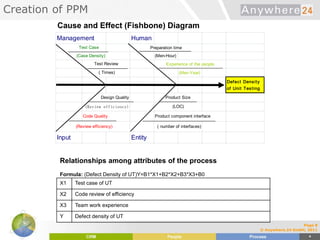
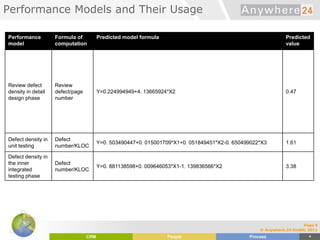


This document discusses the creation and use of a process performance model (PPM) at a Chinese software supplier. It first describes the organization as specializing in security software for banks with 80 employees. It then breaks down the metrics used to measure business objectives and connects processes to specific indicators. The document walks through creating the PPM using cause-and-effect diagrams and relationships between attributes. Finally, it shows how the PPM is used to predict values for defect density in various phases using computed formulas.
![Cmmi%20 model%20changes%20for%20high%20maturity%20v01[1]](https://cdn.slidesharecdn.com/ss_thumbnails/cmmi20model20changes20for20high20maturity20v011-150525024513-lva1-app6892-thumbnail.jpg?width=640&height=640&fit=bounds)
![Cmmi hm 2008 sepg model changes for high maturity 1v01[1]](https://cdn.slidesharecdn.com/ss_thumbnails/cmmihm2008sepgmodelchangesforhighmaturity1v011-150525024656-lva1-app6892-thumbnail.jpg?width=640&height=640&fit=bounds)


![Introduction to bayesian_networks[1]](https://cdn.slidesharecdn.com/ss_thumbnails/introductiontobayesiannetworks1-150525024327-lva1-app6891-thumbnail.jpg?width=640&height=640&fit=bounds)

![Costes produccion olivares aemo[1]](https://cdn.slidesharecdn.com/ss_thumbnails/costesproduccionolivaresaemo1-121116191450-phpapp01-thumbnail.jpg?width=640&height=640&fit=bounds)
![It smf modelo_funcionamiento_g_ts_2012_v3.1[1]](https://cdn.slidesharecdn.com/ss_thumbnails/itsmfmodelofuncionamientogts2012v3-130921221248-phpapp02-thumbnail.jpg?width=640&height=640&fit=bounds)
![Workshop healthy ingredients ppm[1]](https://cdn.slidesharecdn.com/ss_thumbnails/workshophealthy-ingredientsppm1-150525024135-lva1-app6892-thumbnail.jpg?width=640&height=640&fit=bounds)


![Cmmi agile kulpa 2004meas cmmi[1]](https://cdn.slidesharecdn.com/ss_thumbnails/cmmiagilekulpa2004meas-cmmi1-121217135335-phpapp01-thumbnail.jpg?width=640&height=640&fit=bounds)


![Mc anal. riesgos en eval. de proyectos simulacion mc [1]](https://cdn.slidesharecdn.com/ss_thumbnails/mcanal-130921221322-phpapp01-thumbnail.jpg?width=640&height=640&fit=bounds)


