Downloaded 357 times

![Page 6
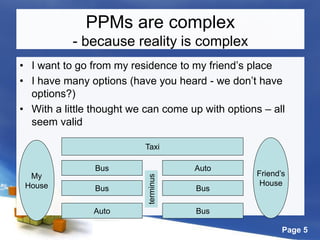
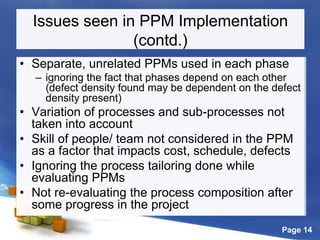
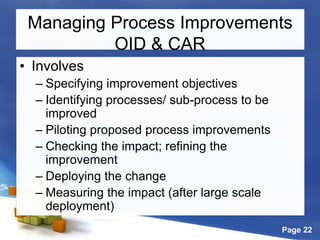
• There are combination of resources that I would
like to optimize
– Energy level (physical, emotional) [Quality]
– Money [Cost/ effort]
– Elapsed time [Schedule]
(some may be more important than others, some may
start pinching when they cross a threshold)
• I may also have constraints on some of the
resources (e.g., I can spend a max of 3 hours
elapsed time; or I don’t want to spend more than
Rs 500 on the journey)
PPMs are complex
- because reality is complex (contd.)](https://image.slidesharecdn.com/hmmisconceptionspitfalls-100718095213-phpapp02/85/CMMI-High-Maturity-Misconceptions-and-Pitfalls-6-320.jpg)
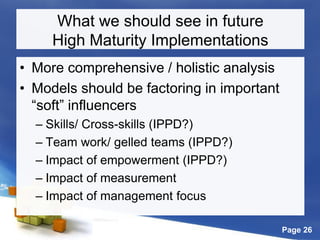


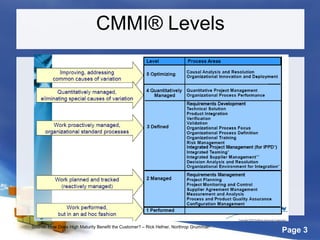
This document discusses high maturity process implementation and common pitfalls. It begins by outlining the agenda, which includes process performance models, sub-process control, managing process improvements, and typical misconceptions and pitfalls. It then discusses how process performance models are complex because reality is complex, and outlines simplifications commonly made. It also notes that outcomes of complex processes are difficult to intuitively predict. The document concludes by identifying common issues seen in implementing high maturity practices and what should be seen in future high maturity implementations to address these issues.


![Cmmi%20 model%20changes%20for%20high%20maturity%20v01[1]](https://cdn.slidesharecdn.com/ss_thumbnails/cmmi20model20changes20for20high20maturity20v011-150525024513-lva1-app6892-thumbnail.jpg?width=640&height=640&fit=bounds)
![Cmmi agile kulpa 2004meas cmmi[1]](https://cdn.slidesharecdn.com/ss_thumbnails/cmmiagilekulpa2004meas-cmmi1-121217135335-phpapp01-thumbnail.jpg?width=640&height=640&fit=bounds)


![Cmmi hm 2008 sepg model changes for high maturity 1v01[1]](https://cdn.slidesharecdn.com/ss_thumbnails/cmmihm2008sepgmodelchangesforhighmaturity1v011-150525024656-lva1-app6892-thumbnail.jpg?width=640&height=640&fit=bounds)


