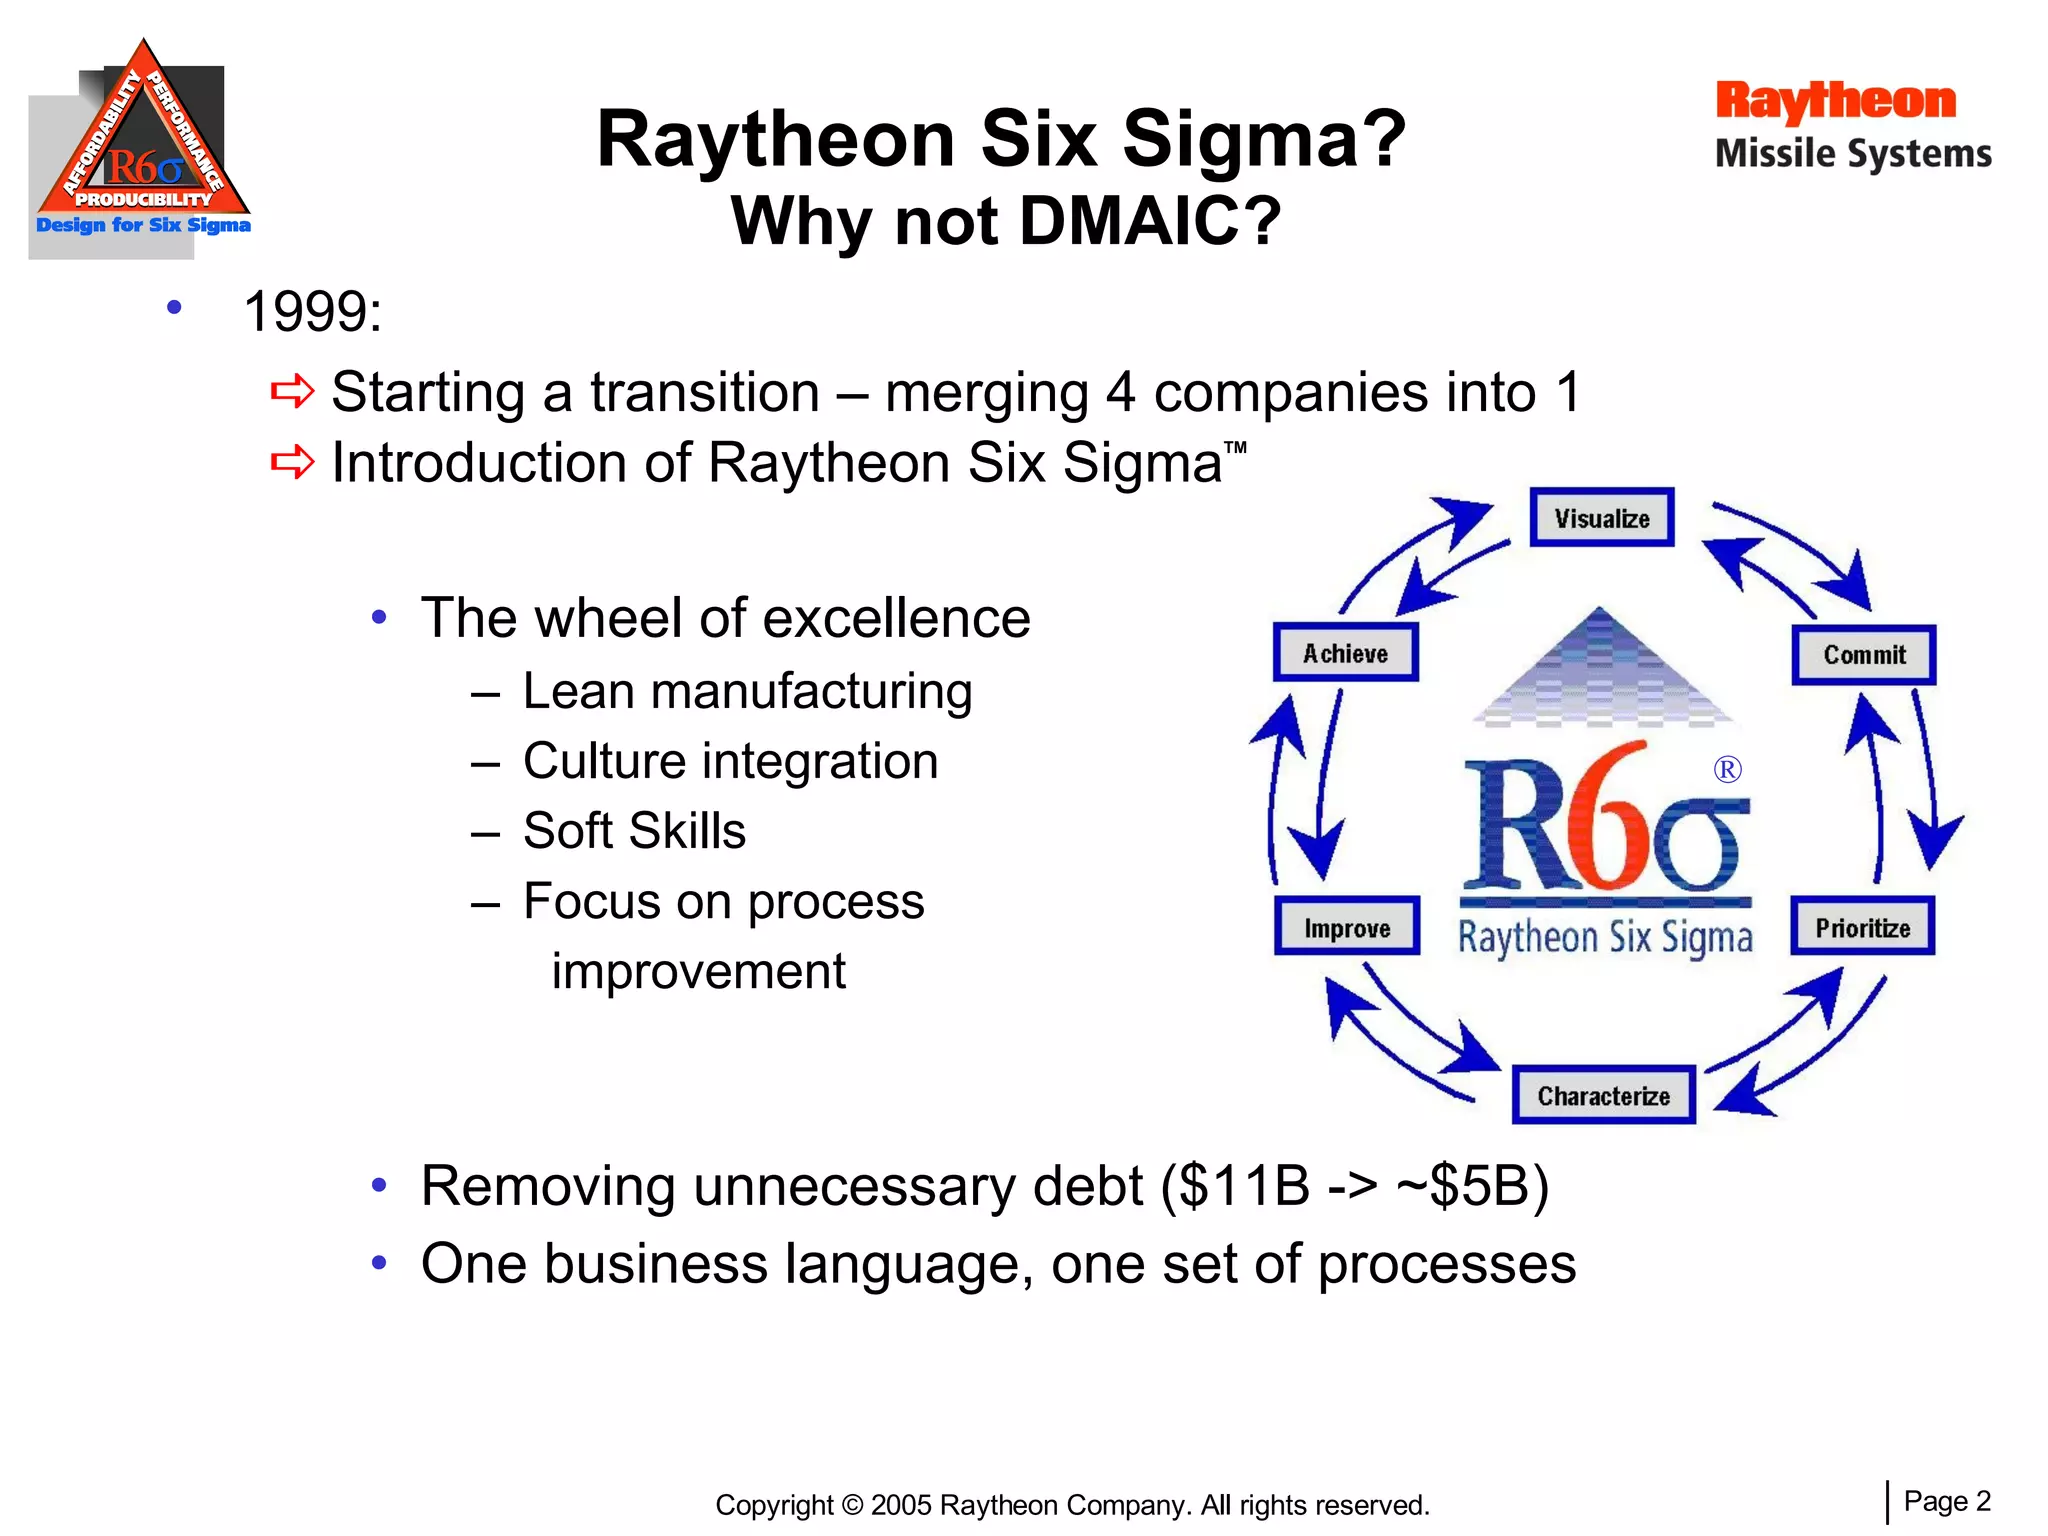
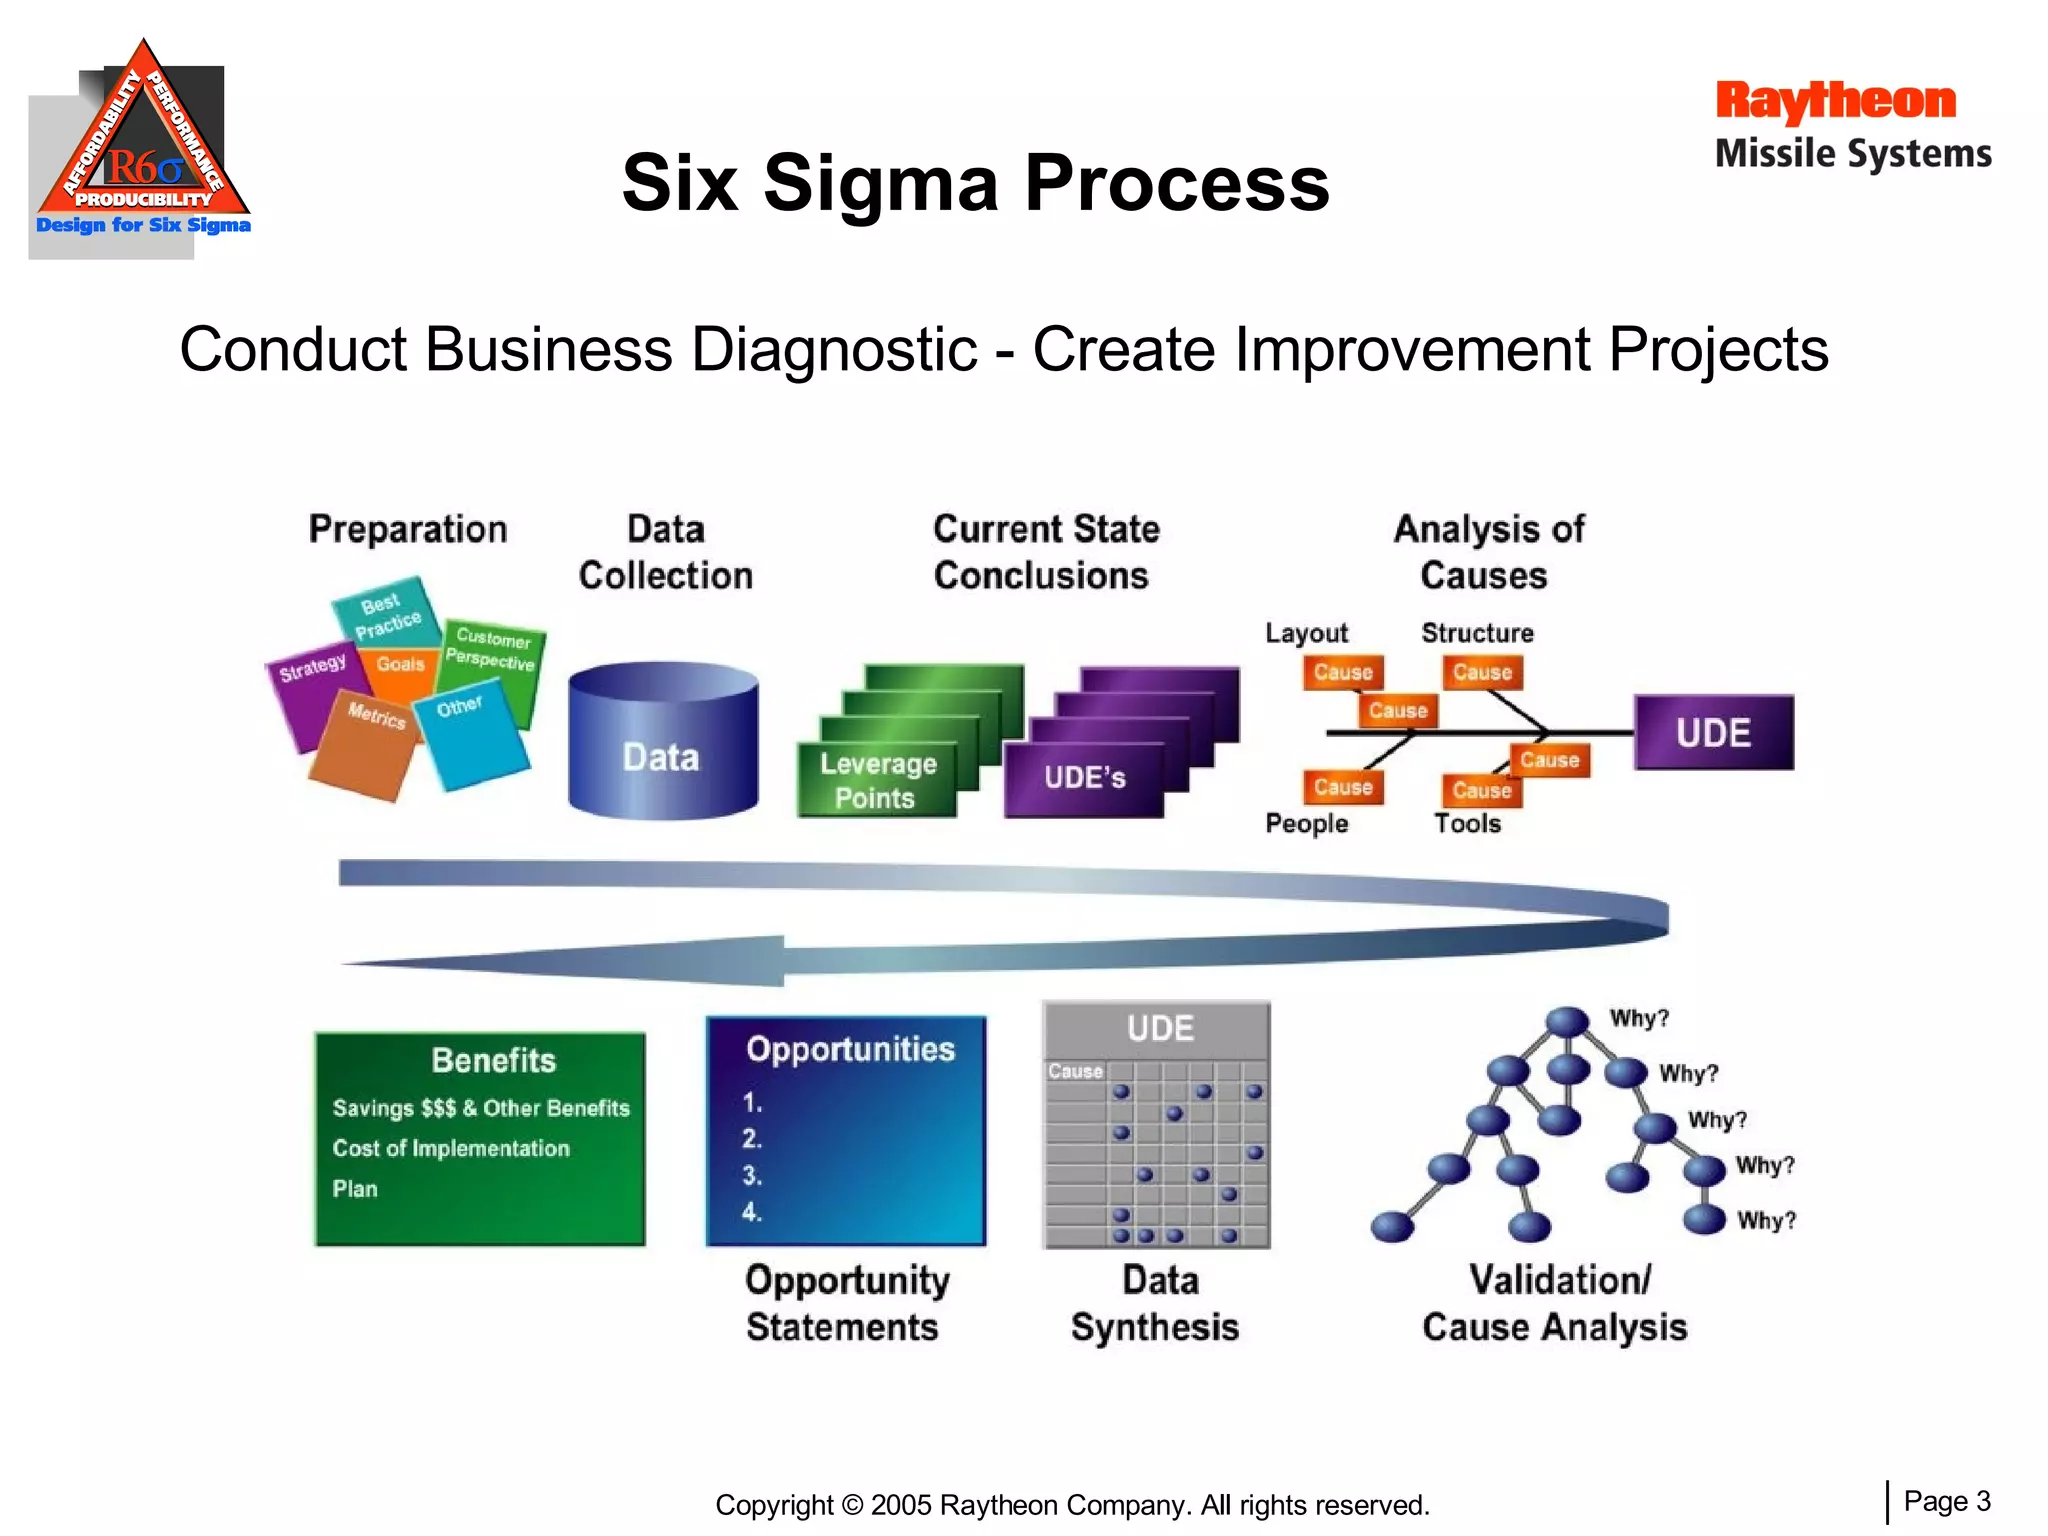
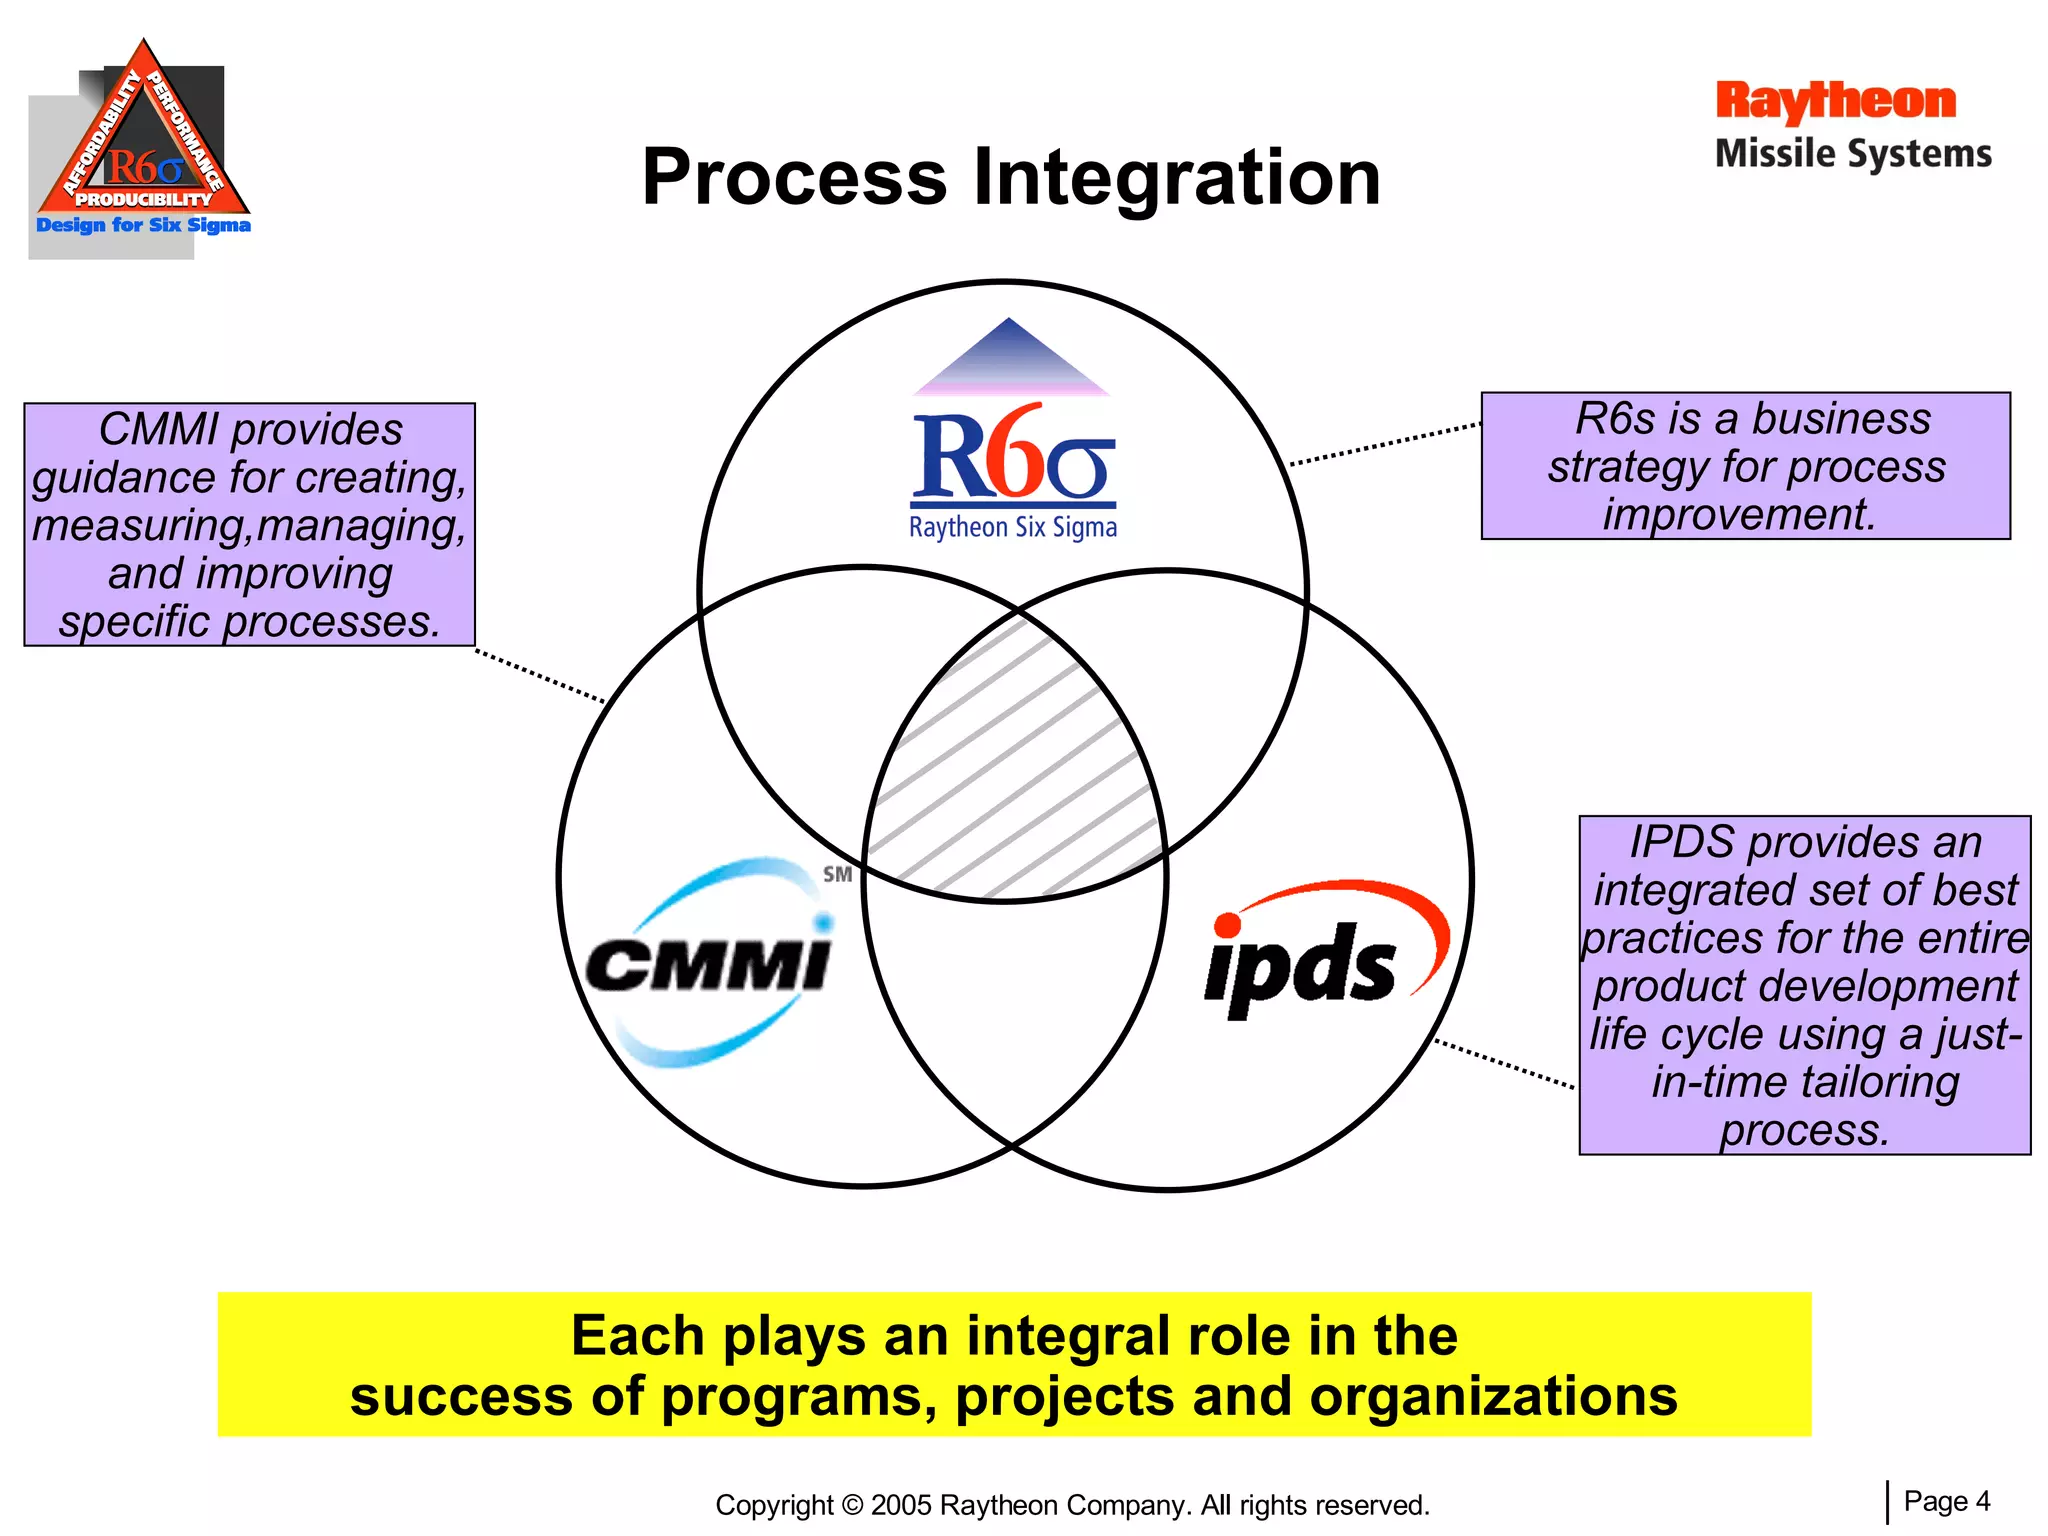
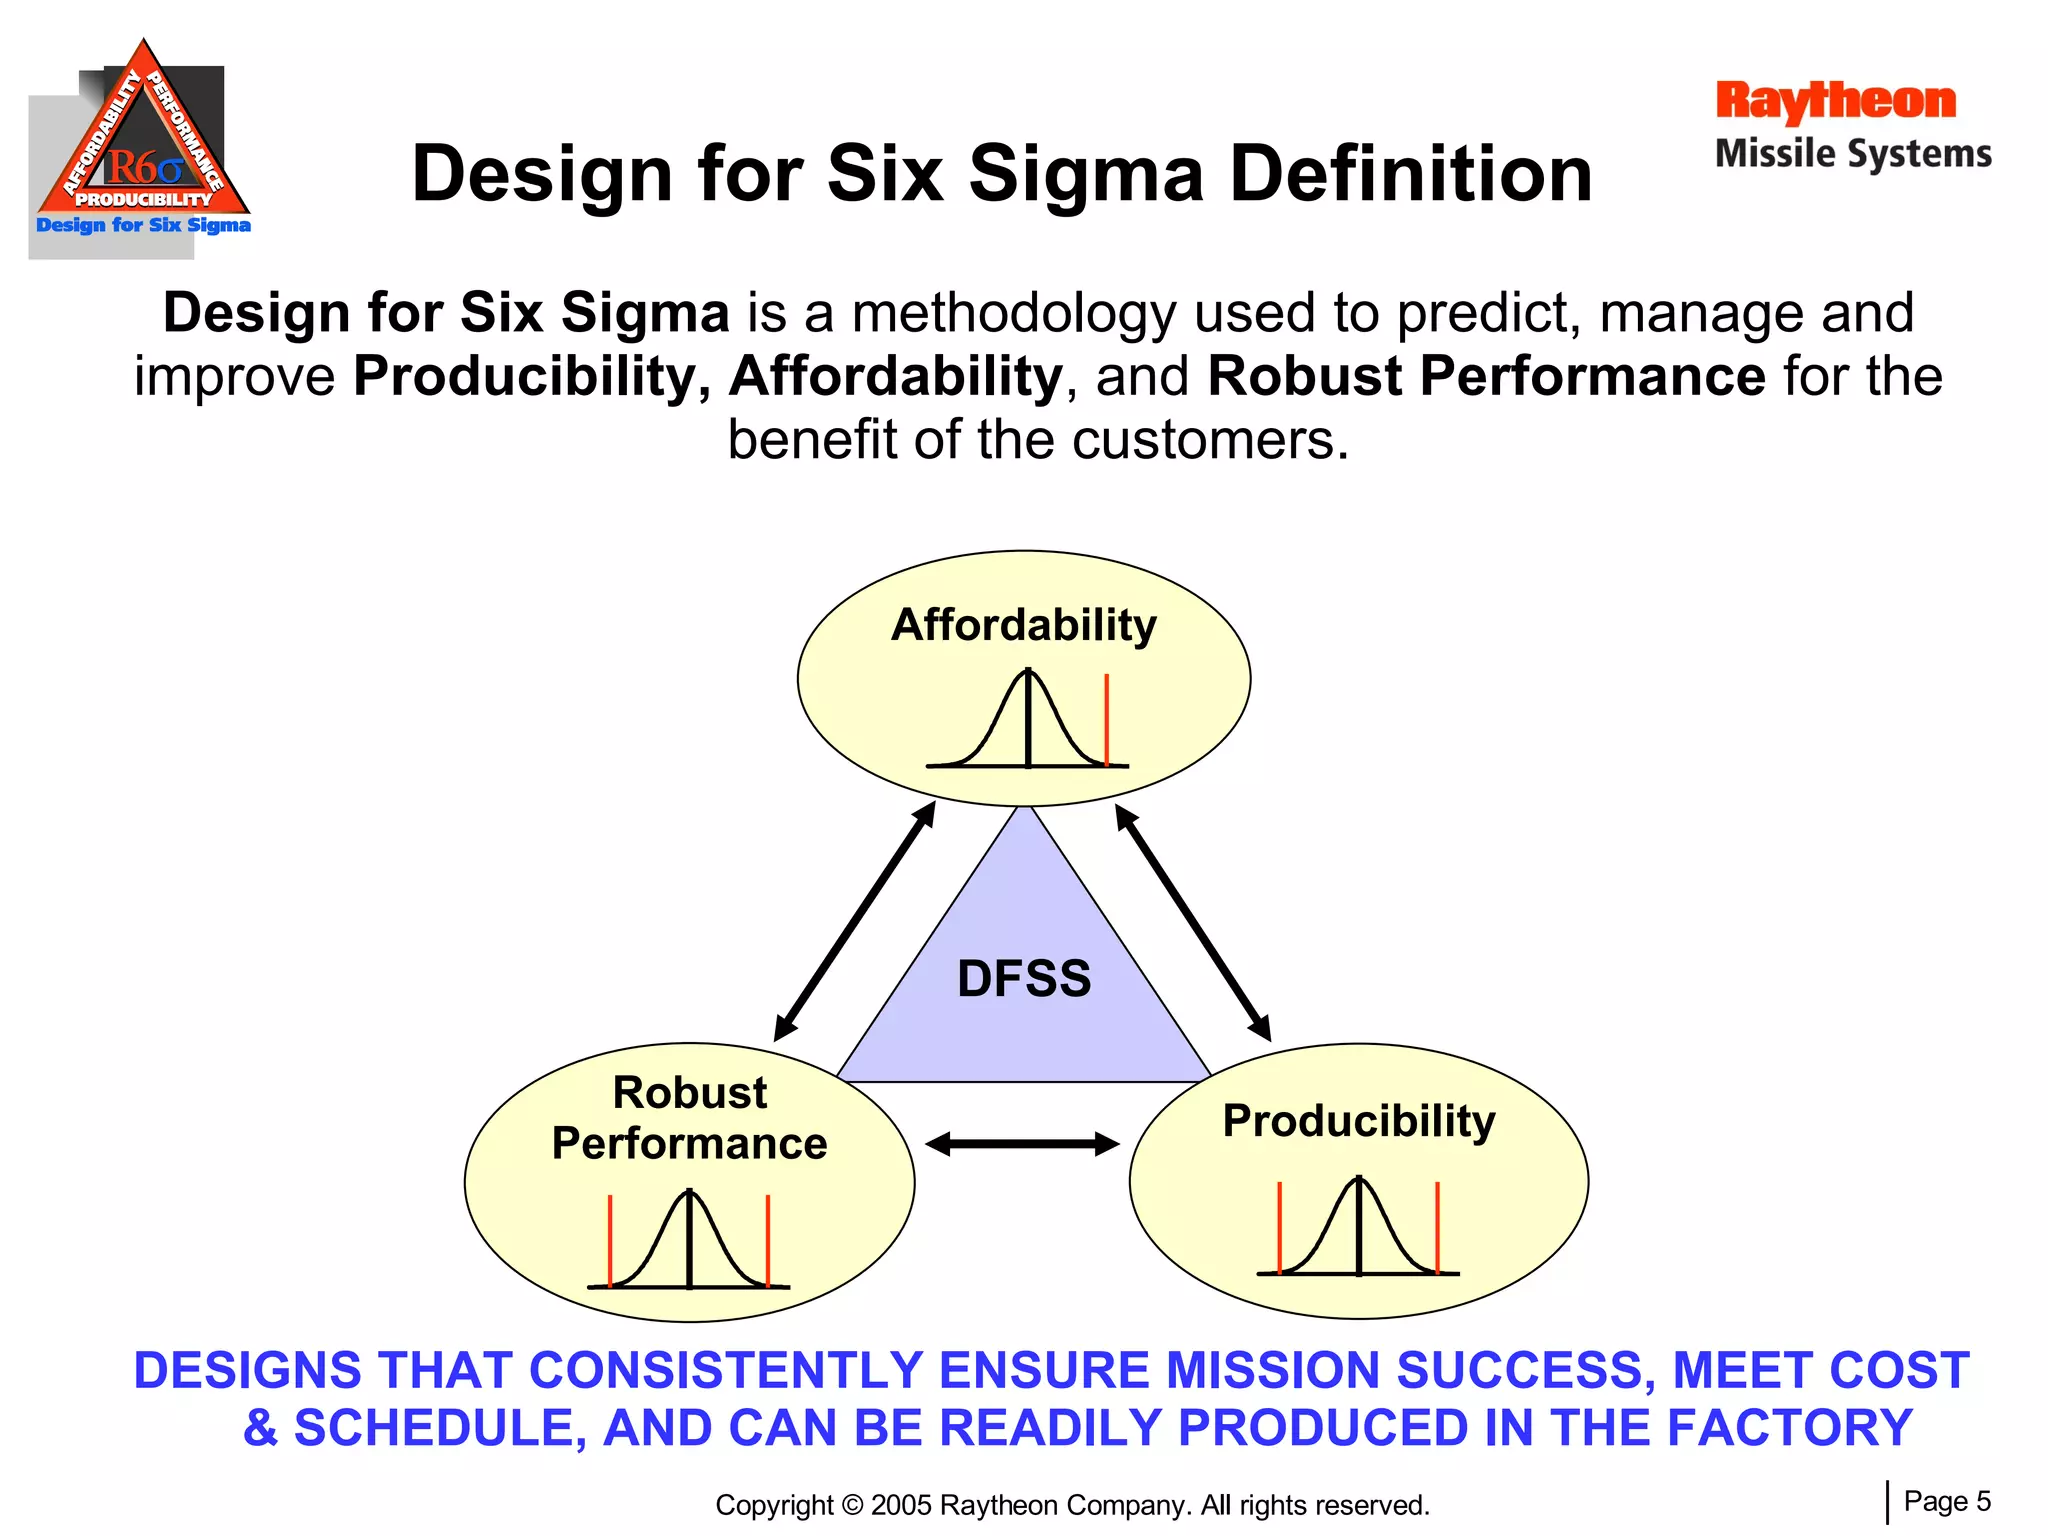
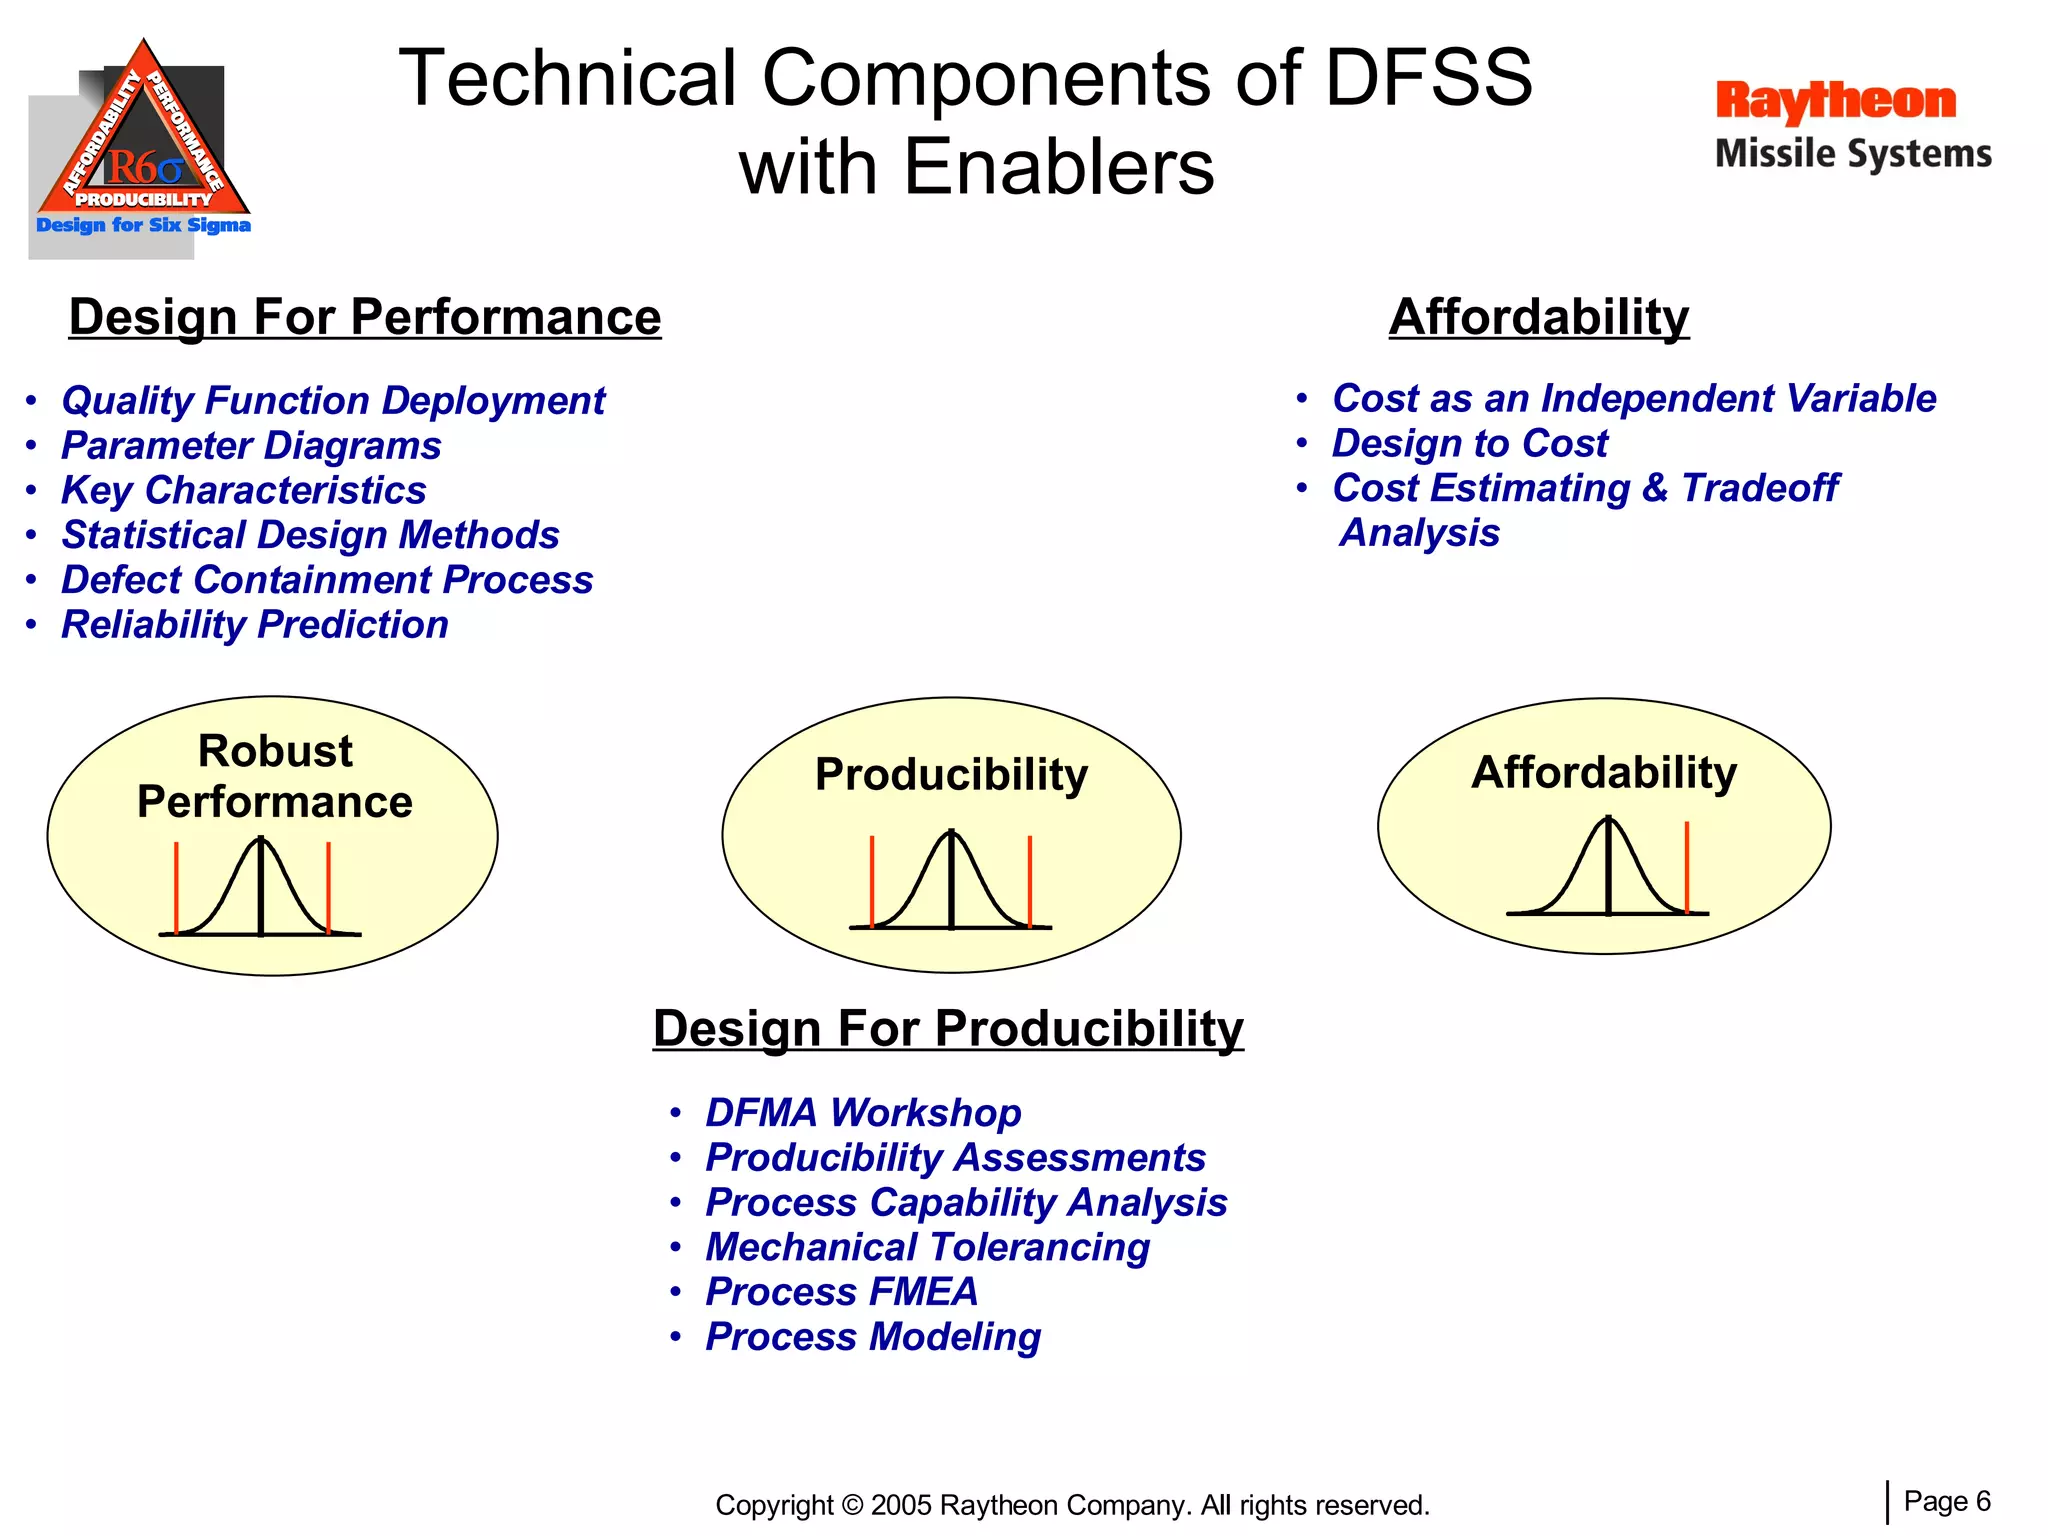
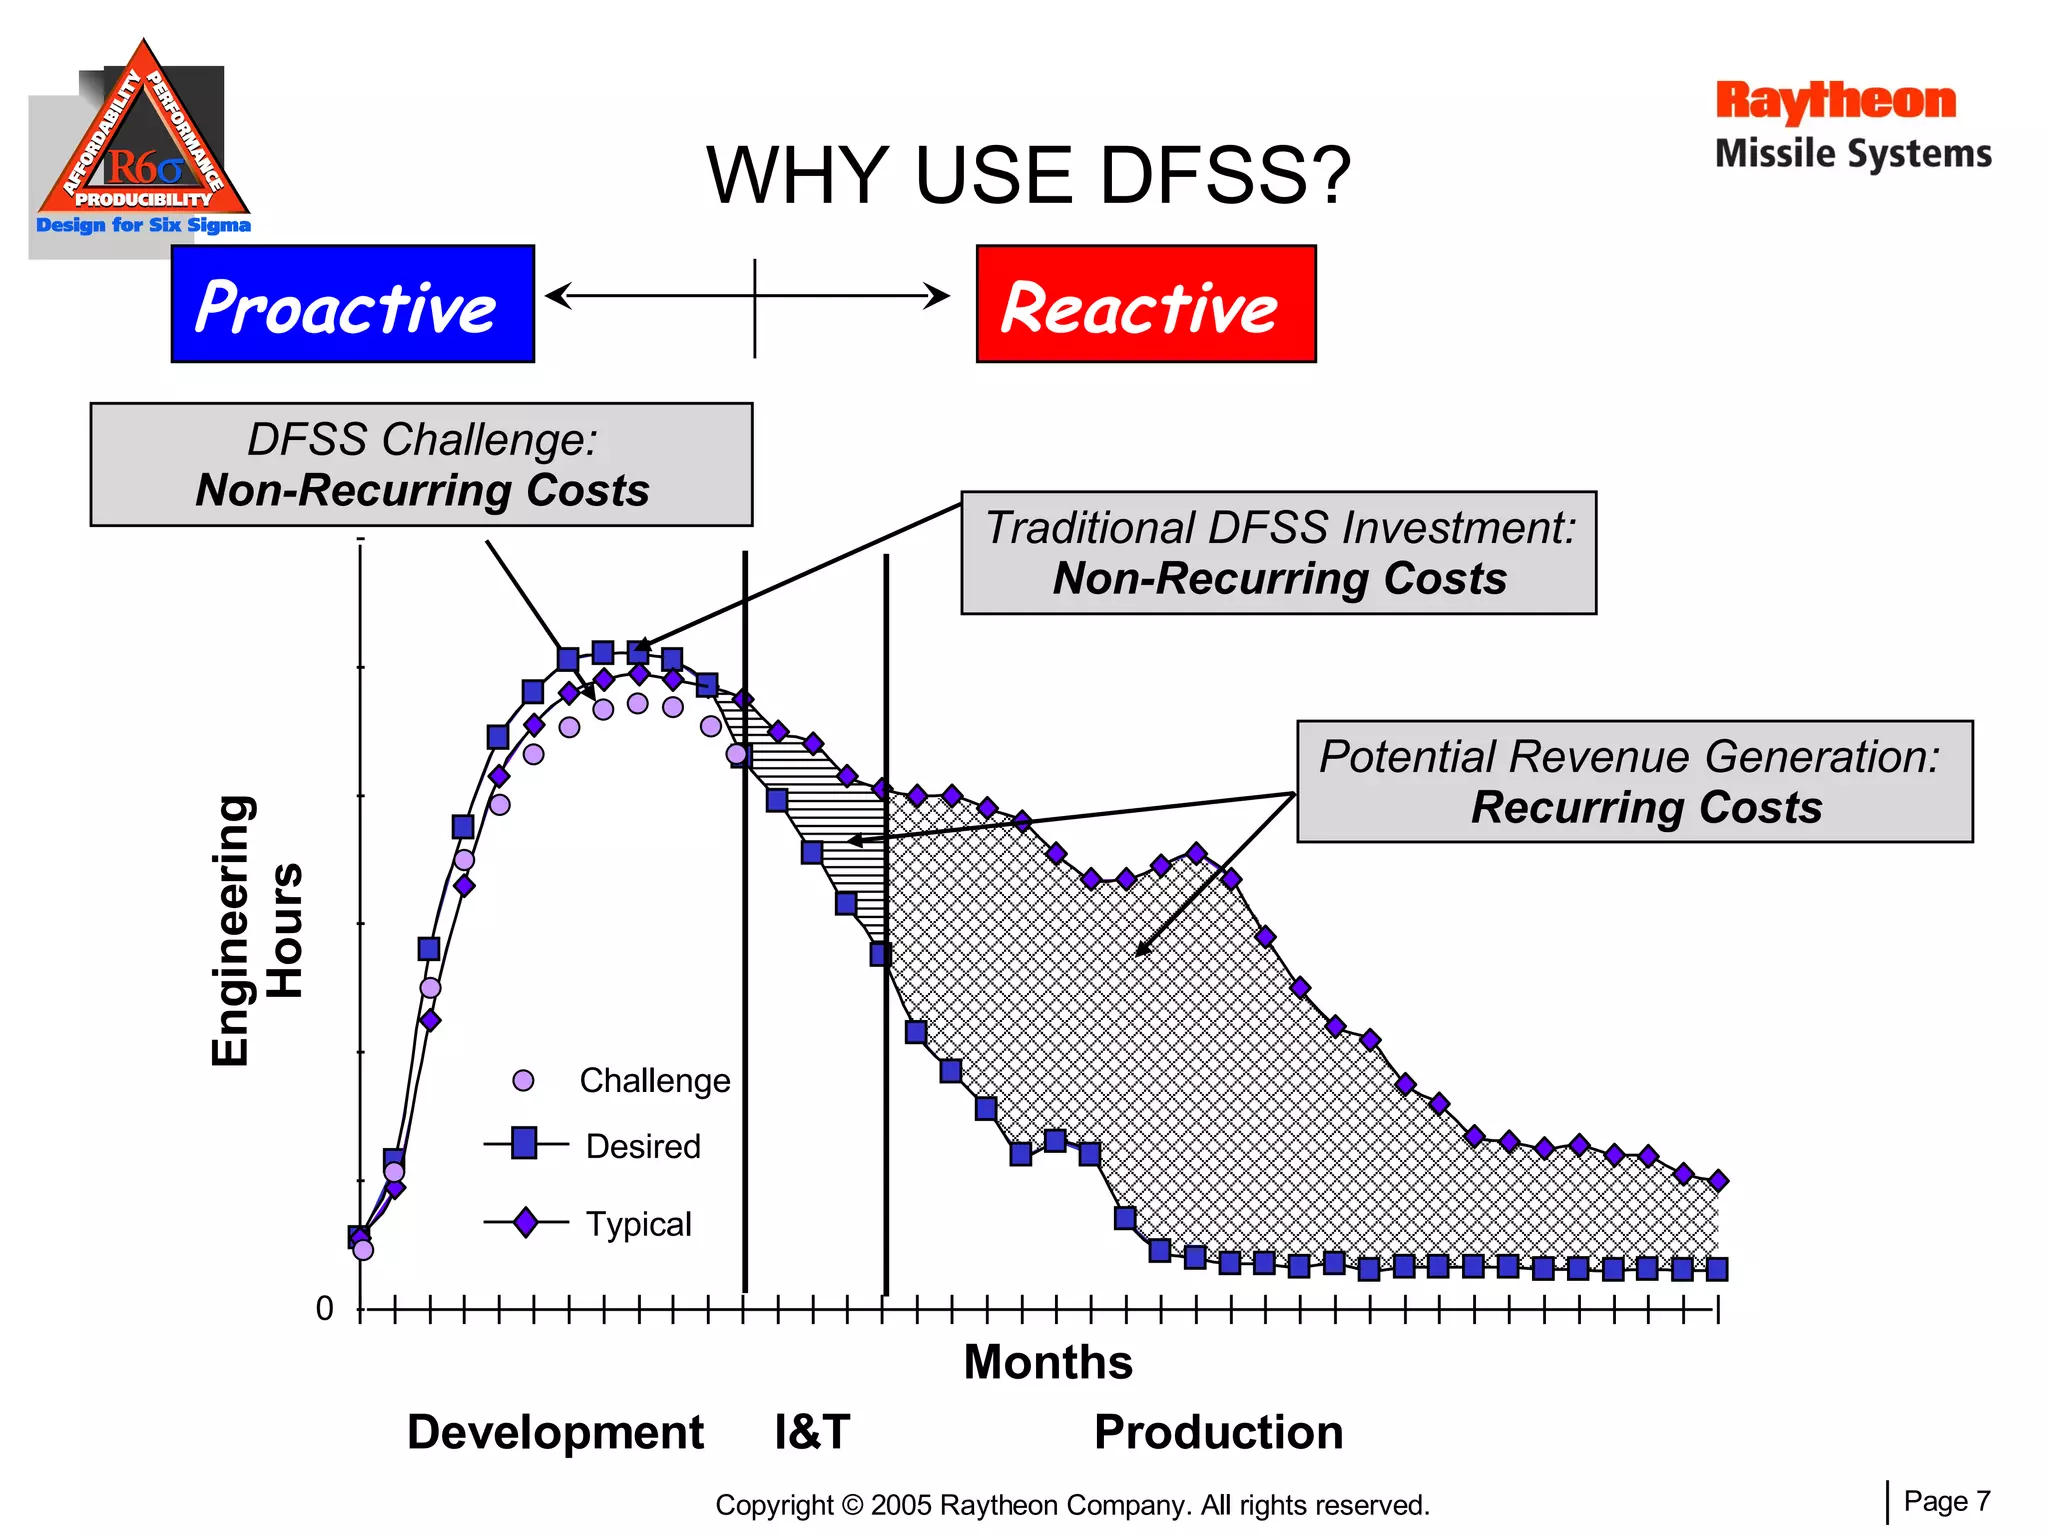
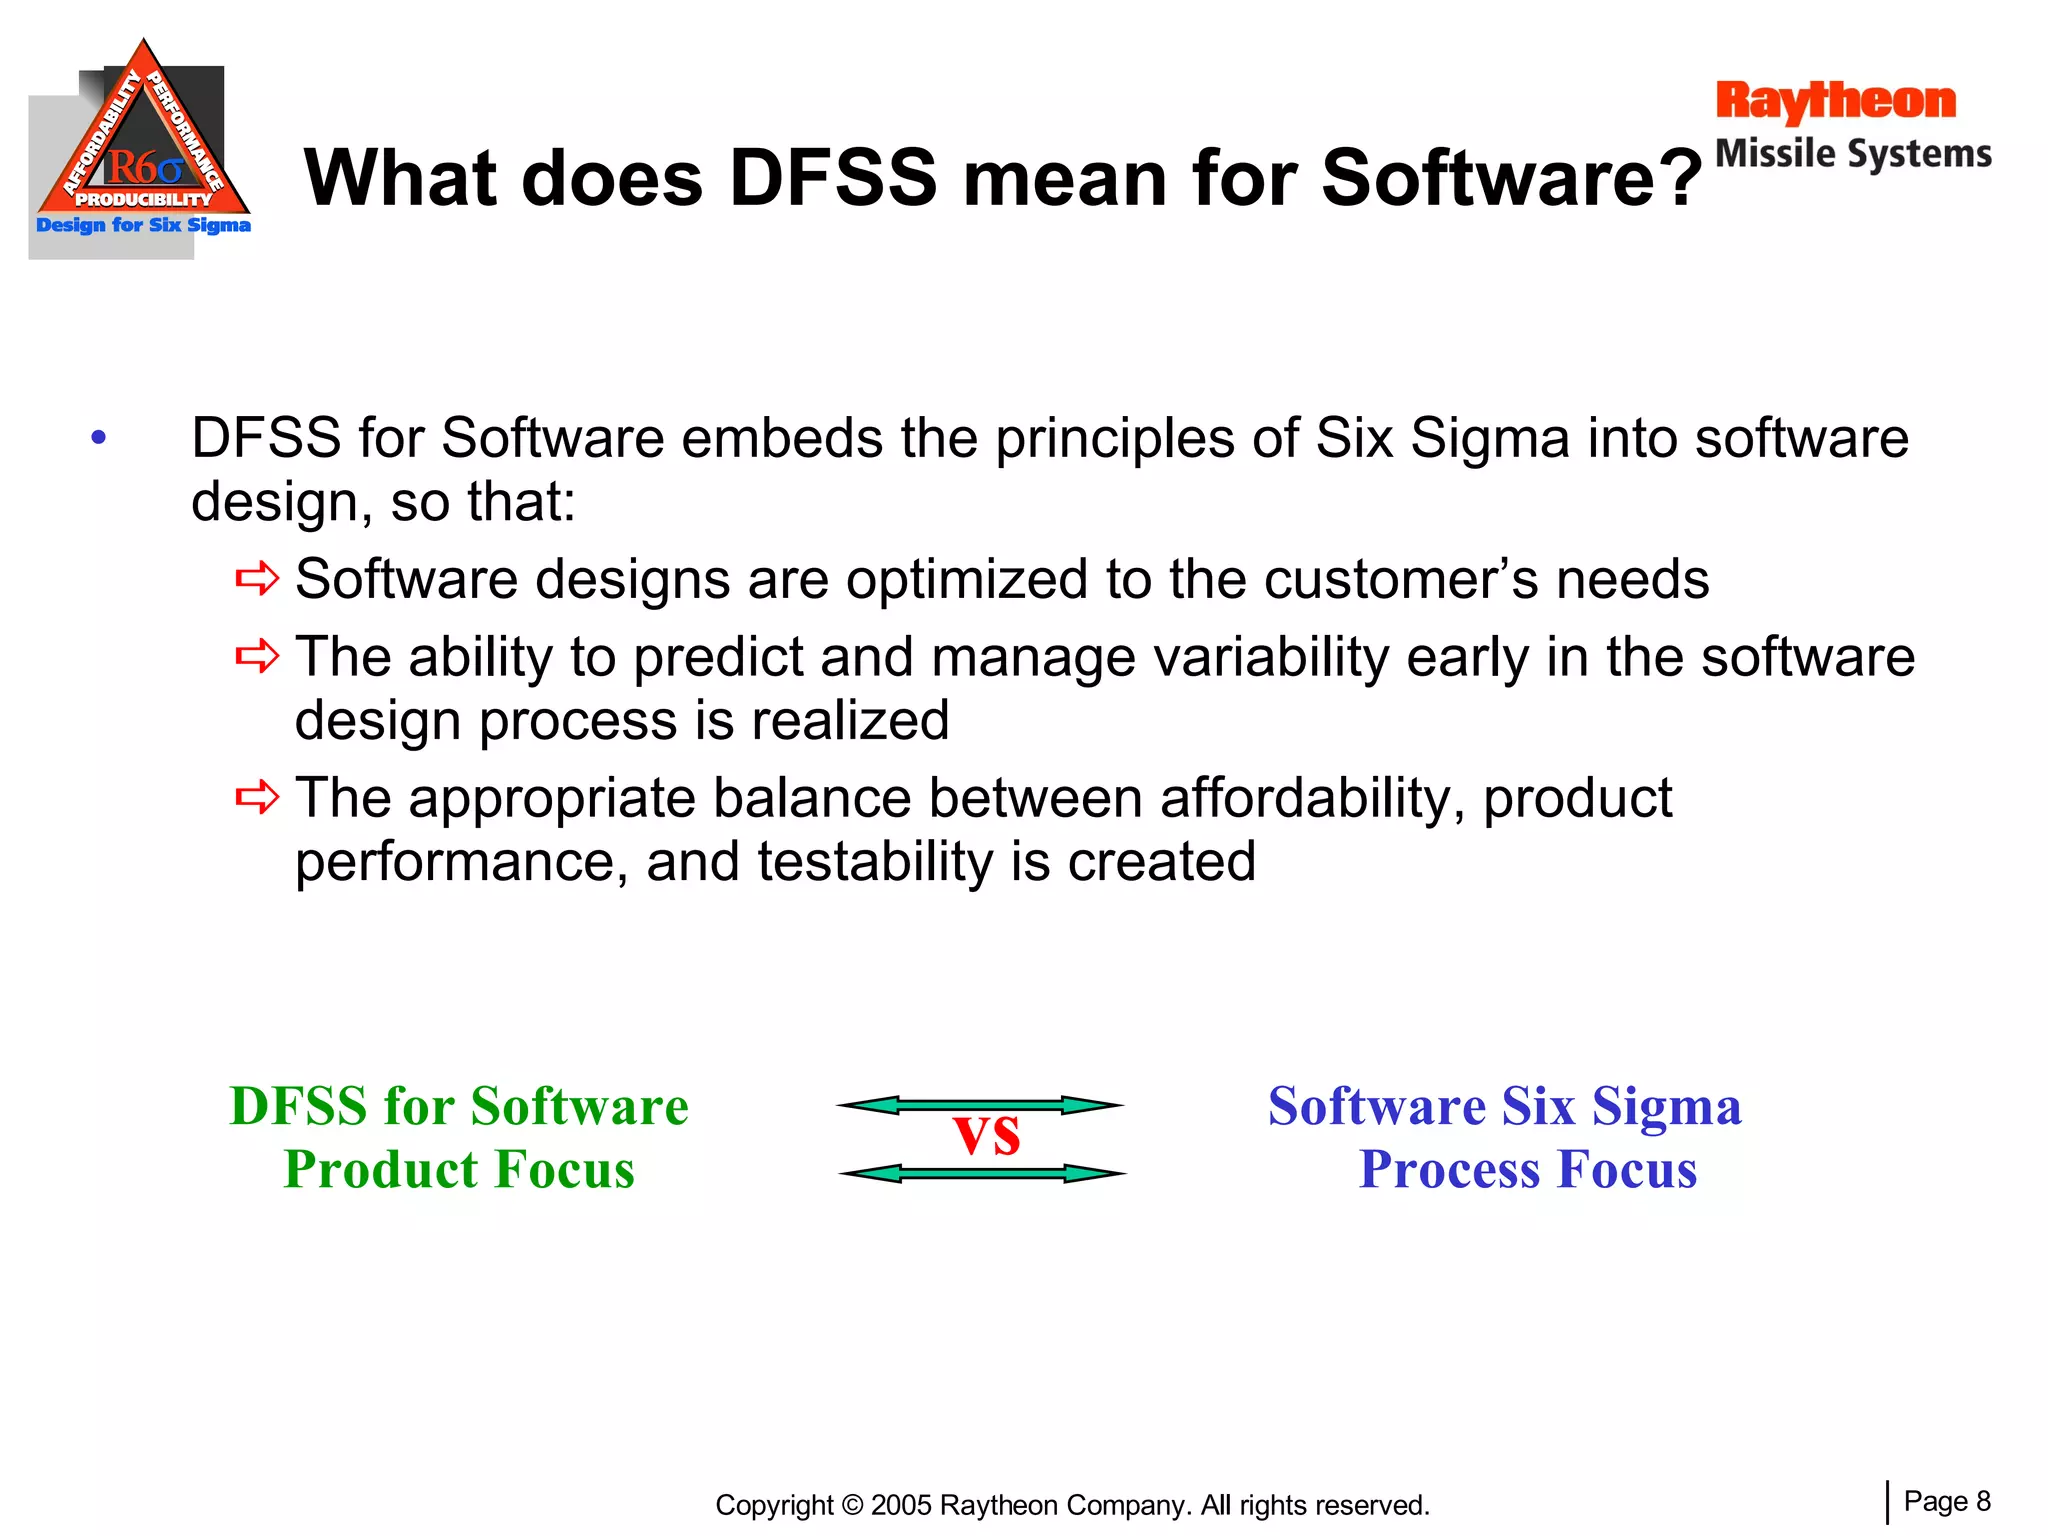
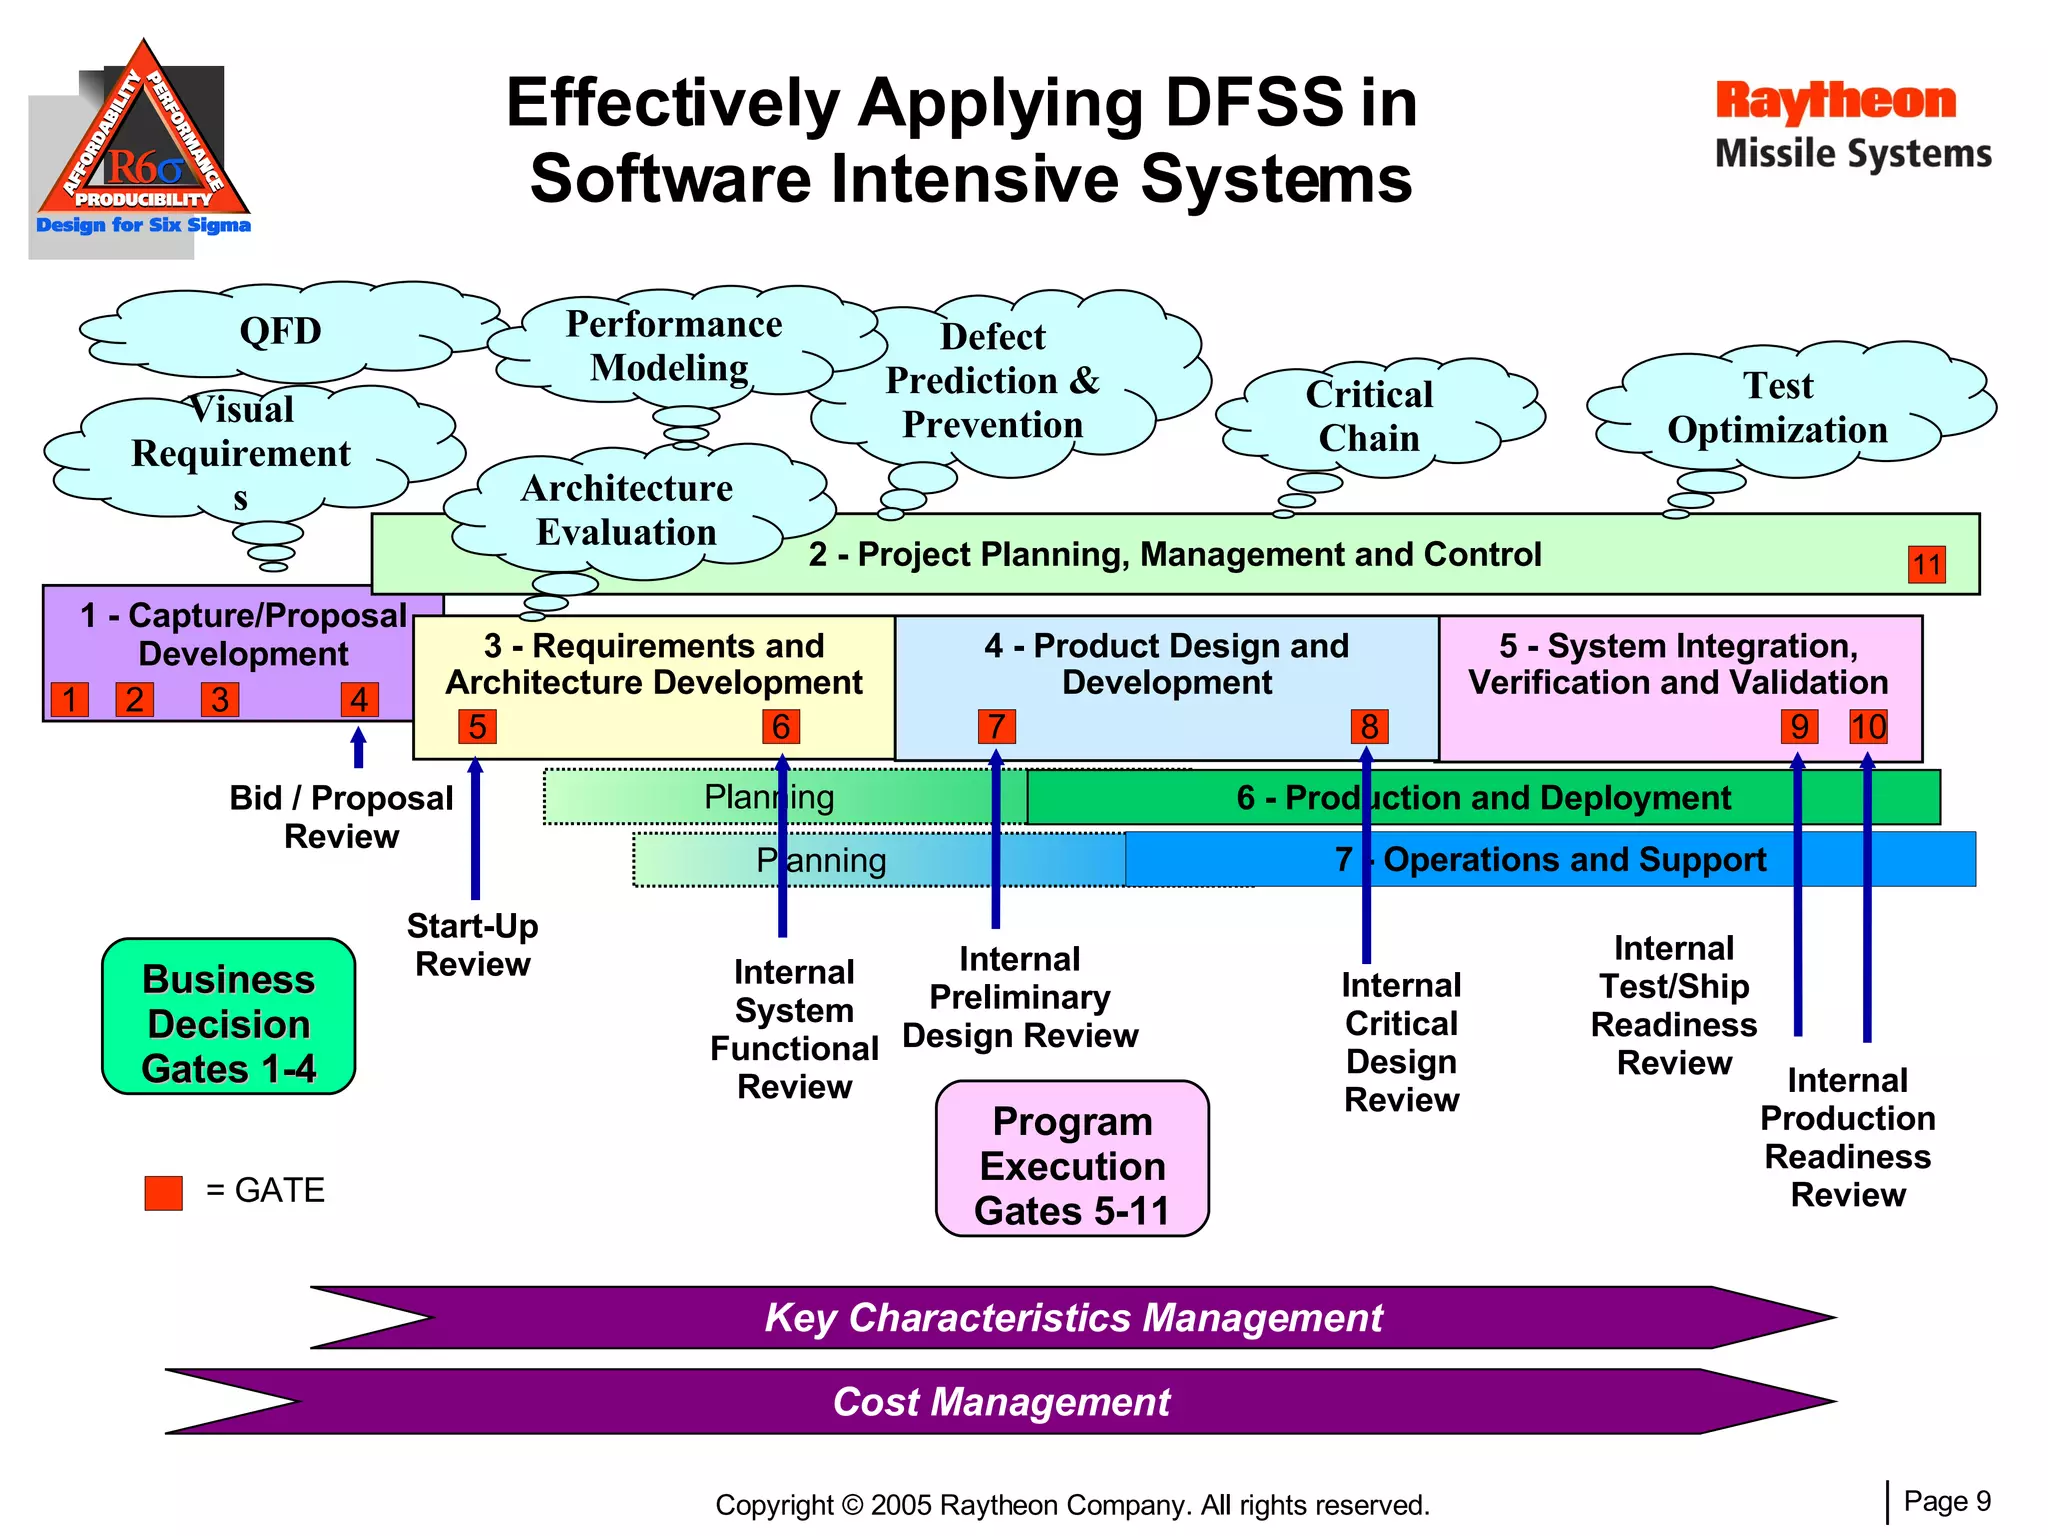
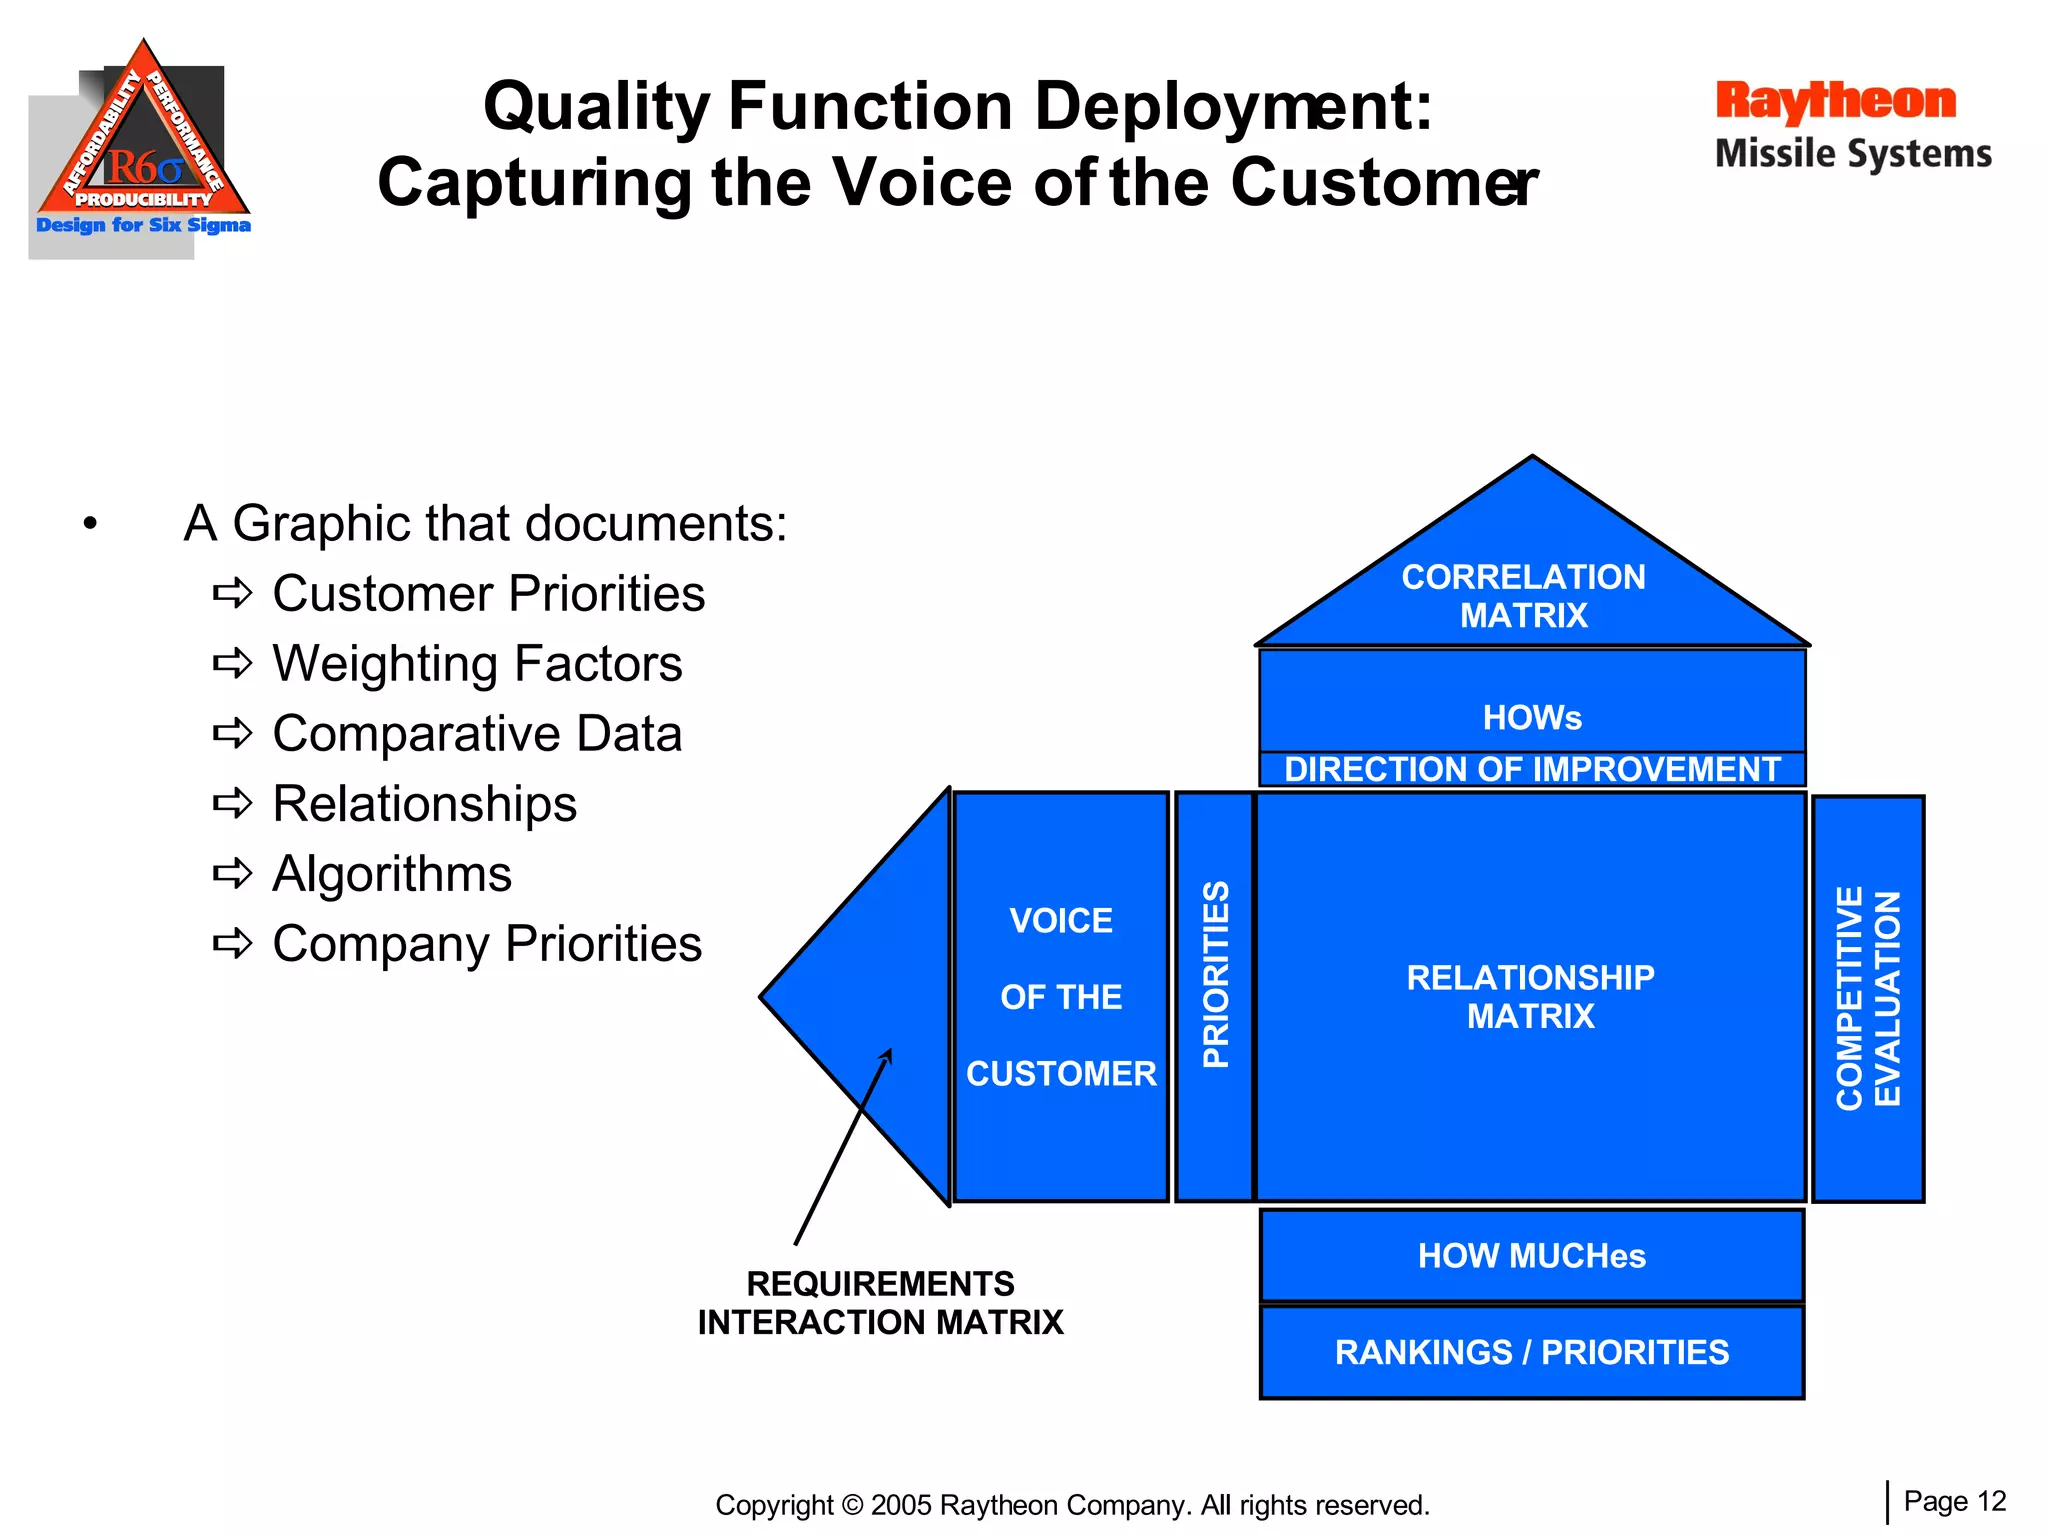
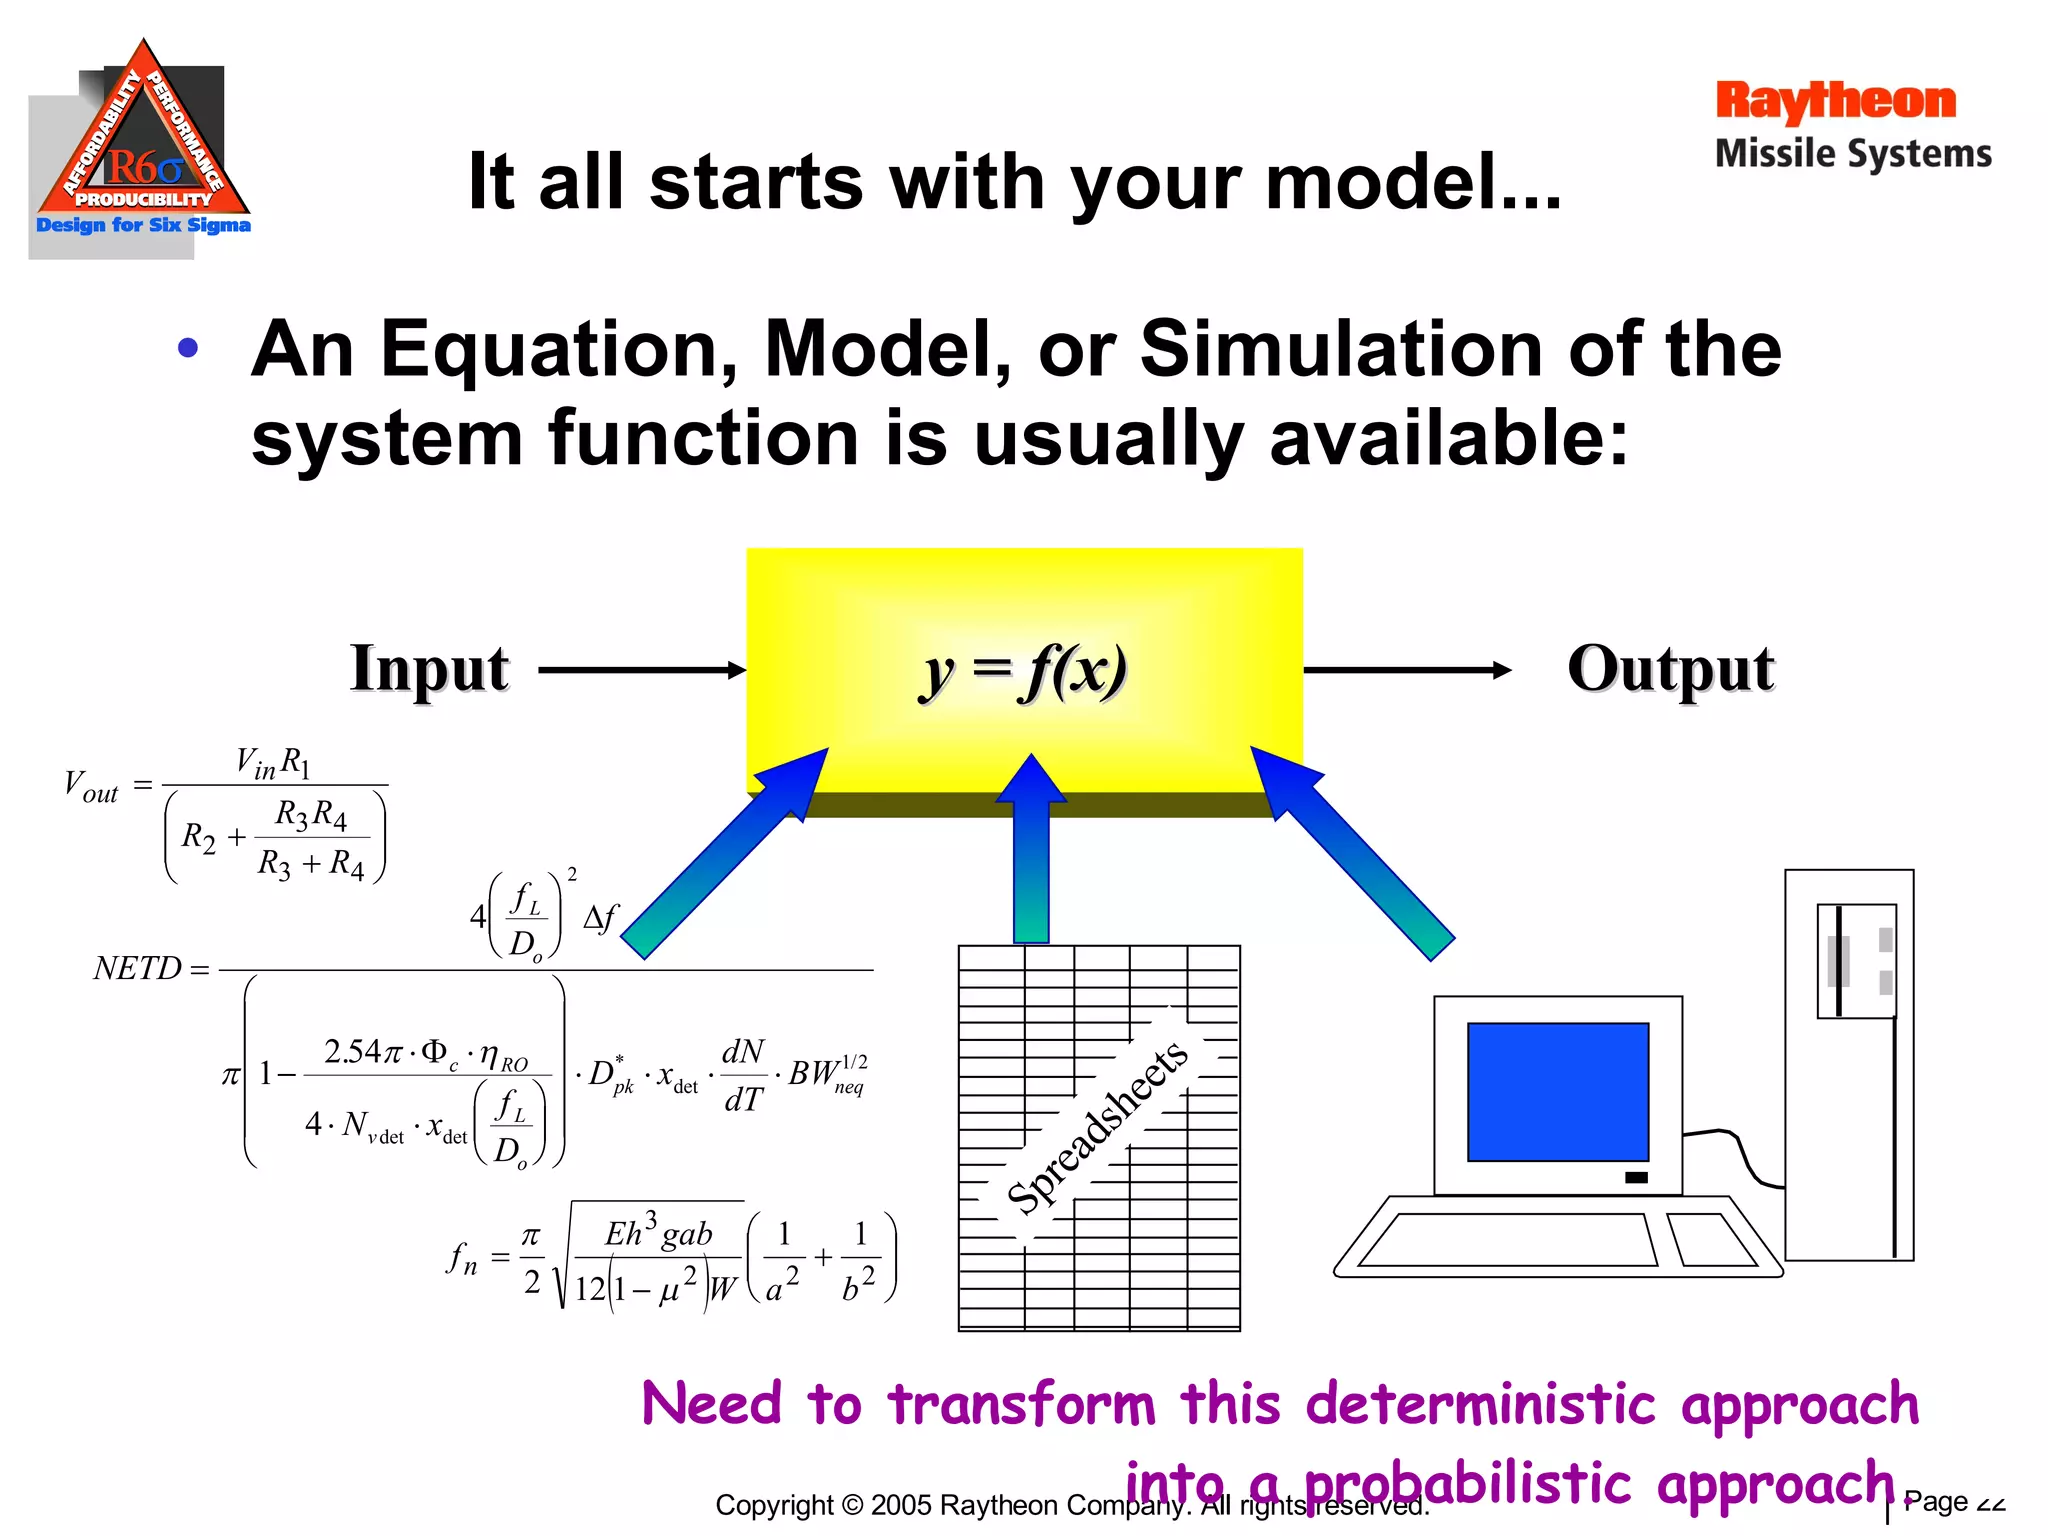
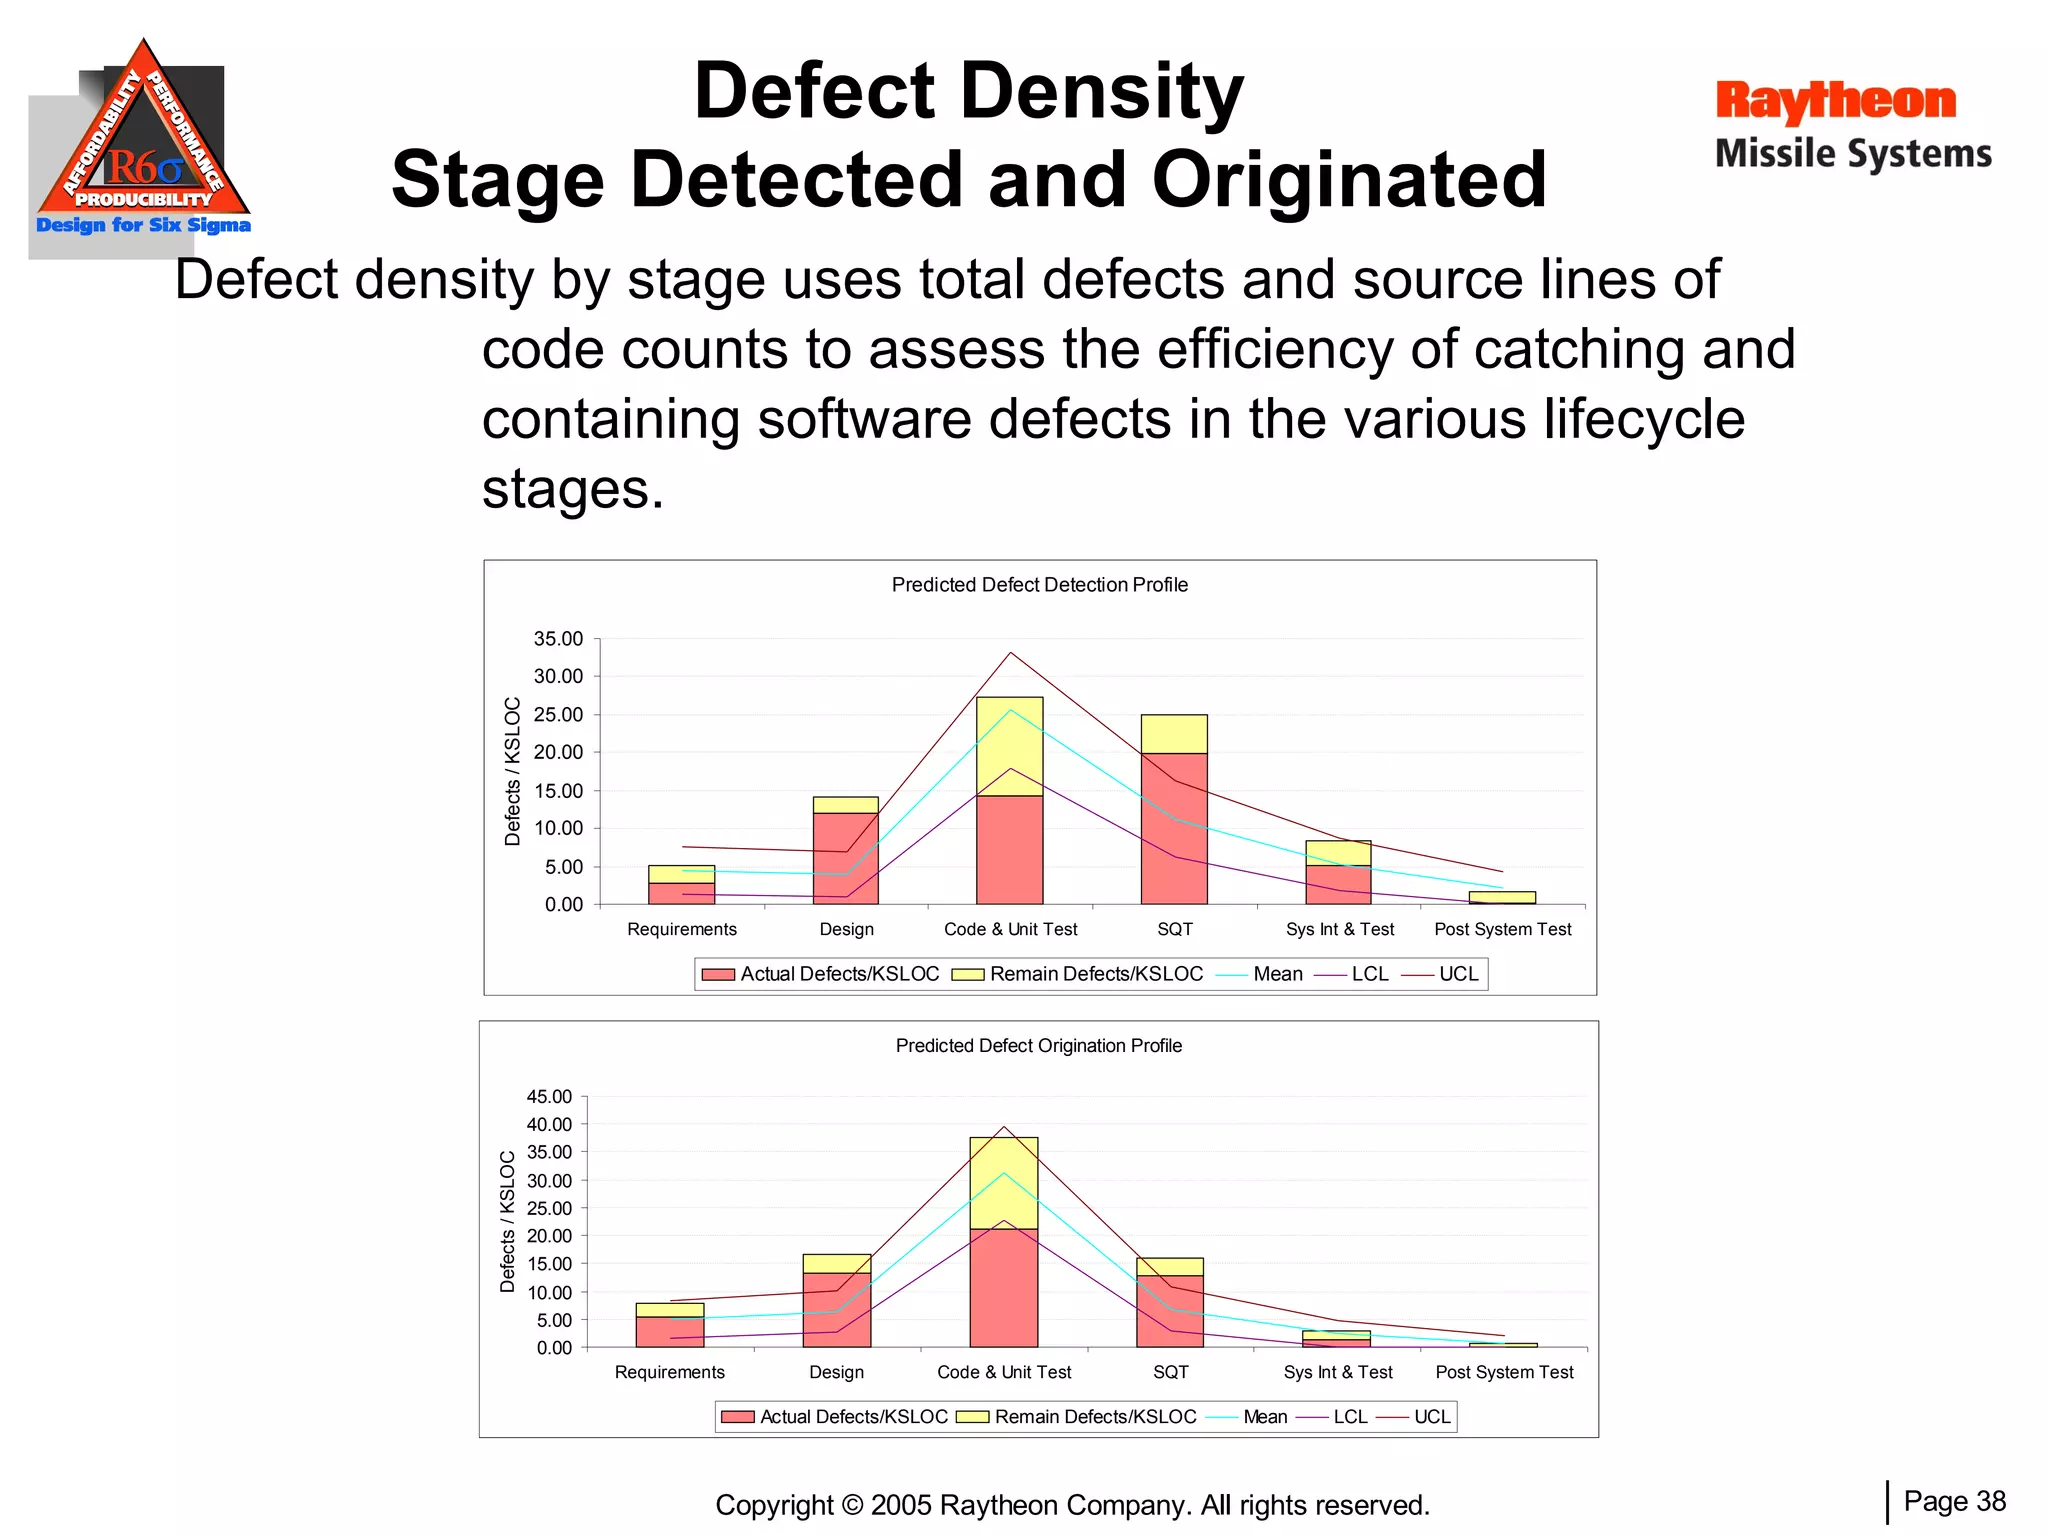
Using Design for Six Sigma to achieve  Lean Software Development at  Raytheon Missile Systems Tony Strickland  Certified Raytheon Six Sigma Expert (520) 794-7855 [email_address] ®
Raytheon Six Sigma? Why not DMAIC? 1999:   Starting a transition – merging 4 companies into 1  Introduction of Raytheon Six Sigma TM The wheel of excellence Lean manufacturing Culture integration Soft Skills Focus on process    improvement Removing unnecessary debt ($11B -> ~$5B) One business language, one set of processes ®
Six Sigma Process Conduct Business Diagnostic - Create Improvement Projects
Process Integration IPDS provides an integrated set of best practices for the entire product development life cycle using a just-in-time tailoring process. R6s is a business strategy for process improvement.  CMMI provides guidance for creating, measuring,managing, and improving specific processes. Each plays an integral role in the success of programs, projects and organizations
DFSS Design for Six Sigma  is a methodology used to predict, manage and improve  Producibility, Affordability , and  Robust Performance  for the benefit of the customers. DESIGNS THAT CONSISTENTLY ENSURE MISSION SUCCESS, MEET COST & SCHEDULE, AND CAN BE READILY PRODUCED IN THE FACTORY Design for Six Sigma Definition Affordability Producibility Robust Performance
Technical Components of DFSS  with Enablers Cost as an Independent Variable Design to Cost Cost Estimating & Tradeoff    Analysis Affordability Affordability Quality Function Deployment Parameter Diagrams Key Characteristics Statistical Design Methods Defect Containment Process Reliability Prediction Design For Performance Robust Performance DFMA Workshop Producibility Assessments Process Capability Analysis Mechanical Tolerancing Process FMEA Process Modeling Design For Producibility Producibility
Traditional DFSS Investment: Non-Recurring Costs Engineering Hours 0 Months Desired Typical Development I&T Production WHY USE DFSS? Reactive   Proactive   Challenge DFSS Challenge: Non-Recurring Costs Potential Revenue Generation:  Recurring Costs
What does DFSS mean for Software? DFSS for Software embeds the principles of Six Sigma into software design, so that: Software designs are optimized to the cu stomer’s needs The ability to predict and manage variability early in the software design process is realized The appropriate balance between affordability, product performance, and  testabili ty is create d DFSS for Software Product Focus Software Six Sigma Process Focus vs
Effectively Applying DFSS in  Software Intensive Systems Program Execution Gates 5-11 Business Decision Gates 1-4 5 - System Integration, Verification and Validation 4 - Product Design and Development 1 - Capture/Proposal Development 7 8 10 9 = GATE Internal Preliminary Design Review Start-Up Review Internal System Functional Review Internal Critical Design Review Internal Test/Ship Readiness Review Internal Production Readiness Review Key Characteristics Management Cost Management 2 - Project Planning, Management and Control 1 2 3 4 Bid / Proposal Review 11 Test Optimization Architecture Evaluation QFD Visual Requirements Critical Chain Defect Prediction & Prevention Performance Modeling    Planning 6 - Production and Deployment Planning 7 - Operations and Support 3 - Requirements and Architecture Development 5 6
Implementation Strategy Embed DFSS into the Software Directive System   (t he softw are engineering segment of IPDS)   for the following activities: Business Development & Proposals Software Project Management Software Architecture Software Requirements Software Design Software Test
DFSS in the  Software Engineering Center Business Development & Proposals Software Project Management Software Architecture Software Requirements Software Design Software Test Knowing the Customer’s Needs
Quality Function Deployment: Capturing the Voice of the Customer A Graphic that documents: Customer Priorities Weighting Factors Comparative Data Relationships  Algorithms Company Priorities VOICE OF THE CUSTOMER PRIORITIES COMPETITIVE EVALUATION HOWs DIRECTION OF IMPROVEMENT RELATIONSHIP MATRIX CORRELATION MATRIX HOW MUCHes RANKINGS / PRIORITIES REQUIREMENTS INTERACTION MATRIX
DFSS in the  Software Engineering Center Business Development & Proposals Software Project Management Software Architecture Software Requirements Software Design Software Test Executing the Value Stream
DFSS for Software:  Affordability Teach engineers the business impacts of their decisions Costs of software products are directly attributed to the activities that produce them Control process costs to control product costs Proactive Planning vs Reactive Repairing “ Burn Rates” should be understood Predictive Value Stream Analysis shows areas of focus for cost improvements Process Flows show inherent weaknesses in activities around product development Non-Value Added activities can be minimized or removed
Critical Chain Project Management Developed by Dr. Eliyahu M. Goldratt Founder of the Theory of Constraints Practical project management technique used to reduce development cycle time Based on statistical methodologies Used at Raytheon and across aerospace industry All internal I.T. projects and infrastructure rollouts use CCPM Increasingly accepted by our customers Successfully implemented on multiple programs
Multi-Tasking is an Insidious Generator of  When (if) we look at “Resource Allocation”  we typically discover high degrees of multi-tasking  … waste Why software teams struggle to meet their schedule commitments Resource 1 Resource 3 Time Resource 2
Assigning more than one task to a resource Effects of Multi-Tasking Expectations : Task A Task B Task C What happens: A B C A B C Lost Productivity due to context switching Should happen: Task A Task B Task C Priorities are established and followed
CCPM Typical Results- Notional  A B C A B C No Multi-Tasking   Multi-tasking  t = 0 Projects start later but  finish sooner t = n
CCPM Theory Each task in a schedule has variability associated with it. Often schedulers use an “average” historical task time to develop new schedules Statistically speaking, this drives a 50% success rate Buffers are established to mitigate schedule loss due to task variability along the critical path/chain 95% Task Buffer 50%
Protecting Customers A single “project buffer” is defined to cover the cumulative variation that results from all tasks  The project buffer  PROTECTS CUSTOMERS  from the schedule variability and uncertainty within each task The  p roject  lead  manages the uncertainty as a whole, controlling buffer penetration versus schedule completion 1 2 4 3 5 6 7 8 9 Buffer 95% 50% Agreed Upon Delivery Date
DFSS in the  Software Engineering Center Business Development & Proposals Software Project Management Software Architecture Software Requirements Software Design Software Test Creating and Analyzing the System
It all starts with your model... An Equation, Model, or Simulation of the system function is usually available:  Input Output y = f(x) Spreadsheets Need to transform this deterministic approach  into a probabilistic approach.
A B C D E Y Y =  f  (A, B, C, D, E, F,...,M) 0 0.02 0.04 0.06 0.08 0.1 0.12 0.14 0.16 0.18 180 187 194 201 208 215 222 229 236 243 250 0 0.1 0.2 0.3 0.4 0.5 0.6 0.7 0.8 17 17.6 18.2 18.8 19.4 20 20.6 21.2 21.8 22.4 23 0 0.2 0.4 0.6 0.8 1 1.2 1.4 15 15.8 16.6 17.4 18.2 19 19.8 20.6 21.4 22.2 23 0 0.2 0.4 0.6 0.8 1 1.2 1.4 15 16.5 18 19.5 21 22.5 24 25.5 27 28.5 30 0 0.2 0.4 0.6 0.8 1 1.2 1.4 15 16.5 18 19.5 21 22.5 24 25.5 27 28.5 30 Response F G H I J K L M Simulation or Multi-Variate Transfer Function Design Variables Input Variation Contributes To  Response Variation 0 0.05 0.1 0.15 0.2 0.25 15 16.5 18 19.5 21 22.5 24 25.5 27 28.5 30
A B C D E Y Y =  f  (A, B, C, D, E, F,...,M) 0 0.02 0.04 0.06 0.08 0.1 0.12 0.14 0.16 0.18 180 187 194 201 208 215 222 229 236 243 250 0 0.1 0.2 0.3 0.4 0.5 0.6 0.7 0.8 17 17.6 18.2 18.8 19.4 20 20.6 21.2 21.8 22.4 23 0 0.2 0.4 0.6 0.8 1 1.2 1.4 15 15.8 16.6 17.4 18.2 19 19.8 20.6 21.4 22.2 23 0 0.2 0.4 0.6 0.8 1 1.2 1.4 15 16.5 18 19.5 21 22.5 24 25.5 27 28.5 30 0 0.2 0.4 0.6 0.8 1 1.2 1.4 15 16.5 18 19.5 21 22.5 24 25.5 27 28.5 30 Response F G H I J K L M Design Variables System/Sub-System Model f  (A, B, C, D, E, F,...,M) A Visual Representation of DFSS Statistical Requirements Analysis 0 0.05 0.1 0.15 0.2 0.25 15 16.5 18 19.5 21 22.5 24 25.5 27 28.5 30 Flow Down/Allocation Based on Output Variability
DFSS Performance Analysis results in... A prediction of the  Response Statistical Properties A prediction of the  Probability of Non-Compliance An assessment of the  Contribution of Parameter Variation  to the Response Variation Results from Crystal Ball   Monte Carlo SW A B C D E Y f  (A, B, C, D, E, F,...,M) Parameters Response F G H I J K L M Function G-Sys. Losses -.45 A-Pavg .35 D-Ant. Eff, .35 F-Integ. Eff. .34 J-Rec. BW -.34 B-Ant. Gain .29 H-Tgt RCS .23 C-Ant. Aperture .21 K-Pulse Width -.19 M-Rec. Out SNR -.15 I-Noise Figure -.12 L-Rep. Freq. -.03 -1 -0.5 0 0.5 1 Measured by Rank Correlation Prob(LL<Y<UL)  y ,   y ,   1y ,   2y PDF(Y)
Requirement: 40 knot speed @ sea state 2 Analysis: Speed = f(wave height, wave period, power) LCAC Example:  Requirements Analysis Actual Behavior Factor Worst-Case Assumptions Wave Height (ft): Wave Period (s): Power (hp): 40  LSL STATISTICAL ANALYSIS 1.6 3 15000 40 LSL WORST-CASE ANALYSIS 35 Speed Speed 0.3 1.6 3 15 7 15000 16000
A systematic technique to Identify potential failures Prioritize the failures according to the risk Severity Occurrence probability Detection probability Identify actions which can reduce / eliminate  failures Failure Modes and Effects Analysis
Using FMEA to Evaluate an Architecture Procedure List the functions in the architecture. Look at potential failure modes of the current architecture Weight the failure modes as to  Probability of occurrence Severity of occurrence Probability of detection should the failure occur Evaluate risk mitigation alternatives Iterate the solutions and strengthen the architecture
 
DFSS in the  Software Engineering Center Business Development & Proposals Software Project Management Software Architecture Software Requirements Software Design Software Test Communicating the Key Characteristics
KPC – Key Product Characteristic A KPC is a product characteristic for which reasonably anticipated variation could significantly affect a product’s safety, compliance to government regulations, performance, or fit.  LSL USL USL LSL Loss  Standard KPC Taguchi Loss Function
Key Product Characteristics As systems become more complex, a method to identify these important characteristics is required. Higher level KPCs are influenced by lower level KPCs Lower level KPCs are generated by Key Control (process) Characteristics Variation in a KCC impacts upper level KPCs and overall system performance Identification of KPCs with flowdown to employees and suppliers ensures alignment to customer ‘care abouts’
Key Product Characteristic Tree Simple Example of a KCC Affecting Several KPCs Top-level KPCs 2nd level KPCs KCCs VOC
DFSS in the  Software Engineering Center Business Development & Proposals Software Project Management Software Architecture Software Requirements Software Design Software Test Predicting and Preventing Defects
Defect Containment Chart
Defect Density Predictive Model Motivation Defect Containment is a lagging indicator Within a single development program it is difficult at best to: Analyze the data Determine root cause Take action Measure results Data does not give the complete picture until the development is over An effective defect prediction model provides the ability to mix actual and predictive performance to show what the picture will look like before you get there  This enables us to make better decisions and take more effective preventive action.
Defect Model Previous Program/Release Standard Defect Containment Chart Model Raw Defect Counts  Prorate the raw defect counts for the new program based upon SLOC counts Projected Raw Defect Counts For New Program New Program Defect Containment Current Raw Defect Counts New Program - Projected Defect Containment Sum of Current Raw Defect Counts Plus Raw Defects Not Yet Detected Defect Density Predictive Model Approach
Defect Density Stage Detected and Originated Defect density by stage uses total defects and source lines of   code counts to assess the efficiency of catching and containing software defects in the various lifecycle stages.
Defect Density Code Inspection Analysis When number of defects is between the control limits, fix findings and pass to next stage . When number of defects is below the lower limit, unit(s) may need more inspection. When number of defects is above the upper limit, unit(s) may need rework and a repeated inspection.
DFSS in the  Software Engineering Center Business Development & Proposals Software Project Management Software Architecture Software Requirements Software Design Software Test Optimizing Product Performance
Testing - An Opportunity for Leverage Industry studies have shown testing to represent between 30 and 50% of product development costs.  If this is even close to accurate, testing represents fertile ground for optimization.
Combinatorial Design Method A testing method in which a subset of all possible combinations is chosen such that all N-way combinations are tested Covering all 2 way combinations requires that for any two factors A and B, where Ai and Bi are valid levels for A and B, there is a test for all Ai and Bi combinations
CDM Advantages Two way combinations provide good coverage  of system More realistic than full/fractional designs Compatible with constraints Compatible with factors at different levels Can account for previous testing Drastically reduces the total number of test cases when compared to all combinations G enerating test cases is very quick and simple Can be used in almost all phases of testing
Ground Satellite System Example Testing program Factory Acceptance Test (FAT) Dry Run FAT Site Acceptance Test (SAT) Dry Run SAT Not realistic to do exhaustive testing of 144 test cases A typical strategy employed (quasi-exhaustive) 100% of tests for FAT Dry Run 10% of tests, selected at random, for FAT 50% of tests, selected at random, for SAT Dry Run 10% of tests, selected at random, for SAT CDM Strategy was superior to Quasi-Exhaustive Strategy Schedule savings = 68% Cost savings (labor) = 67%
Satellite Ground Systems Applied Case
Usage Based Testing  Using Markov Chains System tested based on the way it is to be used  Markov model is used to generate a representative, random sample usage so statistical methods can be applied to appraise the correctness of software behavior System  u nder  t est is tested by using input stimuli selected via a random walk through the Markov chain
Y (0.5) X (0.5) Z (0.2) W (0.5) X (1) Y (0.3) Y (0.8) Y (0.3) X (0.7) Z (0.2) X (1) Y (0.75) Y (0.1) X (0.9) Z (0.3) Y (0.2) X (0.5) Visual Requirements Jointly developed “state diagram”  provides valuable insight as to  Systems use State diagram with transition  probabilities can be represented  by a Markov Chain Also highly effective in the  design and optimization of  Systems test cases Nodes represent “states of use” Arcs represent stimuli Probabilities represent user  behavior X (0.25) Z (1) S E
Raytheon Case Study Results Escaping defects were less than other testing methods 1.16 defects per KSLOCs vs 6.0 defects/ KSLOCs Memory leak found during multiple runs that would not have been  caught by previous testing method Software development costs met budgets Major software functions were integrated quickly Automated oracles were developed to facilitate test case development
Summary DFSS provides stati stical analysis tools to reduce variation in product performance. DFSS minimizes development costs by identifying critical activities and providing buffers to those activities to manage schedule variation. DFSS optimizes testing of software through the use of Combinatorial Design and Usage-Based Modeling methods.
Resources Theory of Constraints: http://www.rogo.com/cac/dettmer1.html Combinatorial Design Methods: http://aetgweb.argreenhouse.com/papers/2000-incose.pdf Usage Based Modeling: http://www.andrew.cmu.edu/user/sprowell/pubs/prowell2004soa_pres.pdf
Questions?

QM-007-Design for 6 sigma

  • 1.
    Using Design forSix Sigma to achieve Lean Software Development at Raytheon Missile Systems Tony Strickland Certified Raytheon Six Sigma Expert (520) 794-7855 [email_address] ®
  • 2.
    Raytheon Six Sigma?Why not DMAIC? 1999: Starting a transition – merging 4 companies into 1 Introduction of Raytheon Six Sigma TM The wheel of excellence Lean manufacturing Culture integration Soft Skills Focus on process improvement Removing unnecessary debt ($11B -> ~$5B) One business language, one set of processes ®
  • 3.
    Six Sigma ProcessConduct Business Diagnostic - Create Improvement Projects
  • 4.
    Process Integration IPDSprovides an integrated set of best practices for the entire product development life cycle using a just-in-time tailoring process. R6s is a business strategy for process improvement. CMMI provides guidance for creating, measuring,managing, and improving specific processes. Each plays an integral role in the success of programs, projects and organizations
  • 5.
    DFSS Design forSix Sigma is a methodology used to predict, manage and improve Producibility, Affordability , and Robust Performance for the benefit of the customers. DESIGNS THAT CONSISTENTLY ENSURE MISSION SUCCESS, MEET COST & SCHEDULE, AND CAN BE READILY PRODUCED IN THE FACTORY Design for Six Sigma Definition Affordability Producibility Robust Performance
  • 6.
    Technical Components ofDFSS with Enablers Cost as an Independent Variable Design to Cost Cost Estimating & Tradeoff Analysis Affordability Affordability Quality Function Deployment Parameter Diagrams Key Characteristics Statistical Design Methods Defect Containment Process Reliability Prediction Design For Performance Robust Performance DFMA Workshop Producibility Assessments Process Capability Analysis Mechanical Tolerancing Process FMEA Process Modeling Design For Producibility Producibility
  • 7.
    Traditional DFSS Investment:Non-Recurring Costs Engineering Hours 0 Months Desired Typical Development I&T Production WHY USE DFSS? Reactive Proactive Challenge DFSS Challenge: Non-Recurring Costs Potential Revenue Generation: Recurring Costs
  • 8.
    What does DFSSmean for Software? DFSS for Software embeds the principles of Six Sigma into software design, so that: Software designs are optimized to the cu stomer’s needs The ability to predict and manage variability early in the software design process is realized The appropriate balance between affordability, product performance, and testabili ty is create d DFSS for Software Product Focus Software Six Sigma Process Focus vs
  • 9.
    Effectively Applying DFSSin Software Intensive Systems Program Execution Gates 5-11 Business Decision Gates 1-4 5 - System Integration, Verification and Validation 4 - Product Design and Development 1 - Capture/Proposal Development 7 8 10 9 = GATE Internal Preliminary Design Review Start-Up Review Internal System Functional Review Internal Critical Design Review Internal Test/Ship Readiness Review Internal Production Readiness Review Key Characteristics Management Cost Management 2 - Project Planning, Management and Control 1 2 3 4 Bid / Proposal Review 11 Test Optimization Architecture Evaluation QFD Visual Requirements Critical Chain Defect Prediction & Prevention Performance Modeling Planning 6 - Production and Deployment Planning 7 - Operations and Support 3 - Requirements and Architecture Development 5 6
  • 10.
    Implementation Strategy EmbedDFSS into the Software Directive System (t he softw are engineering segment of IPDS) for the following activities: Business Development & Proposals Software Project Management Software Architecture Software Requirements Software Design Software Test
  • 11.
    DFSS in the Software Engineering Center Business Development & Proposals Software Project Management Software Architecture Software Requirements Software Design Software Test Knowing the Customer’s Needs
  • 12.
    Quality Function Deployment:Capturing the Voice of the Customer A Graphic that documents: Customer Priorities Weighting Factors Comparative Data Relationships Algorithms Company Priorities VOICE OF THE CUSTOMER PRIORITIES COMPETITIVE EVALUATION HOWs DIRECTION OF IMPROVEMENT RELATIONSHIP MATRIX CORRELATION MATRIX HOW MUCHes RANKINGS / PRIORITIES REQUIREMENTS INTERACTION MATRIX
  • 13.
    DFSS in the Software Engineering Center Business Development & Proposals Software Project Management Software Architecture Software Requirements Software Design Software Test Executing the Value Stream
  • 14.
    DFSS for Software: Affordability Teach engineers the business impacts of their decisions Costs of software products are directly attributed to the activities that produce them Control process costs to control product costs Proactive Planning vs Reactive Repairing “ Burn Rates” should be understood Predictive Value Stream Analysis shows areas of focus for cost improvements Process Flows show inherent weaknesses in activities around product development Non-Value Added activities can be minimized or removed
  • 15.
    Critical Chain ProjectManagement Developed by Dr. Eliyahu M. Goldratt Founder of the Theory of Constraints Practical project management technique used to reduce development cycle time Based on statistical methodologies Used at Raytheon and across aerospace industry All internal I.T. projects and infrastructure rollouts use CCPM Increasingly accepted by our customers Successfully implemented on multiple programs
  • 16.
    Multi-Tasking is anInsidious Generator of When (if) we look at “Resource Allocation” we typically discover high degrees of multi-tasking … waste Why software teams struggle to meet their schedule commitments Resource 1 Resource 3 Time Resource 2
  • 17.
    Assigning more thanone task to a resource Effects of Multi-Tasking Expectations : Task A Task B Task C What happens: A B C A B C Lost Productivity due to context switching Should happen: Task A Task B Task C Priorities are established and followed
  • 18.
    CCPM Typical Results-Notional A B C A B C No Multi-Tasking Multi-tasking t = 0 Projects start later but finish sooner t = n
  • 19.
    CCPM Theory Eachtask in a schedule has variability associated with it. Often schedulers use an “average” historical task time to develop new schedules Statistically speaking, this drives a 50% success rate Buffers are established to mitigate schedule loss due to task variability along the critical path/chain 95% Task Buffer 50%
  • 20.
    Protecting Customers Asingle “project buffer” is defined to cover the cumulative variation that results from all tasks The project buffer PROTECTS CUSTOMERS from the schedule variability and uncertainty within each task The p roject lead manages the uncertainty as a whole, controlling buffer penetration versus schedule completion 1 2 4 3 5 6 7 8 9 Buffer 95% 50% Agreed Upon Delivery Date
  • 21.
    DFSS in the Software Engineering Center Business Development & Proposals Software Project Management Software Architecture Software Requirements Software Design Software Test Creating and Analyzing the System
  • 22.
    It all startswith your model... An Equation, Model, or Simulation of the system function is usually available: Input Output y = f(x) Spreadsheets Need to transform this deterministic approach into a probabilistic approach.
  • 23.
    A B CD E Y Y = f (A, B, C, D, E, F,...,M) 0 0.02 0.04 0.06 0.08 0.1 0.12 0.14 0.16 0.18 180 187 194 201 208 215 222 229 236 243 250 0 0.1 0.2 0.3 0.4 0.5 0.6 0.7 0.8 17 17.6 18.2 18.8 19.4 20 20.6 21.2 21.8 22.4 23 0 0.2 0.4 0.6 0.8 1 1.2 1.4 15 15.8 16.6 17.4 18.2 19 19.8 20.6 21.4 22.2 23 0 0.2 0.4 0.6 0.8 1 1.2 1.4 15 16.5 18 19.5 21 22.5 24 25.5 27 28.5 30 0 0.2 0.4 0.6 0.8 1 1.2 1.4 15 16.5 18 19.5 21 22.5 24 25.5 27 28.5 30 Response F G H I J K L M Simulation or Multi-Variate Transfer Function Design Variables Input Variation Contributes To Response Variation 0 0.05 0.1 0.15 0.2 0.25 15 16.5 18 19.5 21 22.5 24 25.5 27 28.5 30
  • 24.
    A B CD E Y Y = f (A, B, C, D, E, F,...,M) 0 0.02 0.04 0.06 0.08 0.1 0.12 0.14 0.16 0.18 180 187 194 201 208 215 222 229 236 243 250 0 0.1 0.2 0.3 0.4 0.5 0.6 0.7 0.8 17 17.6 18.2 18.8 19.4 20 20.6 21.2 21.8 22.4 23 0 0.2 0.4 0.6 0.8 1 1.2 1.4 15 15.8 16.6 17.4 18.2 19 19.8 20.6 21.4 22.2 23 0 0.2 0.4 0.6 0.8 1 1.2 1.4 15 16.5 18 19.5 21 22.5 24 25.5 27 28.5 30 0 0.2 0.4 0.6 0.8 1 1.2 1.4 15 16.5 18 19.5 21 22.5 24 25.5 27 28.5 30 Response F G H I J K L M Design Variables System/Sub-System Model f (A, B, C, D, E, F,...,M) A Visual Representation of DFSS Statistical Requirements Analysis 0 0.05 0.1 0.15 0.2 0.25 15 16.5 18 19.5 21 22.5 24 25.5 27 28.5 30 Flow Down/Allocation Based on Output Variability
  • 25.
    DFSS Performance Analysisresults in... A prediction of the Response Statistical Properties A prediction of the Probability of Non-Compliance An assessment of the Contribution of Parameter Variation to the Response Variation Results from Crystal Ball  Monte Carlo SW A B C D E Y f (A, B, C, D, E, F,...,M) Parameters Response F G H I J K L M Function G-Sys. Losses -.45 A-Pavg .35 D-Ant. Eff, .35 F-Integ. Eff. .34 J-Rec. BW -.34 B-Ant. Gain .29 H-Tgt RCS .23 C-Ant. Aperture .21 K-Pulse Width -.19 M-Rec. Out SNR -.15 I-Noise Figure -.12 L-Rep. Freq. -.03 -1 -0.5 0 0.5 1 Measured by Rank Correlation Prob(LL<Y<UL)  y ,  y ,  1y ,  2y PDF(Y)
  • 26.
    Requirement: 40 knotspeed @ sea state 2 Analysis: Speed = f(wave height, wave period, power) LCAC Example: Requirements Analysis Actual Behavior Factor Worst-Case Assumptions Wave Height (ft): Wave Period (s): Power (hp): 40  LSL STATISTICAL ANALYSIS 1.6 3 15000 40 LSL WORST-CASE ANALYSIS 35 Speed Speed 0.3 1.6 3 15 7 15000 16000
  • 27.
    A systematic techniqueto Identify potential failures Prioritize the failures according to the risk Severity Occurrence probability Detection probability Identify actions which can reduce / eliminate failures Failure Modes and Effects Analysis
  • 28.
    Using FMEA toEvaluate an Architecture Procedure List the functions in the architecture. Look at potential failure modes of the current architecture Weight the failure modes as to Probability of occurrence Severity of occurrence Probability of detection should the failure occur Evaluate risk mitigation alternatives Iterate the solutions and strengthen the architecture
  • 29.
  • 30.
    DFSS in the Software Engineering Center Business Development & Proposals Software Project Management Software Architecture Software Requirements Software Design Software Test Communicating the Key Characteristics
  • 31.
    KPC – KeyProduct Characteristic A KPC is a product characteristic for which reasonably anticipated variation could significantly affect a product’s safety, compliance to government regulations, performance, or fit. LSL USL USL LSL Loss Standard KPC Taguchi Loss Function
  • 32.
    Key Product CharacteristicsAs systems become more complex, a method to identify these important characteristics is required. Higher level KPCs are influenced by lower level KPCs Lower level KPCs are generated by Key Control (process) Characteristics Variation in a KCC impacts upper level KPCs and overall system performance Identification of KPCs with flowdown to employees and suppliers ensures alignment to customer ‘care abouts’
  • 33.
    Key Product CharacteristicTree Simple Example of a KCC Affecting Several KPCs Top-level KPCs 2nd level KPCs KCCs VOC
  • 34.
    DFSS in the Software Engineering Center Business Development & Proposals Software Project Management Software Architecture Software Requirements Software Design Software Test Predicting and Preventing Defects
  • 35.
  • 36.
    Defect Density PredictiveModel Motivation Defect Containment is a lagging indicator Within a single development program it is difficult at best to: Analyze the data Determine root cause Take action Measure results Data does not give the complete picture until the development is over An effective defect prediction model provides the ability to mix actual and predictive performance to show what the picture will look like before you get there This enables us to make better decisions and take more effective preventive action.
  • 37.
    Defect Model PreviousProgram/Release Standard Defect Containment Chart Model Raw Defect Counts Prorate the raw defect counts for the new program based upon SLOC counts Projected Raw Defect Counts For New Program New Program Defect Containment Current Raw Defect Counts New Program - Projected Defect Containment Sum of Current Raw Defect Counts Plus Raw Defects Not Yet Detected Defect Density Predictive Model Approach
  • 38.
    Defect Density StageDetected and Originated Defect density by stage uses total defects and source lines of code counts to assess the efficiency of catching and containing software defects in the various lifecycle stages.
  • 39.
    Defect Density CodeInspection Analysis When number of defects is between the control limits, fix findings and pass to next stage . When number of defects is below the lower limit, unit(s) may need more inspection. When number of defects is above the upper limit, unit(s) may need rework and a repeated inspection.
  • 40.
    DFSS in the Software Engineering Center Business Development & Proposals Software Project Management Software Architecture Software Requirements Software Design Software Test Optimizing Product Performance
  • 41.
    Testing - AnOpportunity for Leverage Industry studies have shown testing to represent between 30 and 50% of product development costs. If this is even close to accurate, testing represents fertile ground for optimization.
  • 42.
    Combinatorial Design MethodA testing method in which a subset of all possible combinations is chosen such that all N-way combinations are tested Covering all 2 way combinations requires that for any two factors A and B, where Ai and Bi are valid levels for A and B, there is a test for all Ai and Bi combinations
  • 43.
    CDM Advantages Twoway combinations provide good coverage of system More realistic than full/fractional designs Compatible with constraints Compatible with factors at different levels Can account for previous testing Drastically reduces the total number of test cases when compared to all combinations G enerating test cases is very quick and simple Can be used in almost all phases of testing
  • 44.
    Ground Satellite SystemExample Testing program Factory Acceptance Test (FAT) Dry Run FAT Site Acceptance Test (SAT) Dry Run SAT Not realistic to do exhaustive testing of 144 test cases A typical strategy employed (quasi-exhaustive) 100% of tests for FAT Dry Run 10% of tests, selected at random, for FAT 50% of tests, selected at random, for SAT Dry Run 10% of tests, selected at random, for SAT CDM Strategy was superior to Quasi-Exhaustive Strategy Schedule savings = 68% Cost savings (labor) = 67%
  • 45.
  • 46.
    Usage Based Testing Using Markov Chains System tested based on the way it is to be used Markov model is used to generate a representative, random sample usage so statistical methods can be applied to appraise the correctness of software behavior System u nder t est is tested by using input stimuli selected via a random walk through the Markov chain
  • 47.
    Y (0.5) X(0.5) Z (0.2) W (0.5) X (1) Y (0.3) Y (0.8) Y (0.3) X (0.7) Z (0.2) X (1) Y (0.75) Y (0.1) X (0.9) Z (0.3) Y (0.2) X (0.5) Visual Requirements Jointly developed “state diagram” provides valuable insight as to Systems use State diagram with transition probabilities can be represented by a Markov Chain Also highly effective in the design and optimization of Systems test cases Nodes represent “states of use” Arcs represent stimuli Probabilities represent user behavior X (0.25) Z (1) S E
  • 48.
    Raytheon Case StudyResults Escaping defects were less than other testing methods 1.16 defects per KSLOCs vs 6.0 defects/ KSLOCs Memory leak found during multiple runs that would not have been caught by previous testing method Software development costs met budgets Major software functions were integrated quickly Automated oracles were developed to facilitate test case development
  • 49.
    Summary DFSS providesstati stical analysis tools to reduce variation in product performance. DFSS minimizes development costs by identifying critical activities and providing buffers to those activities to manage schedule variation. DFSS optimizes testing of software through the use of Combinatorial Design and Usage-Based Modeling methods.
  • 50.
    Resources Theory ofConstraints: http://www.rogo.com/cac/dettmer1.html Combinatorial Design Methods: http://aetgweb.argreenhouse.com/papers/2000-incose.pdf Usage Based Modeling: http://www.andrew.cmu.edu/user/sprowell/pubs/prowell2004soa_pres.pdf
  • 51.

Editor's Notes

  • #2 Historically, six sigma has been tied to applying statistics to the way that we view and analyze processes for producing a product. This thought process has also been tied to the way that we design a product. A point to consider, is whether six sigma should be tied to the process for designing a product, or to the analysis of the performance of the product. A common theme we see in development program post-mortems is that the integrity and stability of system requirements are the predominant factors in our ability to meet PD milestones and budgets. Statistical methods and tools now exist for the System Engineer which will facilitate early requirements definition, and will assist in trade studies as far back as Science and Technology phases. Likewise, statistical and other DFSS methods and tools are available for detail design. These capabilities coupled with a well-defined integrated Product Development methodology give a whole new meaning and great improvements to the concept of “transition to production”. The result: more robust requirements, more robust designs, reduced production costs, but also reduced risk in meeting Product Development schedules.