This document presents a case study on optimizing manufacturing test times for printed circuit boards using the DMAIC (Define, Measure, Analyze, Improve, Control) process at a Cisco manufacturing facility. The optimization project reduced advance flying probe test times by over 50% without compromising product quality. Statistical analysis over 6 months confirmed the time savings. The test time optimization provided a significant return on investment. The case study demonstrates how DMAIC can be effectively used for manufacturing process improvement.
![MANUFACTURING TEST TIME OPTIMIZATION CASE STUDY:
BY THE SIX SIGMA DMAIC PROCESS
1
Lee Kong Hui and 2
Jason Ho
Cisco Systems (Malaysia) Sdn. Bhd.,
Penang, MALAYSIA.
1
konlee@cisco.com; 2
jasho@cisco.com
ABSTRACT
Lean manufacturing has been the buzzword and gained a lot
of interest in the industry since the last decade. It has
become a phenomenon in the industry and a widely
accepted fact that operation excellence will be the key focus
area to provide the leading advantage against the various
competitors.
This paper presented a case study on manufacturing test
time optimization using DMAIC approach. Successful
restructuring of an advance flying probe (AFP) test program
had enabled the test time reduction by more than 50.0%.
Statistical analysis and six sigma (6σ) first pass yield (FPY)
monitoring for 6 months after new test program
implementation had confirmed that the manufacturing test
time optimization was achieved without compromising the
product quality. In correlation to the manufacturing test time
optimization achieved, it came along with a very significant
return of investment (ROI) for the effort put in. The case
study shared here is evidenced of DMAIC as a structured
tool that can be effectively used for manufacturing
processes improvement opportunities.
Key words: Lean Manufacturing, Test Time Optimization,
DMAIC, Six Sigma, Return of Investment (ROI)
INTRODUCTION
Nowadays, all enterprises have to speed up their paces to
meet customer demands in an ever changing and innovative
era. Manufacturing operation efficiency of the equipment or
testers used during a product assembly and functional test
always represent a major economic stake for their business
concern. The main challenges and the sources of
ineffectiveness live in the choice of the equipment or tester
operation, usage and running time especially when the
machine plays a vital role in the manufacturing processes or
functional test coverage to maximize output and maintain
product quality. For this purpose, to remain competitive in
the market and ensure survival of the businesses, be credible
and contributing to the success of the company, one must
continually adapt to the advancement of technical areas,
processes simplification and waste elimination, while at the
same time uphold the quality and reliability of its product.
Lean 6σ via the 5 steps DMAIC (Define-Measure-Analyze-
Improve-Control) is a method commonly used in the
industry to simplify the manufacturing processes and to
improve quality based on mastering statically controlled
manufacturing related processes. It is often described as an
approach to trouble shoot manufacturing related issues and a
management style that is based on a highly regulated
organization dedicated to managing improvement project [1,
2]. Accordingly, the much improved production efficiency
will increase output and ultimately yield significant positive
financial benefits.
The presented case study here was an actual improvement
project selected from a few initiatives that were successfully
completed at one of our manufacturing partner sites in 2015
with significant test time reduction and annual cost saving
to the company. This work aims to study the 6σ DMAIC
method from the perspective of scientific theories in the
field of problem solving as had been published in the
operations research, management science and Industrial
Engineering literatures [1, 3 to 7], while at the same time
proven with actual manufacturing achievement. This case
study had helped the authors to develop an in-depth
understanding of the DMAIC method from a goal-theoretic
perspective with its feasibility and practical application
evidenced from the test time reduction and cost saving
achieved. The discussion herein will be based on the
standard DMAIC structure practiced within Cisco Systems
Inc. highlighting a few key area of interest, while at the
same time only briefly touch on those intellectual property
right related matters to avoid legal conflict. Opportunity for
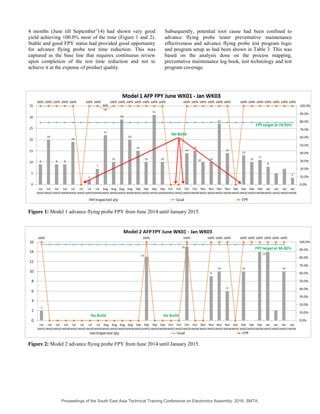
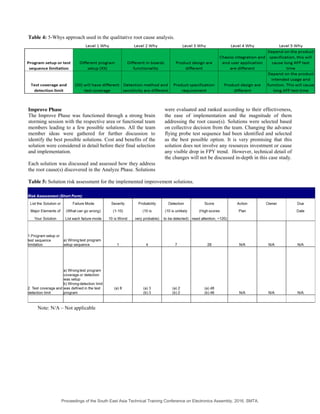
advance flying probe test time reduction had been
confirmed as the area of interest, in which the measurement
metrics will be based on advance flying probe test first pass
yield (FPY) and unit output per hour (UPH).
In addition to the significant test time reduction and annual
cost saving achieved, the case study presented was also
submitted and certified as a Green Belt project. DMAIC has
gained increasing favor to be implemented as an effective
approach that can provide convincing results.
METHODOLOGY
The methodology used in this study is DMAIC with the
consideration of 6 months base line data. In a brief and
concise structure, DMAIC methodology follows below
phases in a sequential manner. The determination of each
step’s output is supported by both statistical and non-
statistical tools. Methods were chosen according to the
effect of the tools that can give the most significant,
accurate and comprehensive representation of the data. The
5 phases of DMAIC methodology are:
Proceedings of the South East Asia Technical Training Conference on Electronics Assembly, 2016, SMTA.](https://image.slidesharecdn.com/s3p2leekonghui-181128122705/85/S3-p2-lee_kong_hui-1-320.jpg)


![their projects [8, 9]. Improving the metrics and solving the
issue for the time being will be meaningless if it is not
sustainable in the long run. Control Phase execution
involved 4 basic fundamental approaches, which are:
1. Control and standardize the solution.
2. Identify the long-term owner.
3. Develop and deploy the transition plan.
4. Close the improvement activity.
Under the control selection matrix, management score card
and review, automated system check and training and
operators certification were selected and implemented as the
control plan. Control plans selected are capable of
addressing solution risk as had been identified in the
Improve Phase. In addition to solution risk mitigation,
control plans selected also helped to ensure the
sustainability of the long term solution. Automated system
check is always a preferred choice of control plan as it is a
robust detection process that is not affected by human error
or work fatigue.
All the other 3 elements were not discussed in detail here as
they were just the routine project management attributes.
CONCLUSION
Successful implementation and growing organizational
interest in 6σ DMAIC method have been exploding in the
last few years. It is rapidly becoming a major driving force
for many technology-driven and project-driven
organizations [10]. Given the nature of this kind of
improvement project available data, some classical 6σ and
DMAIC tools have been tested and applied since the
beginning until initiative completion for the presented case
study. This case study shows that DMAIC is a structured
and an effective tool that can help continuous improvement
practitioners handle their project effectively until successful
closure.
Statistical data analysis had shown strong correlation
between Advance flying probe tester program setup or test
sequence optimization with significant Advance flying
probe test time reduction. Based on the financial benefit
gained from the completed case study (>$24k USD cost
saving) per annum in addition to the significant increase of
production output, it is very encouraging to the authors to
embark on another similar new improvement initiative. The
statistical aspect of 6σ is very much data driven and must
always complement business perspectives and challenges to
the best of a company interest to implement 6σ projects
successfully. At the same time, management involvement,
organizational commitment, project management skills,
continuous improvement mentality and continuous training
are also important influencing factors to the successful
completion of any valuable 6σ DMAIC projects.
ACKNOWLEDGEMENTS
The authors would like to express our sincere gratitude to
John Galang for his support and sponsorship to carry out
this 6σ Green Belt project successfully. Both Ted Roy and
Kah Keong Leong were also gratefully acknowledged for
their help in reviewing and proof reading this manuscript.
REFERENCES
[1] Mast, J. D. and Lokkerbol, J. (2012). An analysis of the
Six Sigma DMAIC method from the perspective of
problem solving, Int. J. Production Economics, 139, 604-
604-614.
[2] Youssouf, A., Rachid, C. and Ion, V. (2014).
Contribution to The Optimization of Strategy of
Maintenance by Lean Six Sigma, Physics Procedia, 55,
512 – 518.
[3] Gowen III, C. R. and Tallon, W. J. (2005). Effect of
technological intensity on the relationships among Six
Sigma design, electronic-business, and competitive
advantage: A dynamic capabilities model study, Journal
of High Technology Management Research, 16, 59-87.
[4] Linderman, K., Schroeder, R. G., Zaheer, S. and Choo,
A. S. (2003). Six Sigma: a goal-theoretic perspective,
Journal of Operations Management, 21, 193-203.
[5] Schroeder, R. G., Linderman, K., Liedtke, C. and Choo,
A. S. (2008). Six Sigma: Definition and underlying
theory, Journal of Operations Management, 26, 536–554.
[6] Singh, A. K. and Khanduja, D. (2014). Defining Quality
Management in Auto Sector: A Six-Sigma Perception,
Procedia Materials Science, 5, 2645-2653.
[7] Baril, C., Yacout, S. and Clément, B. (2011). Design for
Six Sigma through collaborative multiobjective
optimization, Computers & Industrial Engineering, 60,
43-55.
[8] Rohini, R. and Mallikarjun, J. (2011). Six Sigma:
Improving the Quality of Operation Theatre, Procedia -
Social and Behavioral Sciences, 25, 273-280.
[9] Vore, K. D. (2008). A six-sigma approach to stability
testing, Journal of Pharmaceutical and Biomedical
Analysis, 47, 413-421.
[10] Kwak, Y. H. and Anbari, F. T. (2006). Benefits,
obstacles, and future of six sigma approach,
Technovation, 26, 708-715.
Proceedings of the South East Asia Technical Training Conference on Electronics Assembly, 2016, SMTA.
View publication statsView publication stats](https://image.slidesharecdn.com/s3p2leekonghui-181128122705/85/S3-p2-lee_kong_hui-7-320.jpg)

![Cmmi%20 model%20changes%20for%20high%20maturity%20v01[1]](https://cdn.slidesharecdn.com/ss_thumbnails/cmmi20model20changes20for20high20maturity20v011-150525024513-lva1-app6892-thumbnail.jpg?width=640&height=640&fit=bounds)


![Cmmi hm 2008 sepg model changes for high maturity 1v01[1]](https://cdn.slidesharecdn.com/ss_thumbnails/cmmihm2008sepgmodelchangesforhighmaturity1v011-150525024656-lva1-app6892-thumbnail.jpg?width=640&height=640&fit=bounds)


![Mpc mtcp six sigma [compatibility mode]](https://cdn.slidesharecdn.com/ss_thumbnails/mpcmtcpsixsigmacompatibilitymode-121216190232-phpapp02-thumbnail.jpg?width=640&height=640&fit=bounds)


