Download to read offline

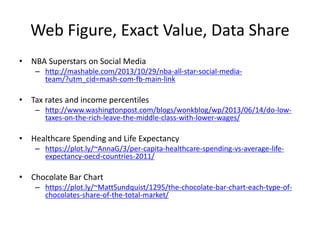


Plotly is a data visualization tool that is good for data journalists and bloggers. It allows creation of web figures, shows exact values, allows data sharing, and streaming of data. The Plotly Julia API allows access to Plotly's functionality from the Julia programming language. Some example visualizations created with Plotly include network diagrams, tax rates vs income levels, healthcare spending vs life expectancy, and a chocolate bar chart. Plotly has a Facebook group and Mashup Award for visualizations created with the tool.