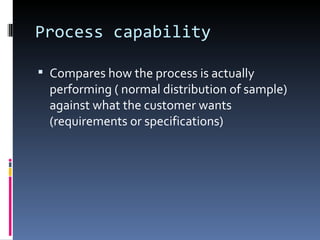
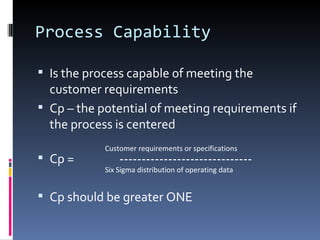
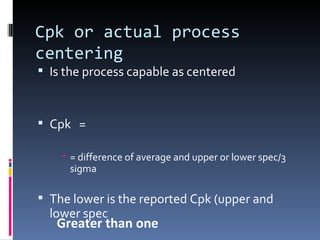
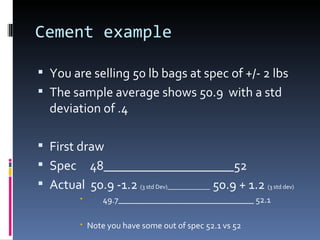
Doctor Q’s  Everything you need to about SPC ( But your mother was unable to tell you) Statistical Process Control Uses statistics and the distribution of data to predict process results and improve on them Is THE MANAGEMENT OF VARIATION Normal distribution is heart and soul Things to know – average, std deviation and normal distribution
Normal Distribution Symmetrical distribution of data-BELL CURVE Most data is normally distributed in operations or can be transformed to normal Defined like the orbit of a planet Normal Curve: Scores on a Standardized I.Q. Test                                                                       Carl Friedrich Gauss invented the normal distribution in 1809 as a way to rationalize the  method of least  Search Results
The Normal Distribution tools Control Charts tells manager when process is outside or tending outside normal distribution Control Charts selection depends on the type of data– attribute or variable
Control Charts Moving pictures of your normal distributions Control limits represent the normal six standard spread When outside the limits – you are out of control There is an assignable cause if you are outside limits The inside six sigma spread represents the “normal” distribution
The “normal variation” Level of training and experience Equipment – capability Equipment – level of maintenance Standard Operating Standards Level of ISO or TS implementation                         Ed  edward Deming
Process capability Compares how the process is actually performing ( normal distribution of sample) against what the customer wants (requirements or specifications)
Process Capability Is the process capable of meeting the customer requirements Cp – the potential of meeting requirements if the process is centered Cp =  ------------------------------ Cp should be greater ONE  Customer requirements or specifications Six Sigma distribution of operating data
Cpk or actual process centering Is the process capable as centered Cpk  =  = difference of average and upper or lower spec/3 sigma The lower is the reported Cpk (upper and lower spec Greater than one
Cement example You are selling 50 lb bags at spec of +/- 2 lbs The sample average shows 50.9  with a std deviation of .4 First draw  Spec  48____________________52 Actual  50.9 -1.2  (3 std Dev)______________  50.9 + 1.2  (3 std dev) 49.7_______________________________ 52.1 Note you have some out of spec 52.1 vs 52
Cp = 4lbs/ 6x.4= 4/2.4 = 1.666 Ideally capable BUT some out of spec thus not centered Cpk upper = upper spec-average/3 sigm  52-50.9/3x.4= 1.1/1.2=.916 Cpk lower = average-lower spec /3 sigma 50.9-48/3x.4=2.9/1.2=2.9 Therefore Cpk is .916 and less than one –not centered
Homework You are manufacturing “12 inch” rods for an equipment manufacturer The manufacturer has a specification of 12 inches +/- .1 inch You sample your process and find an average of 12.06’’ with a standard deviation of .02”
Calculate Cp  is you process ideally capable Will all the material be in specification If the process was not capable (do regardless of answer above) – name 5 options you have! Name a sixth for extra credit Without calculating is Cpk less than one Extra credit calculate Cpk HINT: see example in course documents

Spc Lecture

  • 1.
    Doctor Q’s Everything you need to about SPC ( But your mother was unable to tell you) Statistical Process Control Uses statistics and the distribution of data to predict process results and improve on them Is THE MANAGEMENT OF VARIATION Normal distribution is heart and soul Things to know – average, std deviation and normal distribution
  • 2.
    Normal Distribution Symmetricaldistribution of data-BELL CURVE Most data is normally distributed in operations or can be transformed to normal Defined like the orbit of a planet Normal Curve: Scores on a Standardized I.Q. Test                                                               Carl Friedrich Gauss invented the normal distribution in 1809 as a way to rationalize the method of least Search Results
  • 3.
    The Normal Distributiontools Control Charts tells manager when process is outside or tending outside normal distribution Control Charts selection depends on the type of data– attribute or variable
  • 4.
    Control Charts Movingpictures of your normal distributions Control limits represent the normal six standard spread When outside the limits – you are out of control There is an assignable cause if you are outside limits The inside six sigma spread represents the “normal” distribution
  • 5.
    The “normal variation”Level of training and experience Equipment – capability Equipment – level of maintenance Standard Operating Standards Level of ISO or TS implementation                     Ed edward Deming
  • 6.
    Process capability Compareshow the process is actually performing ( normal distribution of sample) against what the customer wants (requirements or specifications)
  • 7.
    Process Capability Isthe process capable of meeting the customer requirements Cp – the potential of meeting requirements if the process is centered Cp = ------------------------------ Cp should be greater ONE Customer requirements or specifications Six Sigma distribution of operating data
  • 8.
    Cpk or actualprocess centering Is the process capable as centered Cpk = = difference of average and upper or lower spec/3 sigma The lower is the reported Cpk (upper and lower spec Greater than one
  • 9.
    Cement example Youare selling 50 lb bags at spec of +/- 2 lbs The sample average shows 50.9 with a std deviation of .4 First draw Spec 48____________________52 Actual 50.9 -1.2 (3 std Dev)______________ 50.9 + 1.2 (3 std dev) 49.7_______________________________ 52.1 Note you have some out of spec 52.1 vs 52
  • 10.
    Cp = 4lbs/6x.4= 4/2.4 = 1.666 Ideally capable BUT some out of spec thus not centered Cpk upper = upper spec-average/3 sigm 52-50.9/3x.4= 1.1/1.2=.916 Cpk lower = average-lower spec /3 sigma 50.9-48/3x.4=2.9/1.2=2.9 Therefore Cpk is .916 and less than one –not centered
  • 11.
    Homework You aremanufacturing “12 inch” rods for an equipment manufacturer The manufacturer has a specification of 12 inches +/- .1 inch You sample your process and find an average of 12.06’’ with a standard deviation of .02”
  • 12.
    Calculate Cp is you process ideally capable Will all the material be in specification If the process was not capable (do regardless of answer above) – name 5 options you have! Name a sixth for extra credit Without calculating is Cpk less than one Extra credit calculate Cpk HINT: see example in course documents