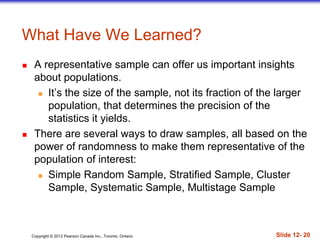
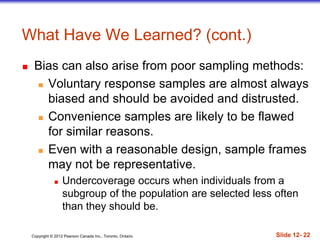
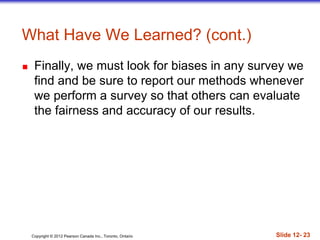
Copyright © 2012 Pearson Canada Inc., Toronto, Ontario Slide 12- 1
Who’s Who?
 The Who of a survey can refer to different groups,
and the resulting ambiguity can tell you a lot
about the success of a study.
 To start, think about the population of interest.
Often, you’ll find that this is not really a well-
defined group.
 Even if the population is clear, it may not be a
practical group to study.
Copyright © 2012 Pearson Canada Inc., Toronto, Ontario Slide 12- 2
Who’s Who? (cont.)
 Second, you must specify the sampling frame.
 Usually, the sampling frame is not the group
you really want to know about.
 The sampling frame limits what your survey
can find out.
Copyright © 2012 Pearson Canada Inc., Toronto, Ontario Slide 12- 3
Who’s Who? (cont.)
 Then there’s your target sample.
 These are the individuals for whom you intend
to measure responses.
 You’re not likely to get responses from all of
them—nonresponse is a problem in many
surveys.
Copyright © 2012 Pearson Canada Inc., Toronto, Ontario Slide 12- 4
Who’s Who? (cont.)
 Finally, there is your sample—the actual
respondents.
 These are the individuals about whom you do
get data and can draw conclusions.
 Unfortunately, they might not be representative
of the sample, the sampling frame, or the
population.
Copyright © 2012 Pearson Canada Inc., Toronto, Ontario Slide 12- 5
Who’s Who? (cont.)
 At each step, the group we can study may be
constrained further.
 The Who keeps changing, and each constraint
can introduce biases.
 A careful study should address the question of
how well each group matches the population of
interest.
Copyright © 2012 Pearson Canada Inc., Toronto, Ontario Slide 12- 6
Who’s Who? (cont.)
 One of the main benefits of simple random
sampling is that it never loses its sense of who’s
Who.
 The Who in an SRS is the population of
interest from which we’ve drawn a
representative sample. (That’s not always true
for other kinds of samples.)
Copyright © 2012 Pearson Canada Inc., Toronto, Ontario Slide 12- 7
Who’s Who? (cont.)
Copyright © 2012 Pearson Canada Inc., Toronto, Ontario Slide 12- 8
The Valid Survey
 It isn’t sufficient to just draw a sample and start
asking questions. Before you set out to survey,
ask yourself:
 What do I want to know?
 Am I asking the right respondents?
 Am I asking the right questions?
 What would I do with the answers if I had them;
would they address the things I want to know?
Copyright © 2012 Pearson Canada Inc., Toronto, Ontario Slide 12- 9
These questions may sound obvious, but they are a
number of pitfalls to avoid.
 Know what you want to know.
 Understand what you hope to learn and from
whom you hope to learn it.
 Use the right frame.
 Be sure you have a suitable sample frame.
 Time your instrument.
 The survey instrument itself can be the source
of errors.
The Valid Survey (cont.)
Copyright © 2012 Pearson Canada Inc., Toronto, Ontario Slide 12- 10
 Ask specific rather than general questions.
 Ask for quantitative results when possible.
 Be careful in phrasing questions.
 A respondent may not understand the question
or may understand the question differently than
the way the researcher intended it.
 Even subtle differences in phrasing can make a
difference.
The Valid Survey (cont.)
Copyright © 2012 Pearson Canada Inc., Toronto, Ontario Slide 12- 11
The Valid Survey (cont.)
 Be careful in phrasing answers.
 It’s often a better idea to offer choices rather than
inviting a free response.
Copyright © 2012 Pearson Canada Inc., Toronto, Ontario Slide 12- 12
 The best way to protect a survey from
unanticipated measurement errors is to perform a
pilot survey.
 A pilot is a trial run of a survey you eventually
plan to give to a larger group.
The Valid Survey (cont.)
Copyright © 2012 Pearson Canada Inc., Toronto, Ontario Slide 12- 13
What Can Go Wrong?—or How to Sample
Badly
 Sample Badly with Volunteers:
 In a voluntary response sample, a large group of
individuals is invited to respond, and all who do
respond are counted.
 Voluntary response samples are almost always biased, and so
conclusions drawn from them are almost always wrong.
 Voluntary response samples are often biased toward
those with strong opinions or those who are strongly
motivated.
 Since the sample is not representative, the resulting
voluntary response bias invalidates the survey.
Copyright © 2012 Pearson Canada Inc., Toronto, Ontario Slide 12- 14
What Can Go Wrong?—or How to Sample
Badly (cont.)
 Sample Badly, but Conveniently:
 In convenience sampling, we simply include
the individuals who are convenient.
 Unfortunately, this group may not be representative
of the population.
 Convenience sampling is not only a problem
for students or other beginning samplers.
 In fact, it is a widespread problem in the business
world—the easiest people for a company to sample
are its own customers.
Copyright © 2012 Pearson Canada Inc., Toronto, Ontario Slide 12- 15
What Can Go Wrong?—or How to Sample
Badly (cont.)
 Sample from a Bad Sampling Frame:
 An SRS from an incomplete sampling frame introduces
bias because the individuals included may differ from
the ones not in the frame.
 Undercoverage:
 Many of these bad survey designs suffer from
undercoverage, in which some portion of the
population is not sampled at all or has a smaller
representation in the sample than it has in the
population.
 Undercoverage can arise for a number of reasons, but
it’s always a potential source of bias.
Copyright © 2012 Pearson Canada Inc., Toronto, Ontario Slide 12- 16
What Else Can Go Wrong?
 Watch out for nonrespondents.
 A common and serious potential source of bias
for most surveys is nonresponse bias.
 No survey succeeds in getting responses from
everyone.
 The problem is that those who don’t respond may
differ from those who do.
 And they may differ on just the variables we care
about.
Copyright © 2012 Pearson Canada Inc., Toronto, Ontario Slide 12- 17
What Else Can Go Wrong? (cont.)
 Don’t bore respondents with surveys that go on
and on and on and on…
 Surveys that are too long are more likely to be
refused, reducing the response rate and
biasing all the results.
Copyright © 2012 Pearson Canada Inc., Toronto, Ontario Slide 12- 18
What Else Can Go Wrong? (cont.)
 Work hard to avoid influencing responses.
 Response bias refers to anything in the survey
design that influences the responses.
 For example, the wording of a question can influence
the responses.
Copyright © 2012 Pearson Canada Inc., Toronto, Ontario Slide 12- 19
How to Think About Biases
 Look for biases in any survey you encounter—
there’s no way to recover from a biased sample
of a survey that asks biased questions.
 Spend your time and resources reducing biases.
 If you possibly can, pretest your survey.
 Always report your sampling methods in detail.
Copyright © 2012 Pearson Canada Inc., Toronto, Ontario Slide 12- 20
What Have We Learned?
 A representative sample can offer us important insights
about populations.
 It’s the size of the sample, not its fraction of the larger
population, that determines the precision of the
statistics it yields.
 There are several ways to draw samples, all based on the
power of randomness to make them representative of the
population of interest:
 Simple Random Sample, Stratified Sample, Cluster
Sample, Systematic Sample, Multistage Sample
Copyright © 2012 Pearson Canada Inc., Toronto, Ontario Slide 12- 21
What Have We Learned? (cont.)
 Bias can destroy our ability to gain insights from
our sample:
 Nonresponse bias can arise when sampled
individuals will not or cannot respond.
 Response bias arises when respondents’
answers might be affected by external
influences, such as question wording or
interviewer behaviour.
Copyright © 2012 Pearson Canada Inc., Toronto, Ontario Slide 12- 22
What Have We Learned? (cont.)
 Bias can also arise from poor sampling methods:
 Voluntary response samples are almost always
biased and should be avoided and distrusted.
 Convenience samples are likely to be flawed
for similar reasons.
 Even with a reasonable design, sample frames
may not be representative.
 Undercoverage occurs when individuals from a
subgroup of the population are selected less often
than they should be.
Copyright © 2012 Pearson Canada Inc., Toronto, Ontario Slide 12- 23
What Have We Learned? (cont.)
 Finally, we must look for biases in any survey we
find and be sure to report our methods whenever
we perform a survey so that others can evaluate
the fairness and accuracy of our results.

Who’s who

  • 1.
    Copyright © 2012Pearson Canada Inc., Toronto, Ontario Slide 12- 1 Who’s Who?  The Who of a survey can refer to different groups, and the resulting ambiguity can tell you a lot about the success of a study.  To start, think about the population of interest. Often, you’ll find that this is not really a well- defined group.  Even if the population is clear, it may not be a practical group to study.
  • 2.
    Copyright © 2012Pearson Canada Inc., Toronto, Ontario Slide 12- 2 Who’s Who? (cont.)  Second, you must specify the sampling frame.  Usually, the sampling frame is not the group you really want to know about.  The sampling frame limits what your survey can find out.
  • 3.
    Copyright © 2012Pearson Canada Inc., Toronto, Ontario Slide 12- 3 Who’s Who? (cont.)  Then there’s your target sample.  These are the individuals for whom you intend to measure responses.  You’re not likely to get responses from all of them—nonresponse is a problem in many surveys.
  • 4.
    Copyright © 2012Pearson Canada Inc., Toronto, Ontario Slide 12- 4 Who’s Who? (cont.)  Finally, there is your sample—the actual respondents.  These are the individuals about whom you do get data and can draw conclusions.  Unfortunately, they might not be representative of the sample, the sampling frame, or the population.
  • 5.
    Copyright © 2012Pearson Canada Inc., Toronto, Ontario Slide 12- 5 Who’s Who? (cont.)  At each step, the group we can study may be constrained further.  The Who keeps changing, and each constraint can introduce biases.  A careful study should address the question of how well each group matches the population of interest.
  • 6.
    Copyright © 2012Pearson Canada Inc., Toronto, Ontario Slide 12- 6 Who’s Who? (cont.)  One of the main benefits of simple random sampling is that it never loses its sense of who’s Who.  The Who in an SRS is the population of interest from which we’ve drawn a representative sample. (That’s not always true for other kinds of samples.)
  • 7.
    Copyright © 2012Pearson Canada Inc., Toronto, Ontario Slide 12- 7 Who’s Who? (cont.)
  • 8.
    Copyright © 2012Pearson Canada Inc., Toronto, Ontario Slide 12- 8 The Valid Survey  It isn’t sufficient to just draw a sample and start asking questions. Before you set out to survey, ask yourself:  What do I want to know?  Am I asking the right respondents?  Am I asking the right questions?  What would I do with the answers if I had them; would they address the things I want to know?
  • 9.
    Copyright © 2012Pearson Canada Inc., Toronto, Ontario Slide 12- 9 These questions may sound obvious, but they are a number of pitfalls to avoid.  Know what you want to know.  Understand what you hope to learn and from whom you hope to learn it.  Use the right frame.  Be sure you have a suitable sample frame.  Time your instrument.  The survey instrument itself can be the source of errors. The Valid Survey (cont.)
  • 10.
    Copyright © 2012Pearson Canada Inc., Toronto, Ontario Slide 12- 10  Ask specific rather than general questions.  Ask for quantitative results when possible.  Be careful in phrasing questions.  A respondent may not understand the question or may understand the question differently than the way the researcher intended it.  Even subtle differences in phrasing can make a difference. The Valid Survey (cont.)
  • 11.
    Copyright © 2012Pearson Canada Inc., Toronto, Ontario Slide 12- 11 The Valid Survey (cont.)  Be careful in phrasing answers.  It’s often a better idea to offer choices rather than inviting a free response.
  • 12.
    Copyright © 2012Pearson Canada Inc., Toronto, Ontario Slide 12- 12  The best way to protect a survey from unanticipated measurement errors is to perform a pilot survey.  A pilot is a trial run of a survey you eventually plan to give to a larger group. The Valid Survey (cont.)
  • 13.
    Copyright © 2012Pearson Canada Inc., Toronto, Ontario Slide 12- 13 What Can Go Wrong?—or How to Sample Badly  Sample Badly with Volunteers:  In a voluntary response sample, a large group of individuals is invited to respond, and all who do respond are counted.  Voluntary response samples are almost always biased, and so conclusions drawn from them are almost always wrong.  Voluntary response samples are often biased toward those with strong opinions or those who are strongly motivated.  Since the sample is not representative, the resulting voluntary response bias invalidates the survey.
  • 14.
    Copyright © 2012Pearson Canada Inc., Toronto, Ontario Slide 12- 14 What Can Go Wrong?—or How to Sample Badly (cont.)  Sample Badly, but Conveniently:  In convenience sampling, we simply include the individuals who are convenient.  Unfortunately, this group may not be representative of the population.  Convenience sampling is not only a problem for students or other beginning samplers.  In fact, it is a widespread problem in the business world—the easiest people for a company to sample are its own customers.
  • 15.
    Copyright © 2012Pearson Canada Inc., Toronto, Ontario Slide 12- 15 What Can Go Wrong?—or How to Sample Badly (cont.)  Sample from a Bad Sampling Frame:  An SRS from an incomplete sampling frame introduces bias because the individuals included may differ from the ones not in the frame.  Undercoverage:  Many of these bad survey designs suffer from undercoverage, in which some portion of the population is not sampled at all or has a smaller representation in the sample than it has in the population.  Undercoverage can arise for a number of reasons, but it’s always a potential source of bias.
  • 16.
    Copyright © 2012Pearson Canada Inc., Toronto, Ontario Slide 12- 16 What Else Can Go Wrong?  Watch out for nonrespondents.  A common and serious potential source of bias for most surveys is nonresponse bias.  No survey succeeds in getting responses from everyone.  The problem is that those who don’t respond may differ from those who do.  And they may differ on just the variables we care about.
  • 17.
    Copyright © 2012Pearson Canada Inc., Toronto, Ontario Slide 12- 17 What Else Can Go Wrong? (cont.)  Don’t bore respondents with surveys that go on and on and on and on…  Surveys that are too long are more likely to be refused, reducing the response rate and biasing all the results.
  • 18.
    Copyright © 2012Pearson Canada Inc., Toronto, Ontario Slide 12- 18 What Else Can Go Wrong? (cont.)  Work hard to avoid influencing responses.  Response bias refers to anything in the survey design that influences the responses.  For example, the wording of a question can influence the responses.
  • 19.
    Copyright © 2012Pearson Canada Inc., Toronto, Ontario Slide 12- 19 How to Think About Biases  Look for biases in any survey you encounter— there’s no way to recover from a biased sample of a survey that asks biased questions.  Spend your time and resources reducing biases.  If you possibly can, pretest your survey.  Always report your sampling methods in detail.
  • 20.
    Copyright © 2012Pearson Canada Inc., Toronto, Ontario Slide 12- 20 What Have We Learned?  A representative sample can offer us important insights about populations.  It’s the size of the sample, not its fraction of the larger population, that determines the precision of the statistics it yields.  There are several ways to draw samples, all based on the power of randomness to make them representative of the population of interest:  Simple Random Sample, Stratified Sample, Cluster Sample, Systematic Sample, Multistage Sample
  • 21.
    Copyright © 2012Pearson Canada Inc., Toronto, Ontario Slide 12- 21 What Have We Learned? (cont.)  Bias can destroy our ability to gain insights from our sample:  Nonresponse bias can arise when sampled individuals will not or cannot respond.  Response bias arises when respondents’ answers might be affected by external influences, such as question wording or interviewer behaviour.
  • 22.
    Copyright © 2012Pearson Canada Inc., Toronto, Ontario Slide 12- 22 What Have We Learned? (cont.)  Bias can also arise from poor sampling methods:  Voluntary response samples are almost always biased and should be avoided and distrusted.  Convenience samples are likely to be flawed for similar reasons.  Even with a reasonable design, sample frames may not be representative.  Undercoverage occurs when individuals from a subgroup of the population are selected less often than they should be.
  • 23.
    Copyright © 2012Pearson Canada Inc., Toronto, Ontario Slide 12- 23 What Have We Learned? (cont.)  Finally, we must look for biases in any survey we find and be sure to report our methods whenever we perform a survey so that others can evaluate the fairness and accuracy of our results.