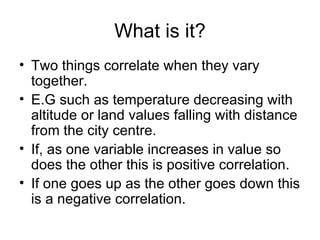
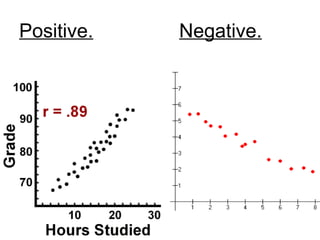
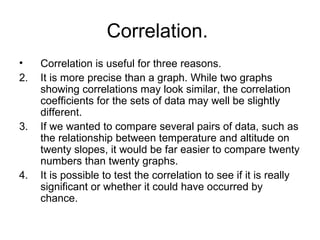
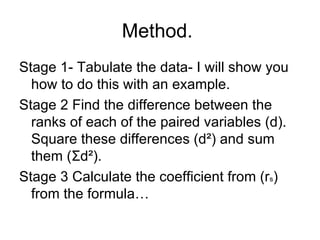
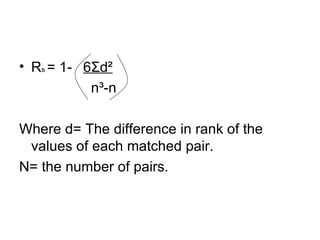
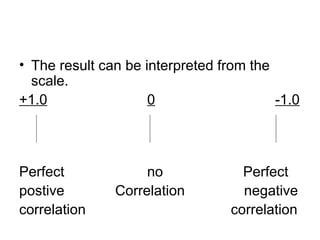
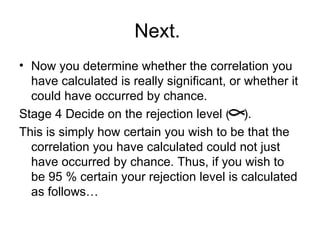
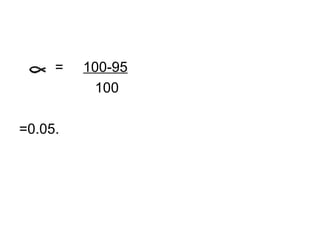
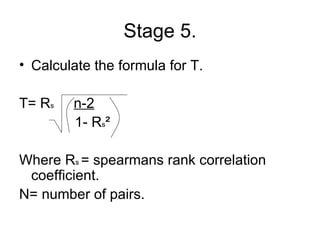
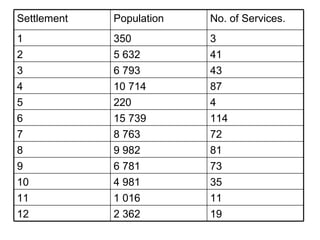
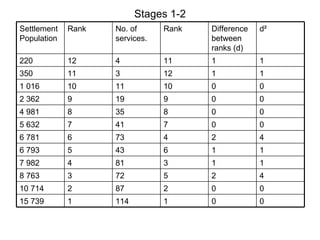
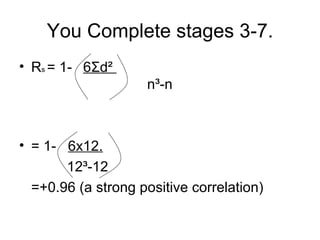
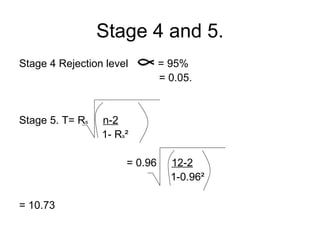
Correlation.
What is it? Two things correlate when they vary together.  E.G such as temperature decreasing with altitude or land values falling with distance from the city centre. If, as one variable increases in value so does the other this is positive correlation. If one goes up as the other goes down this is a negative correlation.
Positive. Negative.
Correlation.  Correlation is useful for three reasons. It is more precise than a graph. While two graphs showing correlations may look similar, the correlation coefficients for the sets of data may well be slightly different. If we wanted to compare several pairs of data, such as the relationship between temperature and altitude on twenty slopes, it would be far easier to compare twenty numbers than twenty graphs.  It is possible to test the correlation to see if it is really significant or whether it could have occurred by chance.
WARNING!!!!!!. The fact that two things correlate proves nothing. We can never conclude from statistical evidence alone that, because two things correlate, one must be affecting the other.  All statistical tests must be supplemented with research regardless of the result.
Spearmans Rank.  This technique is among the most reliable methods of calculating a correlation coefficient.  This is a number which will summarise the strength and direction of any correlation between two variables.
Method.  Stage 1- Tabulate the data- I will show you how to do this with an example.  Stage 2 Find the difference between the ranks of each of the paired variables (d). Square these differences (d ²) and sum them ( Σ d ²). Stage 3 Calculate the coefficient from (r s ) from the formula…
R s  = 1-  6 Σ d ²   n ³-n Where d= The difference in rank of the values of each matched pair.  N= the number of pairs.
The result can be interpreted from the scale.  +1.0 0 -1.0   Perfect no Perfect postive Correlation  negative correlation   correlation
Next.  Now you determine whether the correlation you have calculated is really significant, or whether it could have occurred by chance. Stage 4 Decide on the rejection level (  ).  This is simply how certain you wish to be that the correlation you have calculated could not just have occurred by chance. Thus, if you wish to be 95 % certain your rejection level is calculated as follows…
 = 100-95   100 =0.05.
Stage 5. Calculate the formula for T.  T=  R s   n-2   1-  R s ²  Where R s  = spearmans rank correlation coefficient. N= number of pairs.
Calculate the degrees of freedom.  Df = n-2.  Where n = the number of pairs.
Stage 7 Look up the critical value in the t- table using the degrees of freedom and the rejection level.  If the critical value is less than your t-value then the correlation is significant at the level chosen (95 %).
But what if my critical value is higher than my t value??? This means that you cannot be certain that the correlation could not have occurred by chance. This may mean one of two things. A- The relationship is not a good one and it is thus not really worth pursuing it any further.  B- The size of the sample you are using is too small to permit you to prove correlation.
Example.  Population size and number of services in each of 12 settlements.  Draw a graph for the following data set…
19 2 362 12 11 1 016 11 35 4 981 10 73 6 781 9 81 9 982 8 72 8 763 7 114 15 739 6 4 220 5 87 10 714 4 43 6 793 3 41 5 632 2 3 350 1 No. of Services.  Population Settlement
Stages 1-2 0 0 1 114 1 15 739 0 0 2 87 2 10 714 4 2 5 72 3 8 763 1 1 3 81 4 7 982 1 1 6 43 5 6 793 4 2 4 73 6 6 781 0 0 7 41 7 5 632 0 0 8 35 8 4 981 0 0 9 19 9 2 362 0 0 10 11 10 1 016 1 1 12 3 11 350 1 1 11 4 12 220 d ² Difference between ranks (d) Rank No. of services. Rank Settlement Population
You Complete stages 3-7. R s  = 1-  6 Σ d ²    n ³-n = 1-  6x12.   12³-12  =+0.96 (a strong positive correlation)
Stage 4 and 5. Stage 4 Rejection level  = 95%   = 0.05. Stage 5. T=  R s   n-2   1-  R s ²  = 0.96  12-2   1-0.96² = 10.73
Stage 6 and 7 Stage 6 Df= (n-2) = (12-2) = 10. Stage 7 df = 10   Rejection value = 0.05   Therefore critical value of t =2.23. The critical value is less than our t- value (10.73). We can therefore conclude that there is a significant correlation between settlement size and the number of services offered in each.

Correlation

  • 1.
  • 2.
    What is it?Two things correlate when they vary together. E.G such as temperature decreasing with altitude or land values falling with distance from the city centre. If, as one variable increases in value so does the other this is positive correlation. If one goes up as the other goes down this is a negative correlation.
  • 3.
  • 4.
    Correlation. Correlationis useful for three reasons. It is more precise than a graph. While two graphs showing correlations may look similar, the correlation coefficients for the sets of data may well be slightly different. If we wanted to compare several pairs of data, such as the relationship between temperature and altitude on twenty slopes, it would be far easier to compare twenty numbers than twenty graphs. It is possible to test the correlation to see if it is really significant or whether it could have occurred by chance.
  • 5.
    WARNING!!!!!!. The factthat two things correlate proves nothing. We can never conclude from statistical evidence alone that, because two things correlate, one must be affecting the other. All statistical tests must be supplemented with research regardless of the result.
  • 6.
    Spearmans Rank. This technique is among the most reliable methods of calculating a correlation coefficient. This is a number which will summarise the strength and direction of any correlation between two variables.
  • 7.
    Method. Stage1- Tabulate the data- I will show you how to do this with an example. Stage 2 Find the difference between the ranks of each of the paired variables (d). Square these differences (d ²) and sum them ( Σ d ²). Stage 3 Calculate the coefficient from (r s ) from the formula…
  • 8.
    R s = 1- 6 Σ d ² n ³-n Where d= The difference in rank of the values of each matched pair. N= the number of pairs.
  • 9.
    The result canbe interpreted from the scale. +1.0 0 -1.0 Perfect no Perfect postive Correlation negative correlation correlation
  • 10.
    Next. Nowyou determine whether the correlation you have calculated is really significant, or whether it could have occurred by chance. Stage 4 Decide on the rejection level ( ). This is simply how certain you wish to be that the correlation you have calculated could not just have occurred by chance. Thus, if you wish to be 95 % certain your rejection level is calculated as follows…
  • 11.
    = 100-95 100 =0.05.
  • 12.
    Stage 5. Calculatethe formula for T. T= R s n-2 1- R s ² Where R s = spearmans rank correlation coefficient. N= number of pairs.
  • 13.
    Calculate the degreesof freedom. Df = n-2. Where n = the number of pairs.
  • 14.
    Stage 7 Lookup the critical value in the t- table using the degrees of freedom and the rejection level. If the critical value is less than your t-value then the correlation is significant at the level chosen (95 %).
  • 15.
    But what ifmy critical value is higher than my t value??? This means that you cannot be certain that the correlation could not have occurred by chance. This may mean one of two things. A- The relationship is not a good one and it is thus not really worth pursuing it any further. B- The size of the sample you are using is too small to permit you to prove correlation.
  • 16.
    Example. Populationsize and number of services in each of 12 settlements. Draw a graph for the following data set…
  • 17.
    19 2 36212 11 1 016 11 35 4 981 10 73 6 781 9 81 9 982 8 72 8 763 7 114 15 739 6 4 220 5 87 10 714 4 43 6 793 3 41 5 632 2 3 350 1 No. of Services. Population Settlement
  • 18.
    Stages 1-2 00 1 114 1 15 739 0 0 2 87 2 10 714 4 2 5 72 3 8 763 1 1 3 81 4 7 982 1 1 6 43 5 6 793 4 2 4 73 6 6 781 0 0 7 41 7 5 632 0 0 8 35 8 4 981 0 0 9 19 9 2 362 0 0 10 11 10 1 016 1 1 12 3 11 350 1 1 11 4 12 220 d ² Difference between ranks (d) Rank No. of services. Rank Settlement Population
  • 19.
    You Complete stages3-7. R s = 1- 6 Σ d ² n ³-n = 1- 6x12. 12³-12 =+0.96 (a strong positive correlation)
  • 20.
    Stage 4 and5. Stage 4 Rejection level = 95% = 0.05. Stage 5. T= R s n-2 1- R s ² = 0.96 12-2 1-0.96² = 10.73
  • 21.
    Stage 6 and7 Stage 6 Df= (n-2) = (12-2) = 10. Stage 7 df = 10 Rejection value = 0.05 Therefore critical value of t =2.23. The critical value is less than our t- value (10.73). We can therefore conclude that there is a significant correlation between settlement size and the number of services offered in each.