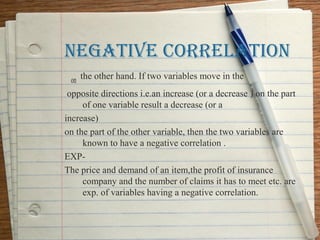
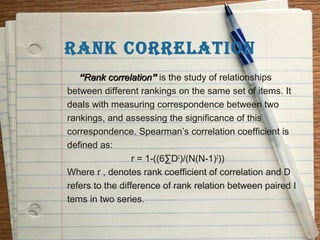
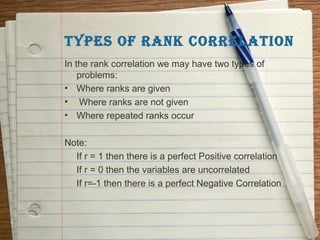
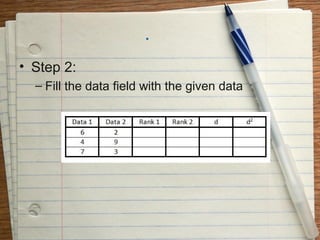
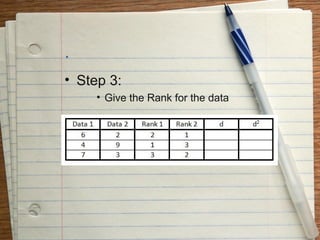
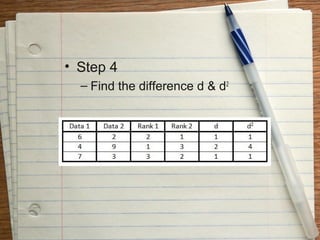
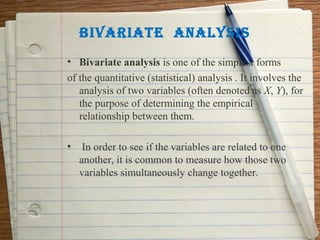
PRESENTATION ON
      CORRELATION
   RANK CORRELATION
   BIVARITE ANANLSIS
           &
     CHI SQURE TEST

PRESENTED BY-SUMIT BHARTI
CORRELATION
Definition:
  while studying two variables at the same time,if it
  is found that the change in one variable is
  reciprocated by a corresponding change in the
  other variable either directly or inversely ,then the
  two variables are known to be associated or
  correlated.

In correlation analysis ,we must be careful about a
   cause and effect relation between the two
   variables.
example
   If the quantities(X,Y) vary in such a way that
   change in one variable corresponds to
   change in the other variable then the variables
   X and Y are correlated.
Types of Correlation:
        The important ways of classifying the
correlation are:
1.      Positive correlation
2.      negative correlation
POSITIVE CORRELATION
If two variables move in the same direction i.e.an increase (or
    decrease) on the part of one variable introduces an
    increase(or decrease)on the part of the other variable, then
    the two variablea are known to be positively correlated.
As for example,
  profit and investment, Height and weight,yield and rainfall
    etc are positively correlated.
NEgATIVE CORRELATION
  on the other hand. If two variables move in the
 opposite directions i.e.an increase (or a decrease ) on the part
      of one variable result a decrease (or a
increase)
on the part of the other variable, then the two variables are
      known to have a negative correlation .
EXP-
The price and demand of an item,the profit of insurance
      company and the number of claims it has to meet etc. are
      exp. of variables having a negative correlation.
RANK CORRELATION
   “Rank correlation” is the study of relationships
between different rankings on the same set of items. It
deals with measuring correspondence between two
rankings, and assessing the significance of this
correspondence. Spearman’s correlation coefficient is
defined as:
                  r = 1-((6∑D2)/(N(N-1)2))
Where r , denotes rank coefficient of correlation and D
refers to the difference of rank relation between paired I
tems in two series.
TYPES OF RANK CORRELATION
In the rank correlation we may have two types of
    problems:
• Where ranks are given
• Where ranks are not given
• Where repeated ranks occur

Note:
  If r = 1 then there is a perfect Positive correlation
  If r = 0 then the variables are uncorrelated
  If r=-1 then there is a perfect Negative Correlation
Steps To Find RC
• Step 1:
  – Draw the table like
.
• Step 2:
  – Fill the data field with the given data
.
• Step 3:
     • Give the Rank for the data
• Step 4
  – Find the difference d & d2
• Step 5:
  – Apply the formula:


                     r=


            Where d= difference, n=no.of data
BIVARIATE ANALYSIS
• Bivariate analysis is one of the simplest forms
of the quantitative (statistical) analysis . It involves the
   analysis of two variables (often denoted as X, Y), for
   the purpose of determining the empirical
   relationship between them.

•    In order to see if the variables are related to one
    another, it is common to measure how those two
    variables simultaneously change together.
Bivariate analysis can be contrasted with
  univariate analysis in which only one
  variable is analysed. Furthermore, the
  purpose of a univariate analysis is
  descriptive. The major differentiating
  point between univariate and bivariate
  analysis, in univariate there is only one
  variable is analysed. Where as bivariate
  is the analysis of the relationship
  between the two variables.
EXAMPLE

A businessman may be keen to know what
amount of investment Would yield a desired level
  of pofite.


Student may want know whether performing
  better in the selection test would enhance his
  or her chance of doing well in final examination
CHI-SQUARE TEST

  a chi square test is an statistical hypothesis test in
  which the test statistic has a chi square distribution
  when the null hypthepothesis is true, or any in which
  the probability distribution of the test
  statistic(assuming null hypothesis is true) can be
  made to approximate a chi square
Distribution as closely as desired by making the sample
  size large enough.
STEP OF CHI SQUARE TEST
  (i)Calculate the expected frequency (E)

  (ii)Compute the deviation (0-E)and then square
      these deviation to obtain (O-E)2.

  (iii)
          divide the square deviation i.e. (O-E)2
           by the corresponding expected frequency .
                          (O-E)2
                  E
.
(iv) Obtain the sum of all value
   computed in the step (iii) to
   compute
• This gives the value of X2 , if it is zero
  multiplies that there is no
  discrepancy between the observed
  and the expected frequencies.
• The greater the value of X2 the
  greater will be discrepancy between
  the observed and expected
  frequencies.
.
(v)Then check the degree of freedom =
  n-1
(vi) Compare the calculated value of X 2
  with table value if it is less than the
  table value then it will be accepted if it
  is more than table value then it will be
  rejected.
Sumit presentation

Sumit presentation

  • 1.
    PRESENTATION ON CORRELATION RANK CORRELATION BIVARITE ANANLSIS & CHI SQURE TEST PRESENTED BY-SUMIT BHARTI
  • 2.
    CORRELATION Definition: whilestudying two variables at the same time,if it is found that the change in one variable is reciprocated by a corresponding change in the other variable either directly or inversely ,then the two variables are known to be associated or correlated. In correlation analysis ,we must be careful about a cause and effect relation between the two variables.
  • 3.
    example If the quantities(X,Y) vary in such a way that change in one variable corresponds to change in the other variable then the variables X and Y are correlated. Types of Correlation: The important ways of classifying the correlation are: 1. Positive correlation 2. negative correlation
  • 4.
    POSITIVE CORRELATION If twovariables move in the same direction i.e.an increase (or decrease) on the part of one variable introduces an increase(or decrease)on the part of the other variable, then the two variablea are known to be positively correlated. As for example, profit and investment, Height and weight,yield and rainfall etc are positively correlated.
  • 5.
    NEgATIVE CORRELATION on the other hand. If two variables move in the opposite directions i.e.an increase (or a decrease ) on the part of one variable result a decrease (or a increase) on the part of the other variable, then the two variables are known to have a negative correlation . EXP- The price and demand of an item,the profit of insurance company and the number of claims it has to meet etc. are exp. of variables having a negative correlation.
  • 6.
    RANK CORRELATION “Rank correlation” is the study of relationships between different rankings on the same set of items. It deals with measuring correspondence between two rankings, and assessing the significance of this correspondence. Spearman’s correlation coefficient is defined as: r = 1-((6∑D2)/(N(N-1)2)) Where r , denotes rank coefficient of correlation and D refers to the difference of rank relation between paired I tems in two series.
  • 7.
    TYPES OF RANKCORRELATION In the rank correlation we may have two types of problems: • Where ranks are given • Where ranks are not given • Where repeated ranks occur Note: If r = 1 then there is a perfect Positive correlation If r = 0 then the variables are uncorrelated If r=-1 then there is a perfect Negative Correlation
  • 8.
    Steps To FindRC • Step 1: – Draw the table like
  • 9.
    . • Step 2: – Fill the data field with the given data
  • 10.
    . • Step 3: • Give the Rank for the data
  • 11.
    • Step 4 – Find the difference d & d2
  • 12.
    • Step 5: – Apply the formula: r= Where d= difference, n=no.of data
  • 13.
    BIVARIATE ANALYSIS • Bivariateanalysis is one of the simplest forms of the quantitative (statistical) analysis . It involves the analysis of two variables (often denoted as X, Y), for the purpose of determining the empirical relationship between them. • In order to see if the variables are related to one another, it is common to measure how those two variables simultaneously change together.
  • 14.
    Bivariate analysis canbe contrasted with univariate analysis in which only one variable is analysed. Furthermore, the purpose of a univariate analysis is descriptive. The major differentiating point between univariate and bivariate analysis, in univariate there is only one variable is analysed. Where as bivariate is the analysis of the relationship between the two variables.
  • 15.
    EXAMPLE A businessman maybe keen to know what amount of investment Would yield a desired level of pofite. Student may want know whether performing better in the selection test would enhance his or her chance of doing well in final examination
  • 16.
    CHI-SQUARE TEST a chi square test is an statistical hypothesis test in which the test statistic has a chi square distribution when the null hypthepothesis is true, or any in which the probability distribution of the test statistic(assuming null hypothesis is true) can be made to approximate a chi square Distribution as closely as desired by making the sample size large enough.
  • 17.
    STEP OF CHISQUARE TEST (i)Calculate the expected frequency (E) (ii)Compute the deviation (0-E)and then square these deviation to obtain (O-E)2. (iii) divide the square deviation i.e. (O-E)2 by the corresponding expected frequency . (O-E)2 E
  • 18.
    . (iv) Obtain thesum of all value computed in the step (iii) to compute
  • 19.
    • This givesthe value of X2 , if it is zero multiplies that there is no discrepancy between the observed and the expected frequencies. • The greater the value of X2 the greater will be discrepancy between the observed and expected frequencies.
  • 20.
    . (v)Then check thedegree of freedom = n-1 (vi) Compare the calculated value of X 2 with table value if it is less than the table value then it will be accepted if it is more than table value then it will be rejected.