
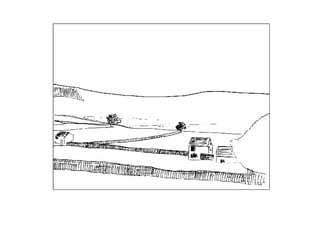


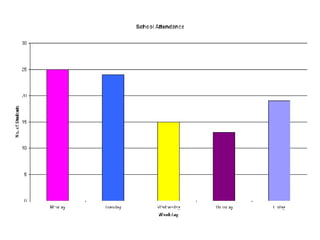

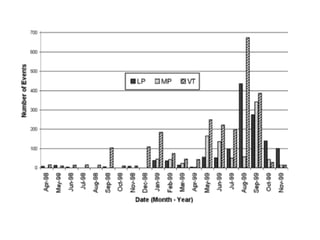

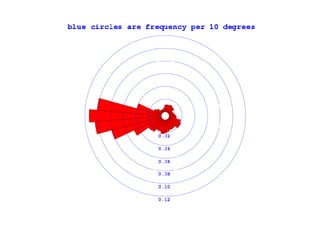

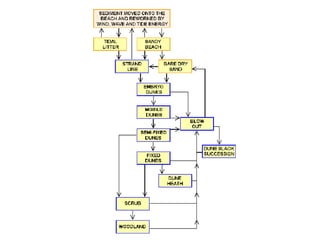

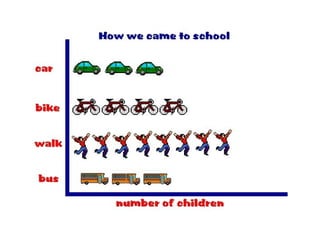

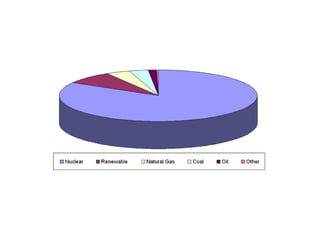
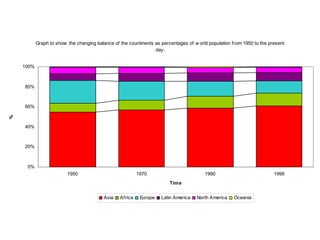

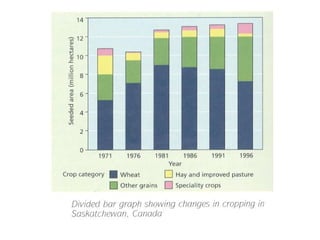

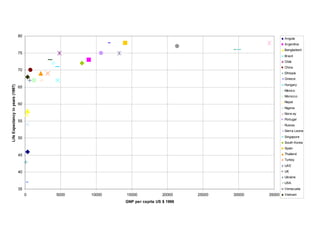

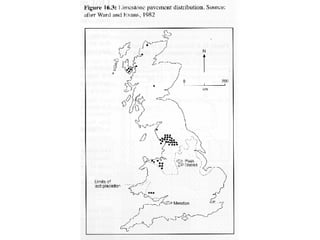
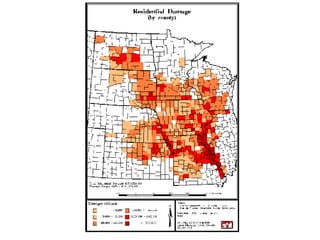

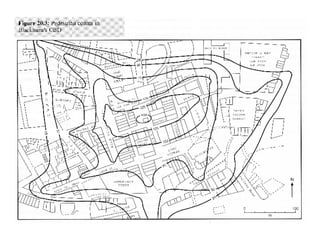

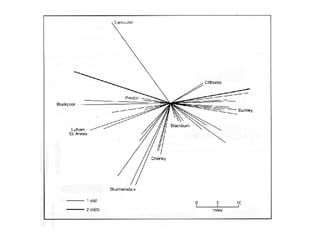

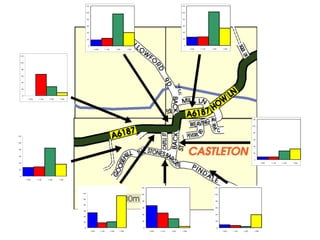

This document lists various types of diagrams and charts that can be used to present fieldwork data, including field sketches, annotated photographs, bar charts, histograms, wind rose diagrams, line graphs, flow diagrams, pictograms, pie charts, composite bar charts, divided bar charts, scattergraphs, dot graphs, choropleth maps, isolines, desire lines, and complex diagrams.