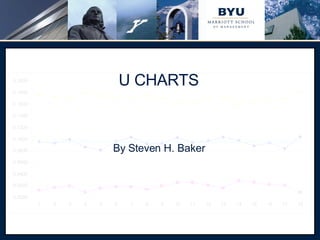

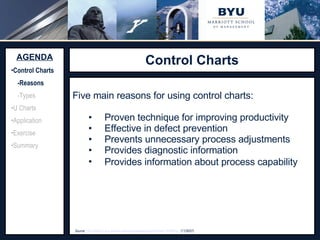
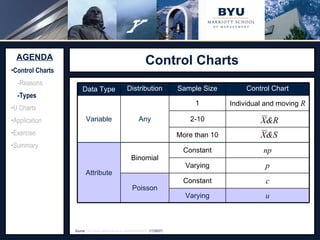
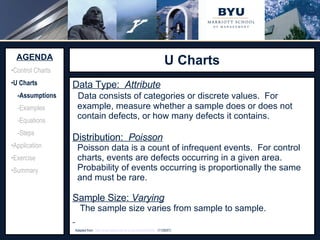
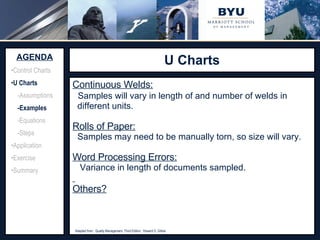
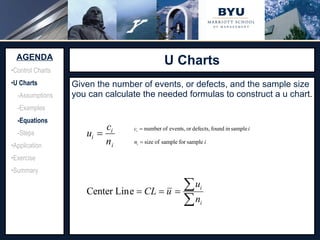
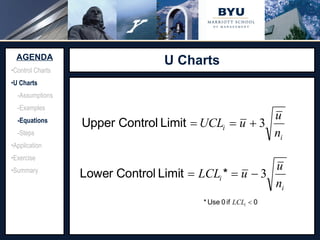
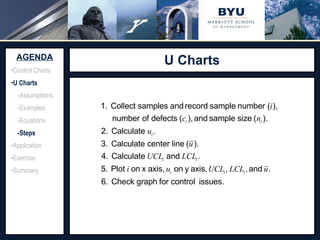
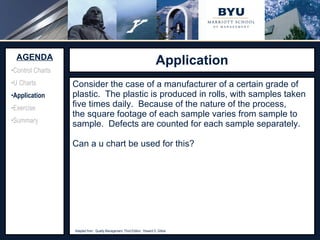
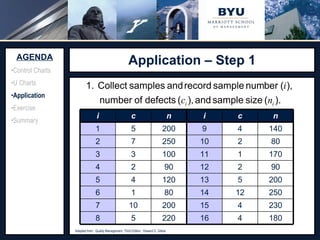

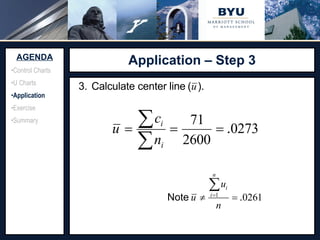

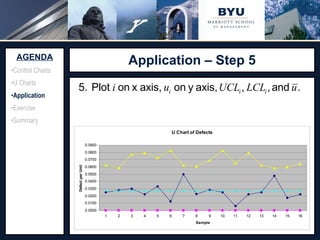
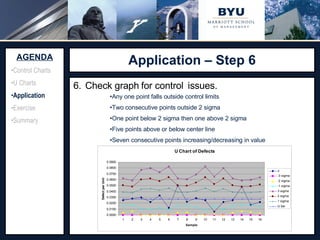
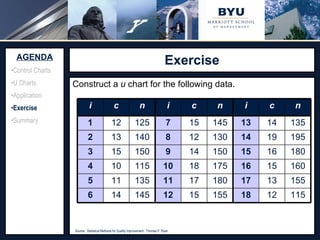
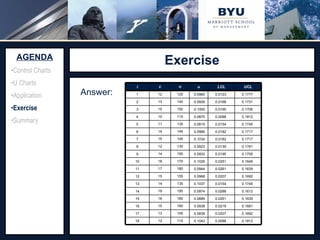
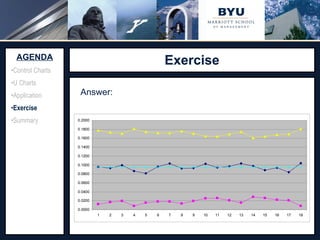
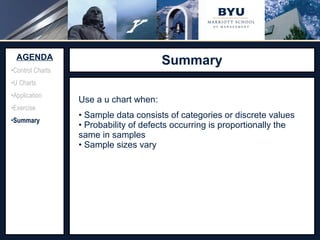
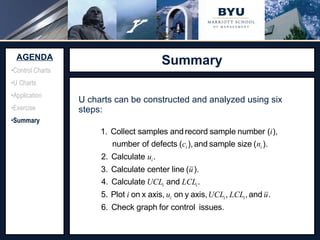

The document discusses U charts, which are a type of control chart used for attribute data where the sample sizes vary. It explains the reasons for using control charts, provides examples of when U charts can be used, and outlines the steps to construct and interpret a U chart, including defining the formulas, control limits, and how to identify special causes of variation. An exercise is included to have the reader construct a U chart for a given dataset.


![Key Business Factors[1]](https://cdn.slidesharecdn.com/ss_thumbnails/keybusinessfactors1-1226089724672234-9-thumbnail.jpg?width=640&height=640&fit=bounds)


![Control Charts[1]](https://cdn.slidesharecdn.com/ss_thumbnails/controlcharts1-1226081330857138-9-thumbnail.jpg?width=640&height=640&fit=bounds)
![Control Charts[1]](https://cdn.slidesharecdn.com/ss_thumbnails/controlcharts1-1226961283054520-8-thumbnail.jpg?width=640&height=640&fit=bounds)


![Control charts[1]](https://cdn.slidesharecdn.com/ss_thumbnails/controlcharts1-100924110931-phpapp01-thumbnail.jpg?width=640&height=640&fit=bounds)


