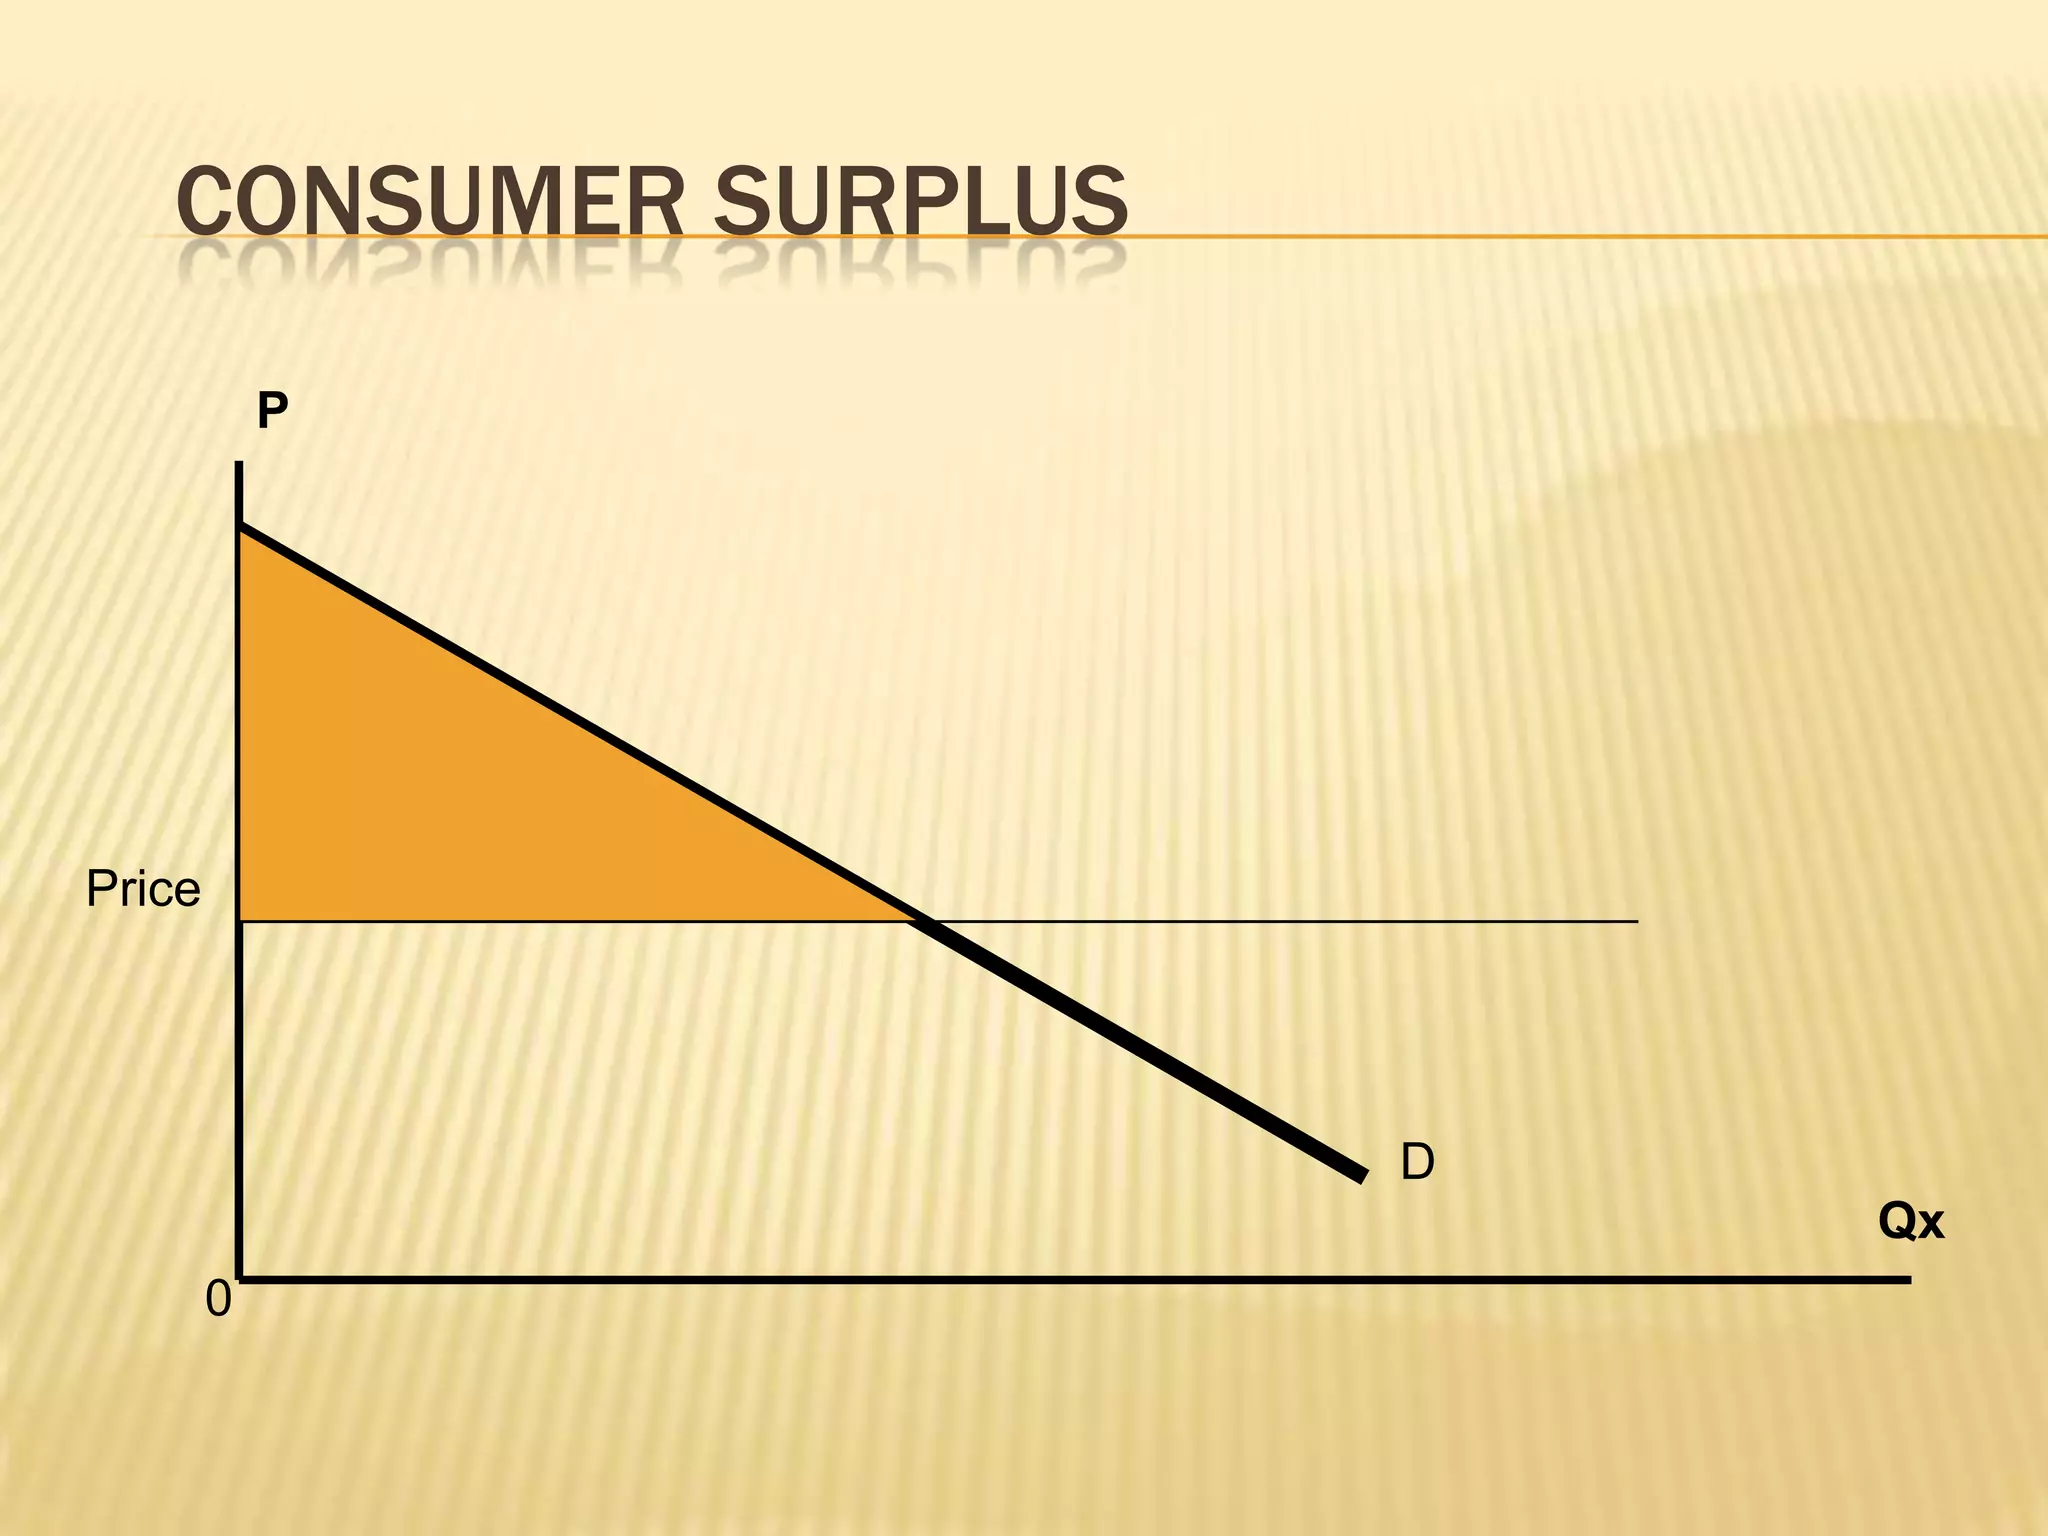
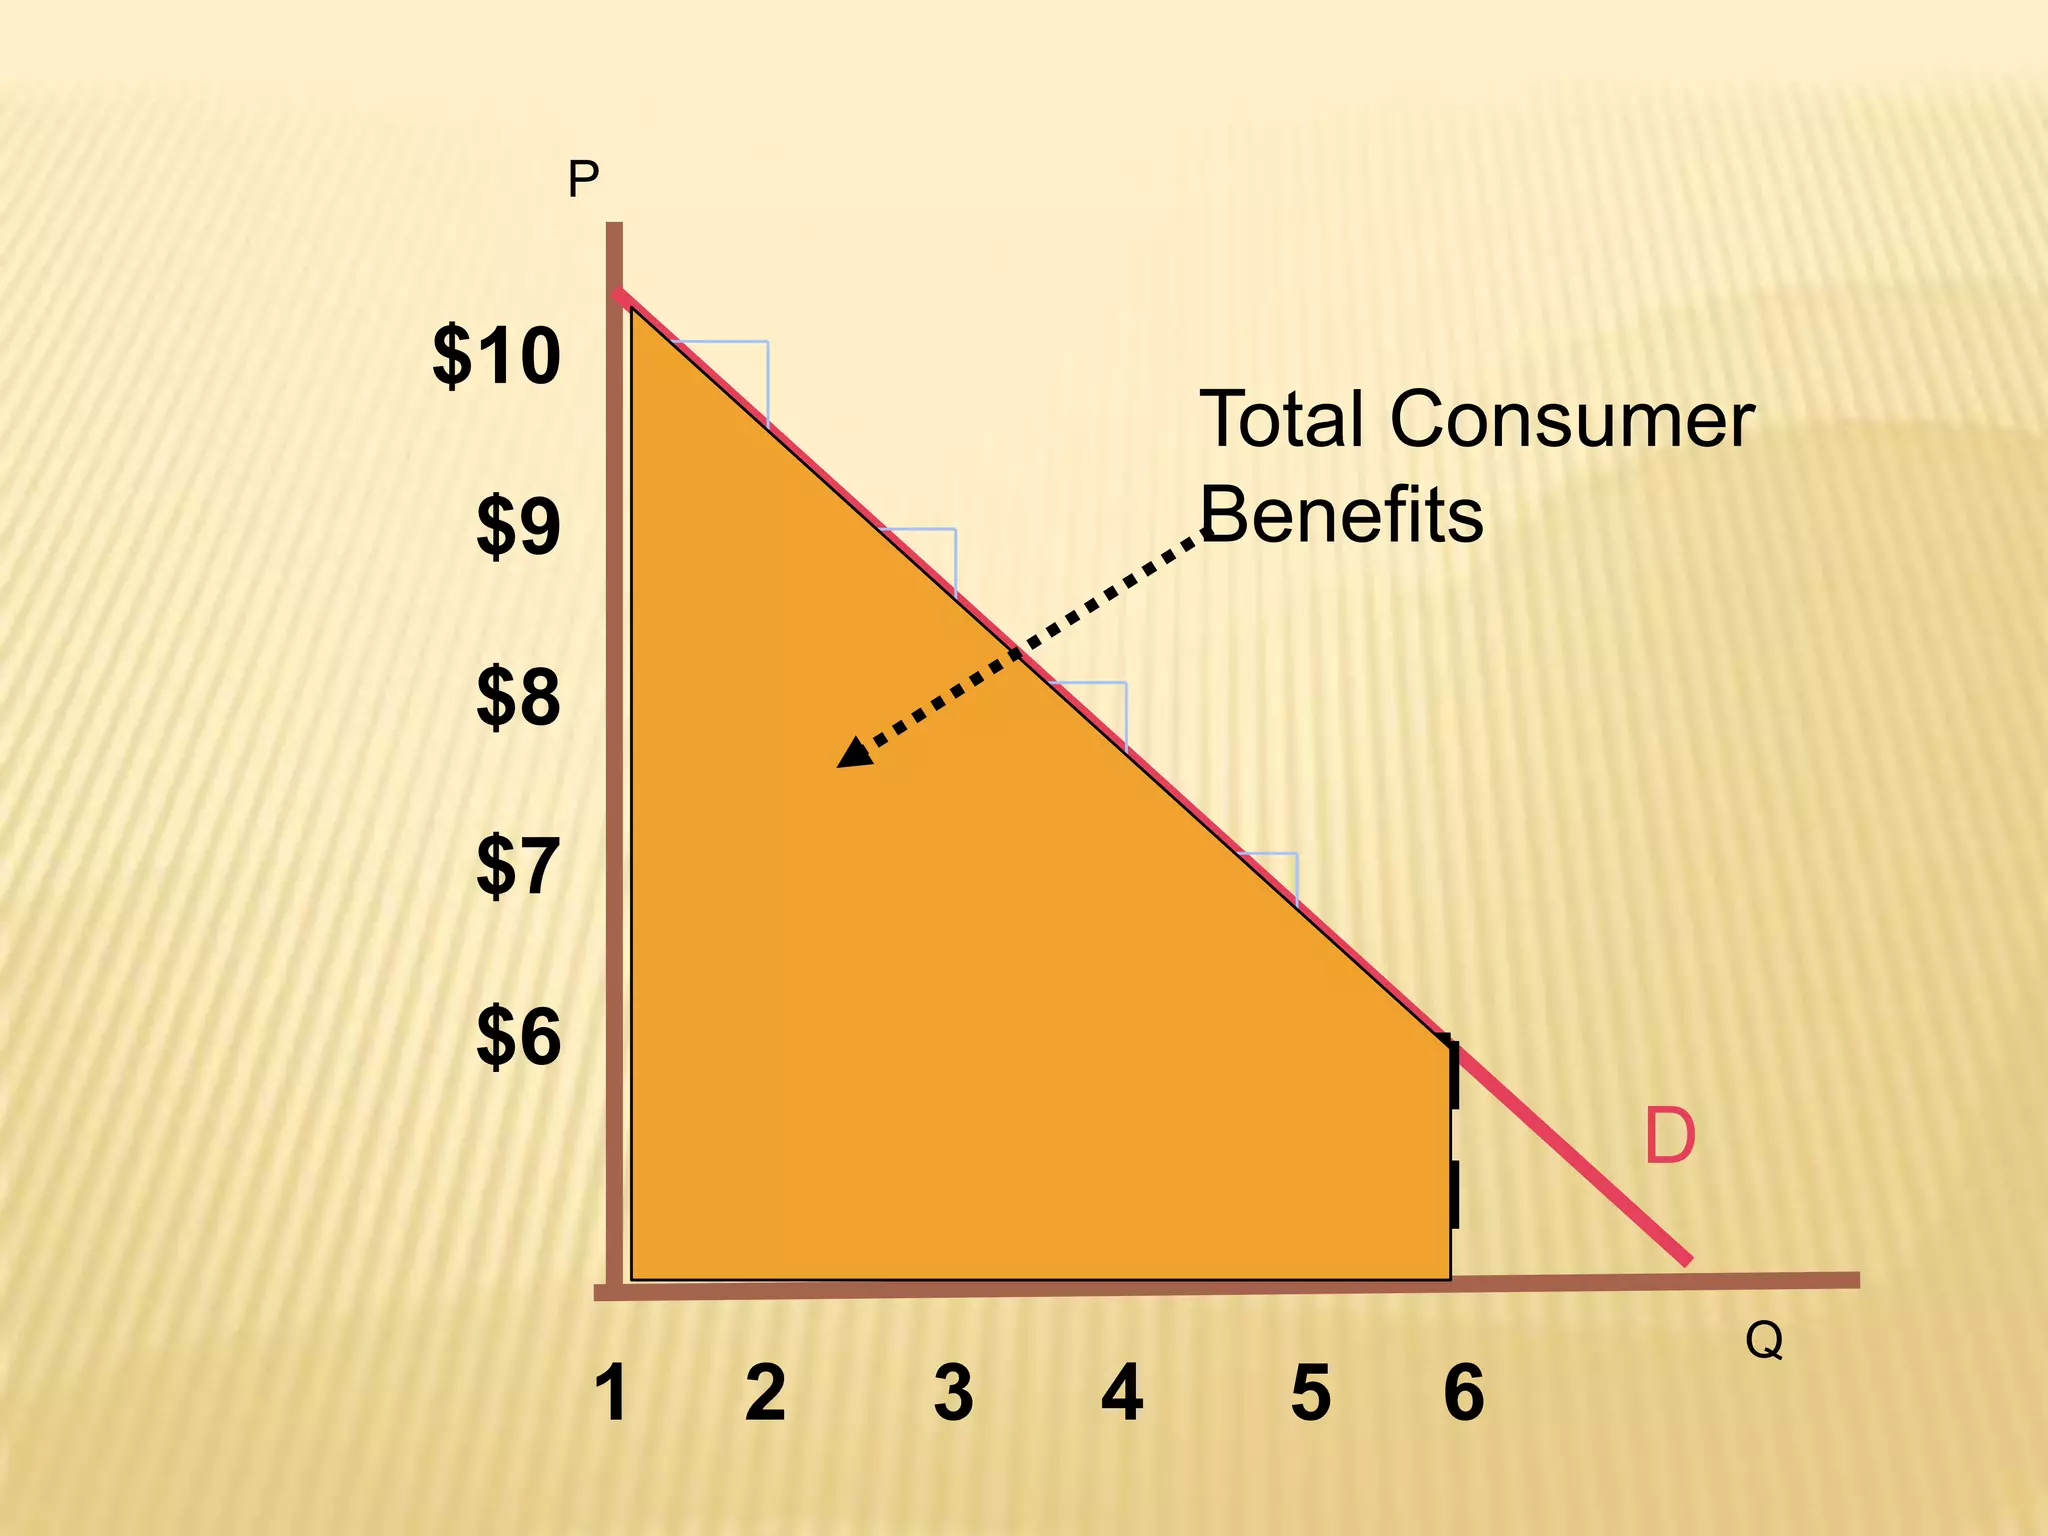
1) Consumer surplus measures how much better off consumers are from purchasing goods that provide them utility, which is the difference between what consumers are willing to pay and the actual price they pay.
2) Consumer surplus can be measured for each unit purchased and is the total surplus from summing the surplus of each individual unit.
3) Graphically, consumer surplus is represented by the area above the price line and below the demand curve up to the quantity purchased. A lower price increases consumer surplus while a higher price decreases it.
1. CONSUMER SURPLUS
Consumers buy goods because it makes
them better off (or provide utility). Consumer
Surplus measures how much better off they
are.
Consumer Surplus
from each unit: The amount a buyer is
willing to pay for a good minus the amount
the buyer actually pays for it.
3. CONSUMER SURPLUS AND DEMAND
Consumer surplus for a given quantity is
therefore the difference between your
maximum willingness to pay (reservation
price) and what you actually paid (actual
price).
CS = the sum of the difference between MB
and MC (price) for all units consumed
4. CONSUMER SURPLUS
EXAMPLE
What happens when you purchase
something for a price that is less than your
maximum willingness to pay?
E.g. you are willing to pay $20,000 for a new
car and you buy it for 18,000
You receive a “surplus” of benefit over cost =
$2,000
5. CONSUMER SURPLUS - EXAMPLE
Assume a student wants to buy concert tickets.
Demand curve tells us the student’s willingness
to pay for each concert ticket
1st ticket worth $20 but price is $14 so
student generates $6 worth of surplus.
We can measure this for each ticket.
Total surplus is sum of surplus from each
ticket purchased.
6. CONSUMER SURPLUS - EXAMPLE
Price The consumer surplus
($ per 20 of purchasing 6 concert
ticket)
19 tickets is the sum of the
surplus derived from
18 each one individually.
17
16
Consumer Surplus
15
6 + 5 + 4 + 3 + 2 + 1 = 21
14 Market Price
13 Will not buy more than 7
because surplus from
additional ticket is negative
0 1 2 3 4 5 6 Rock Concert Tickets
7. CONSUMER SURPLUS
The stepladder demand curve can be converted
into a straight-line demand curve by making the
units of the good smaller.
Consumer surplus measures the total net
benefit to consumers = total benefits from
consumption minus the total expenses.
Thus, consumer surplus is area under the
demand curve and above the price.
Note that the area under the demand curve up
to the level of consumption measures the total
benefits.
8. CONSUMER SURPLUS
Price
($ per
ticket)
20
Consumer
Surplus
14 Market Price
Demand Curve
Actual
Expenditure
0 1 2 3 4 5 6
Rock Concert Tickets
9. P
$10
Total Consumer
$9 Benefits
$8
$7
$6
D
Q
1 2 3 4 5 6
10. CONSUMER SURPLUS
Price
($ per
ticket)
20
Consumer
Surplus
14 Market Price
Demand Curve
Actual
Expenditure
0 1 2 3 4 5 6
Rock Concert Tickets
11. CONSUMER SURPLUS AND DEMAND
Graphically then, CS is the area above the
price line and below the demand curve, up to
Q*
P
40
Here, CS = $200 S
=½(base)(height)
20
= ½(20)(20)
D
20 Q
15. CONSUMER SURPLUS AND MARKET PRICE
A lower market price will usually increase
consumer surplus.
A higher market price will usually reduce
consumer surplus.
Consumer surplus will be smaller when the
demand curve is more elastic and larger
when the demand curve is inelastic.