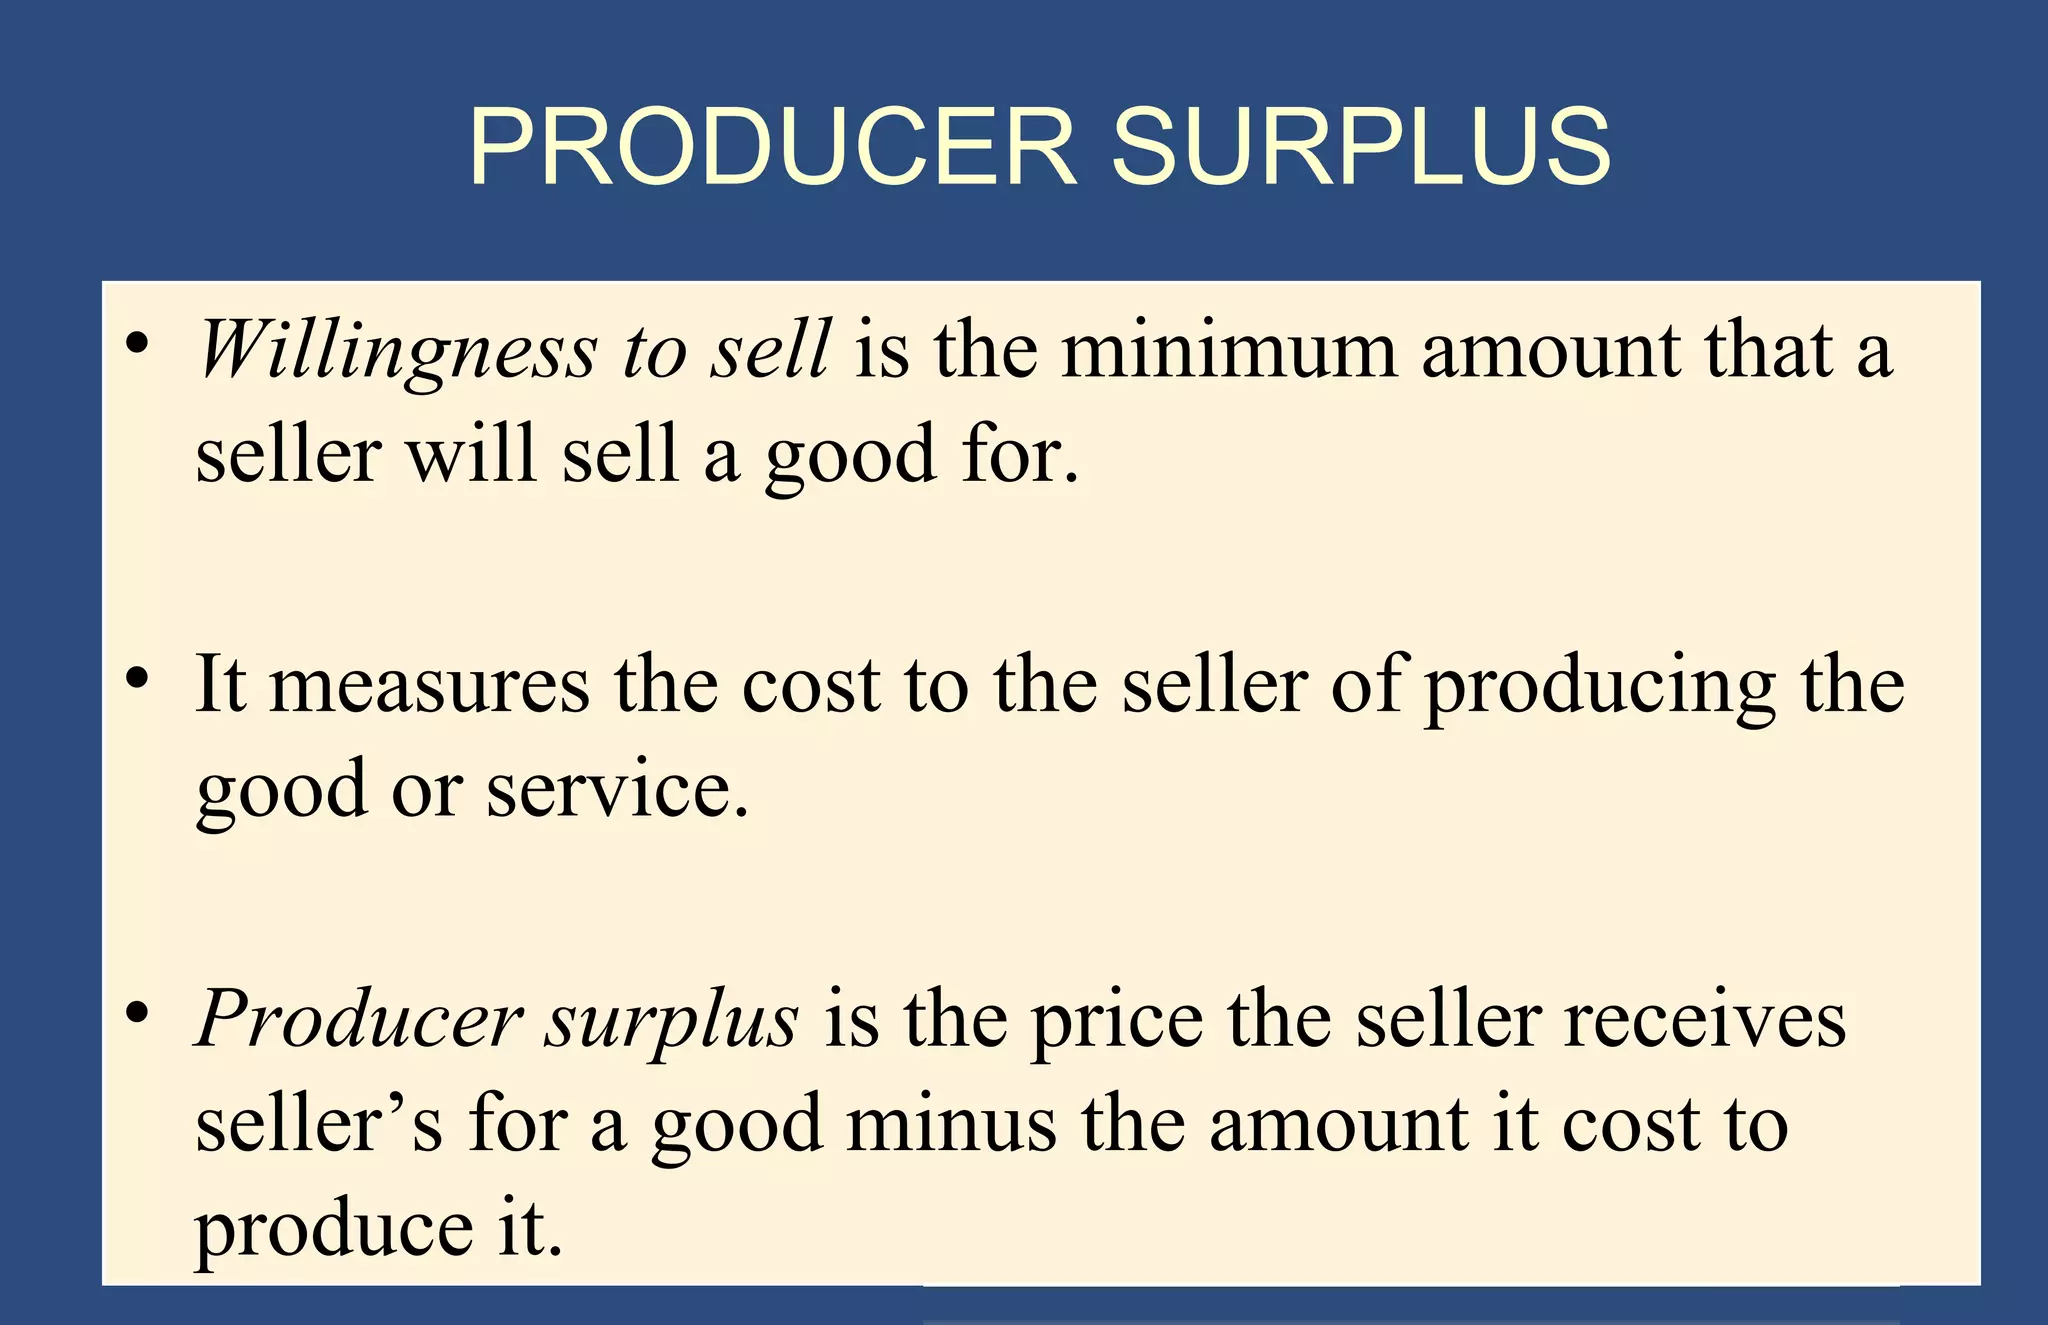
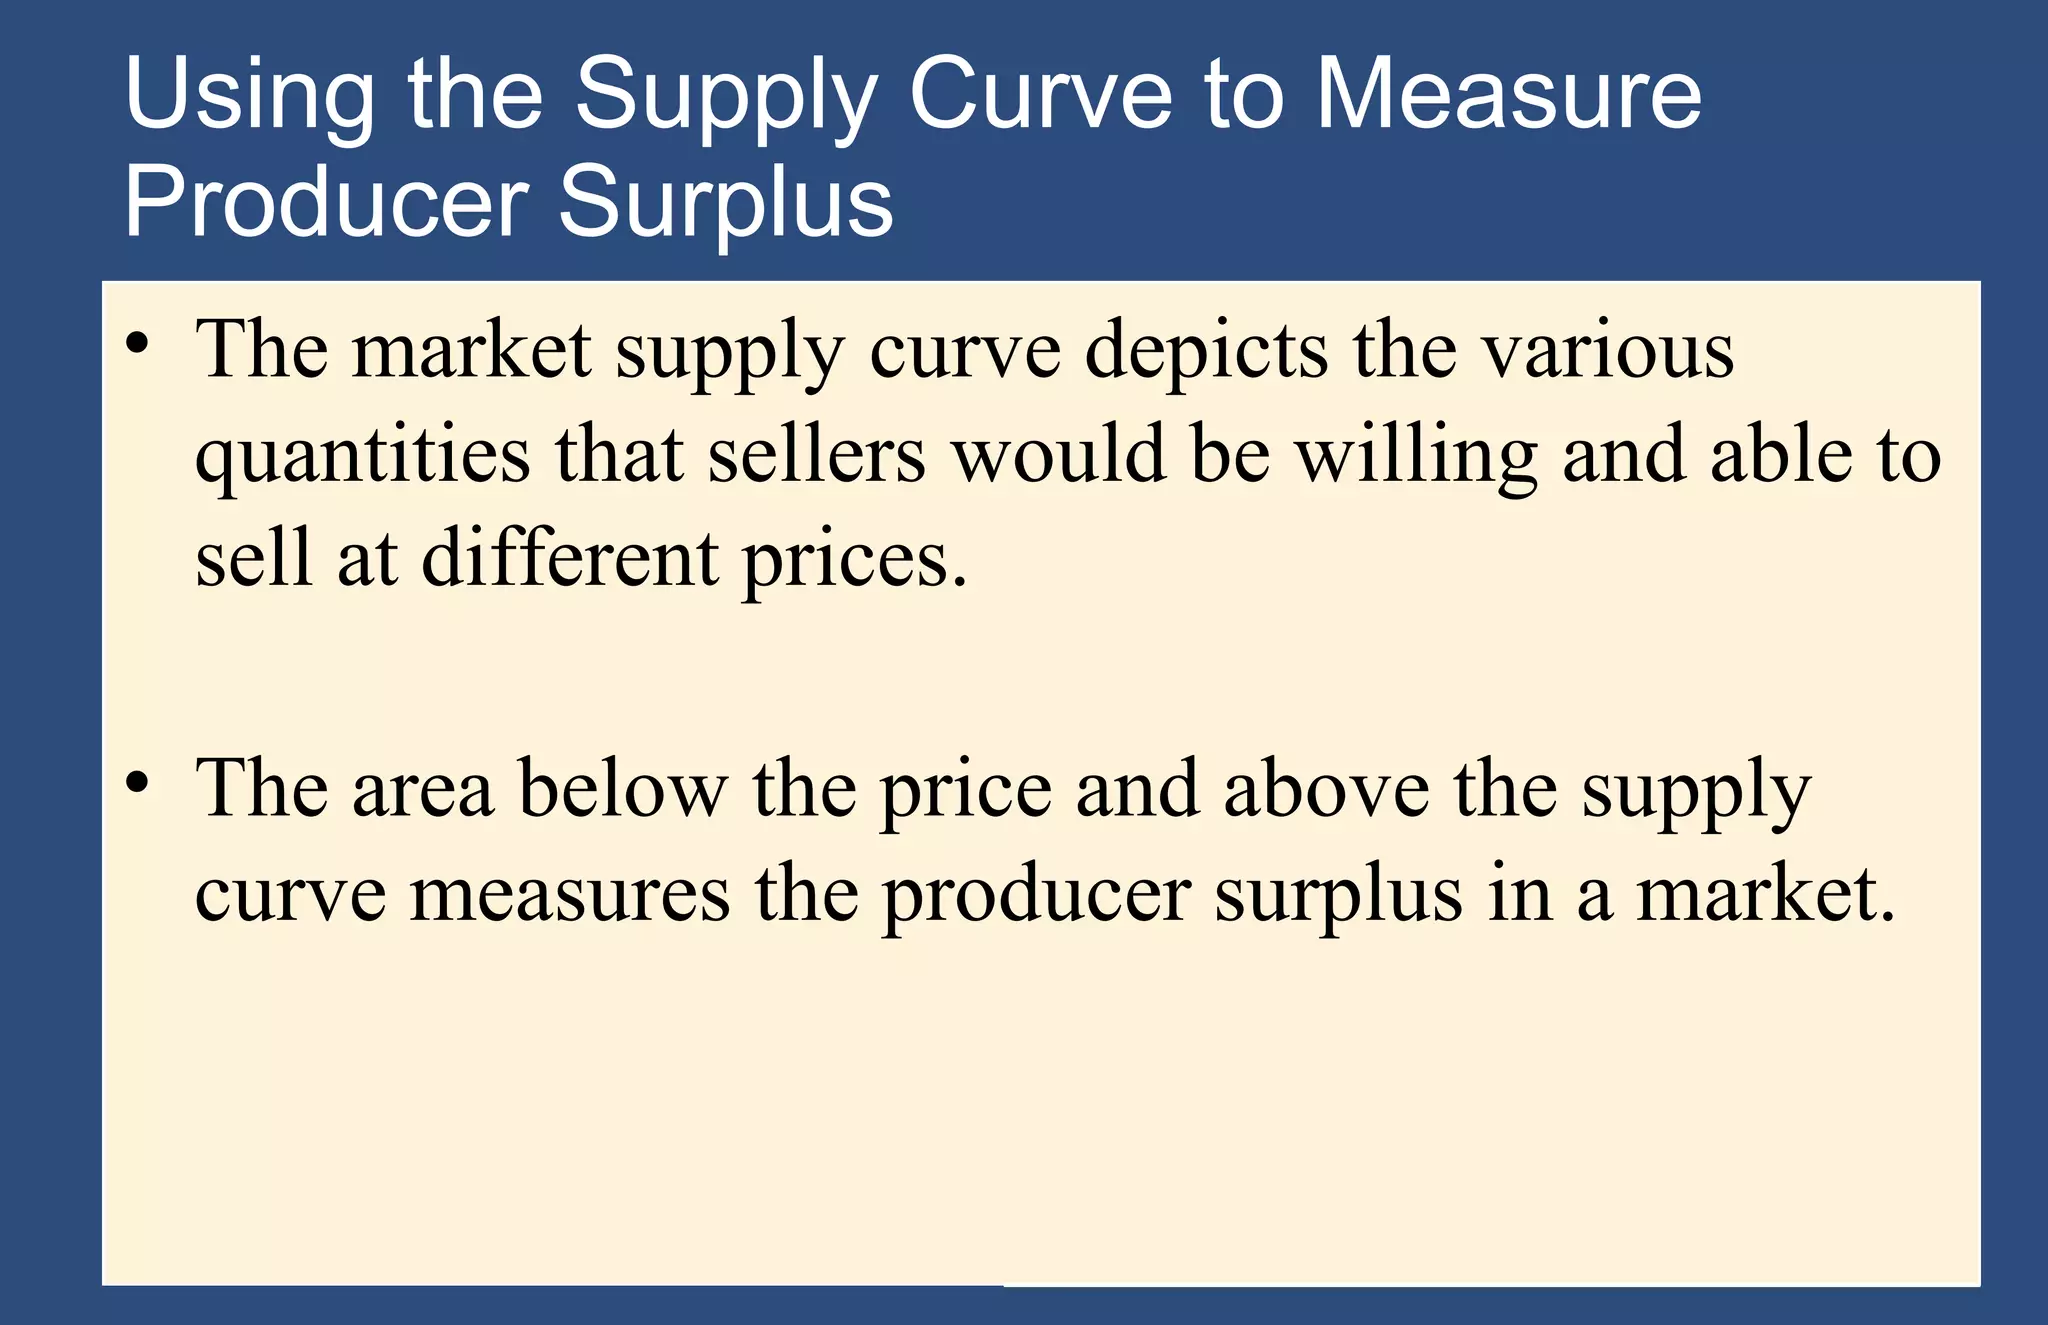
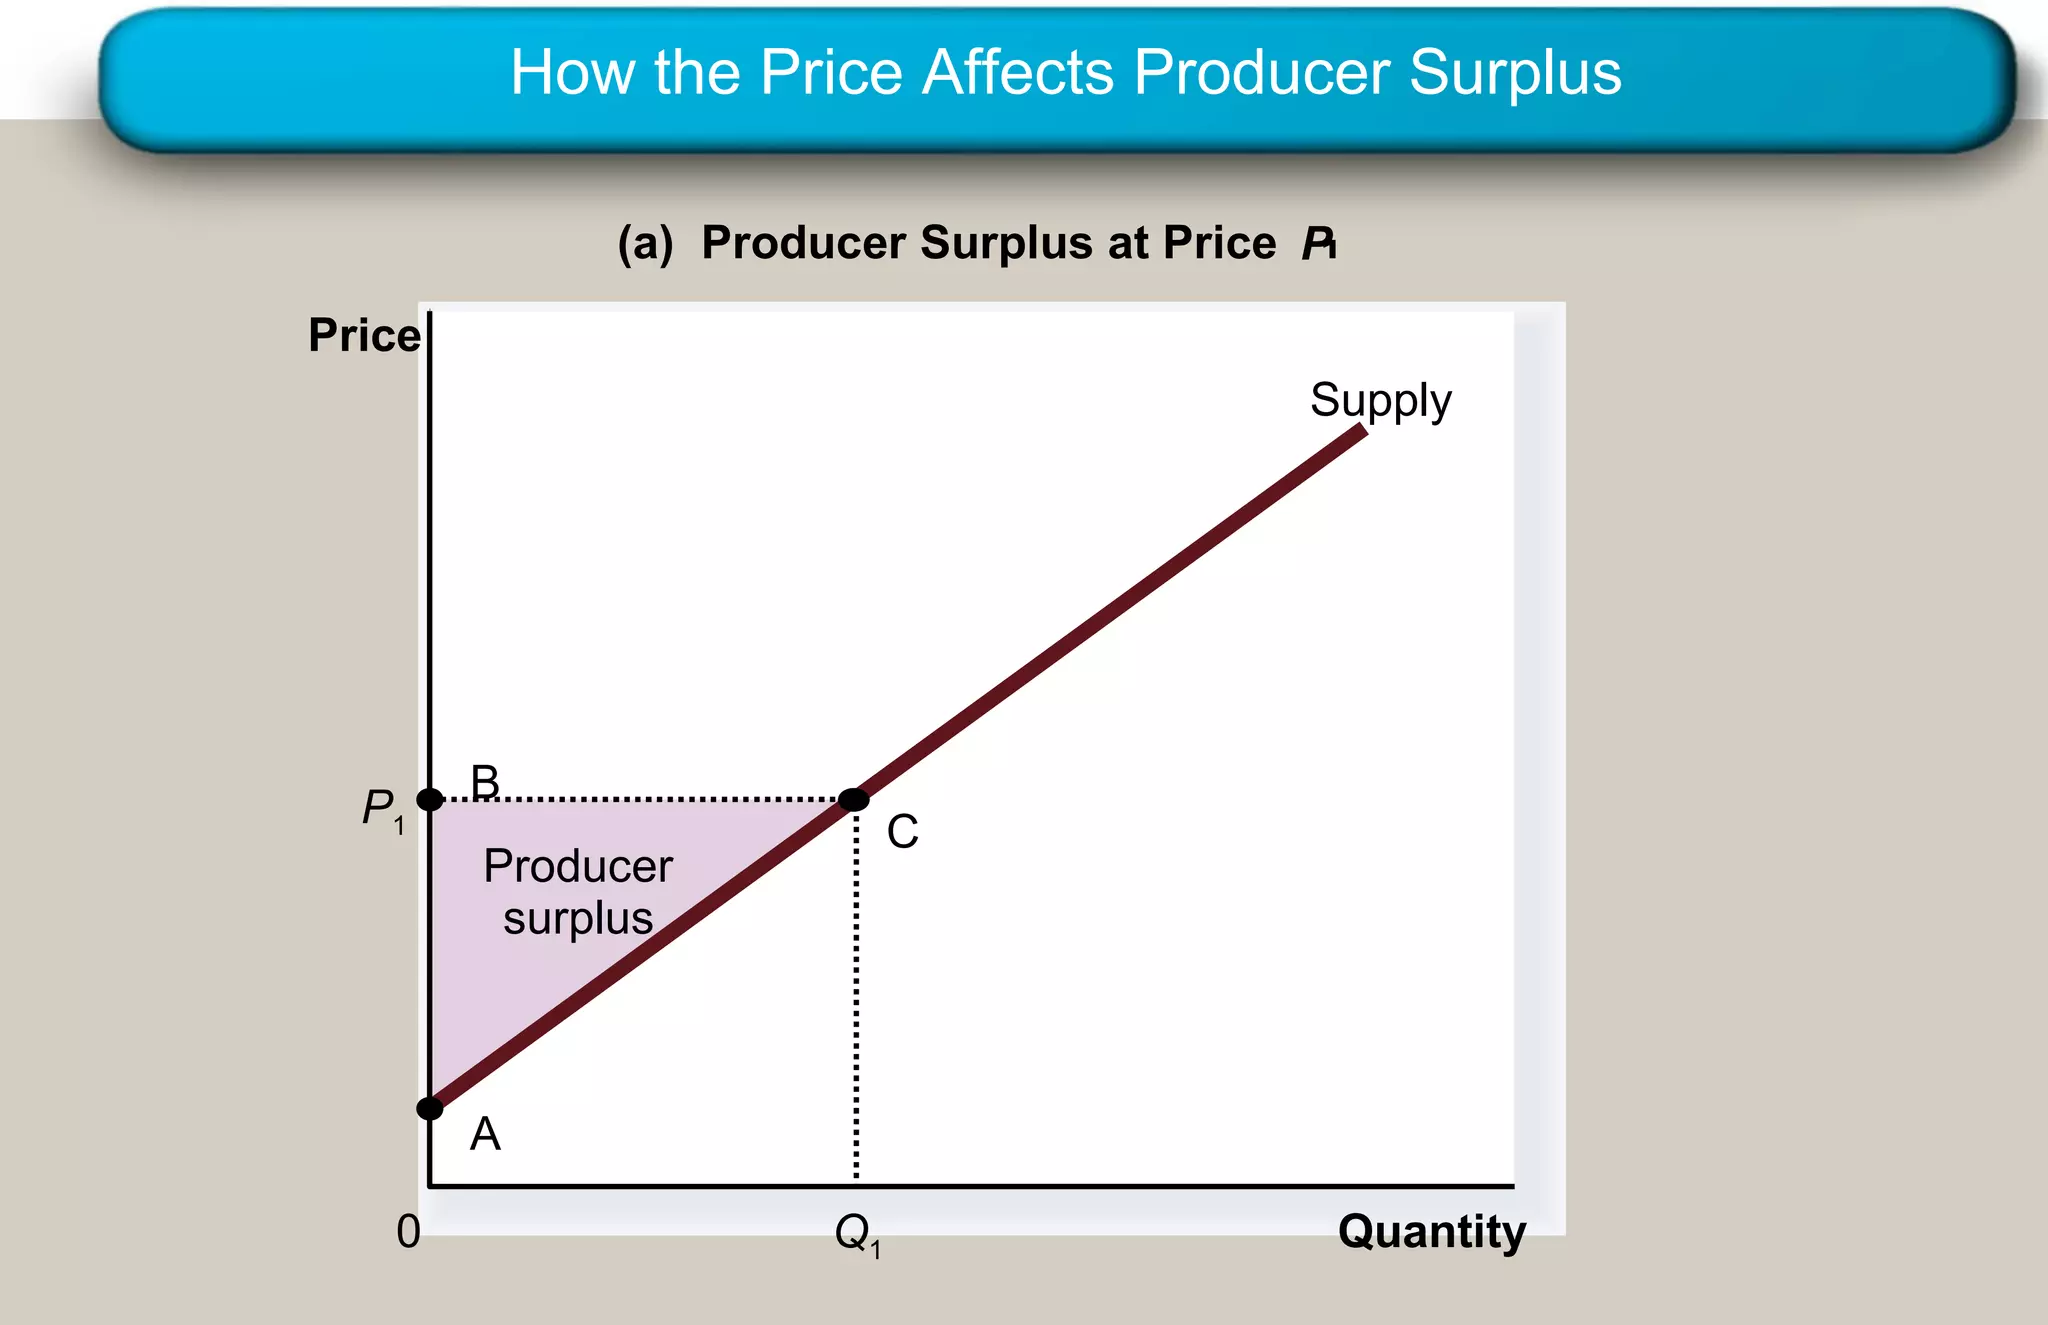
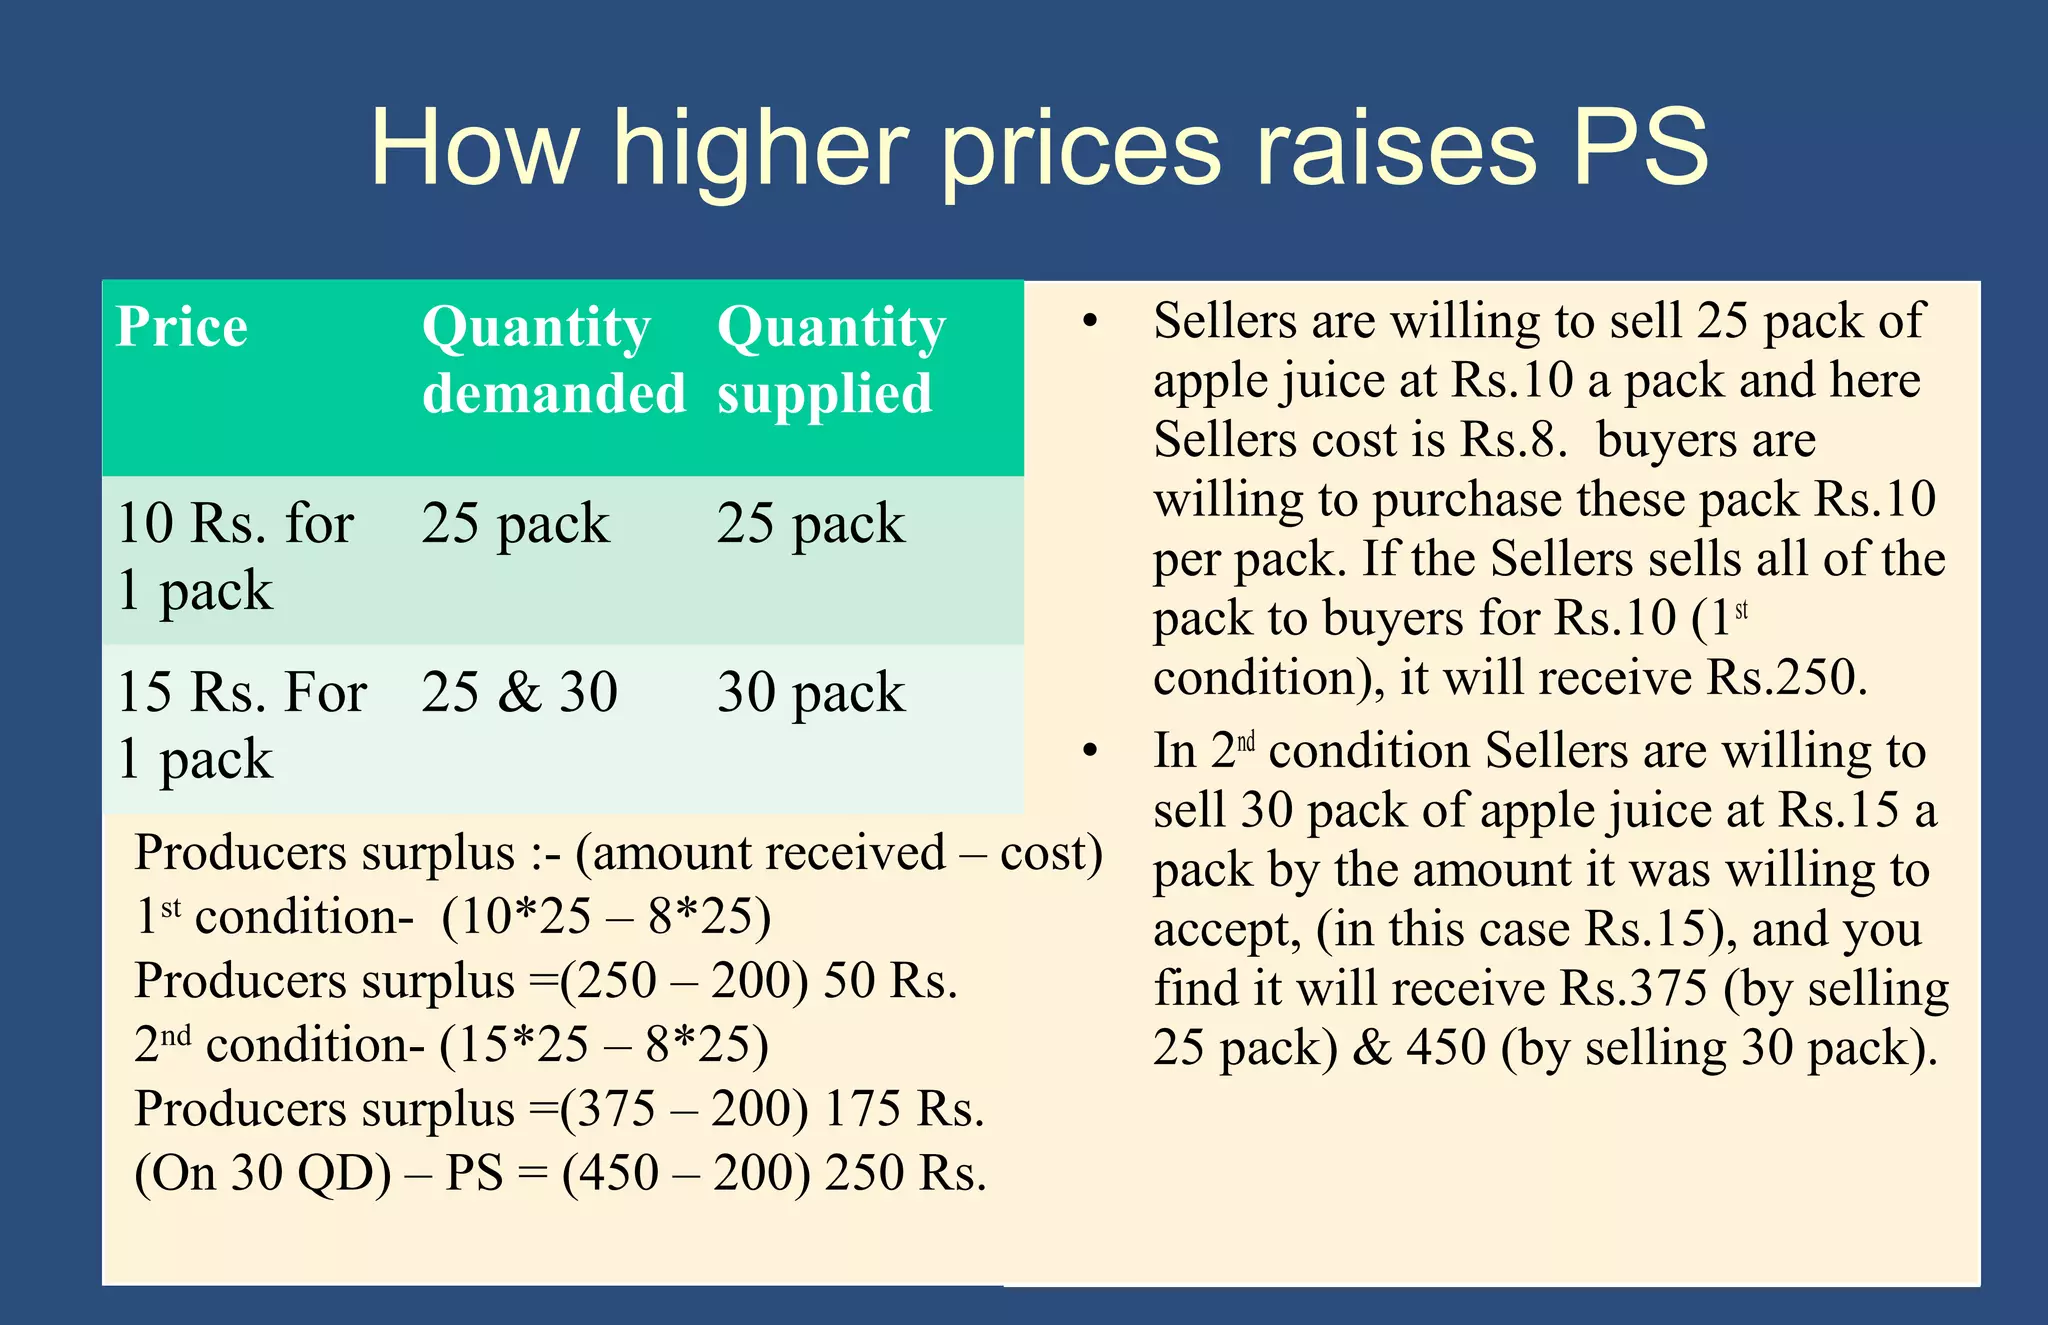
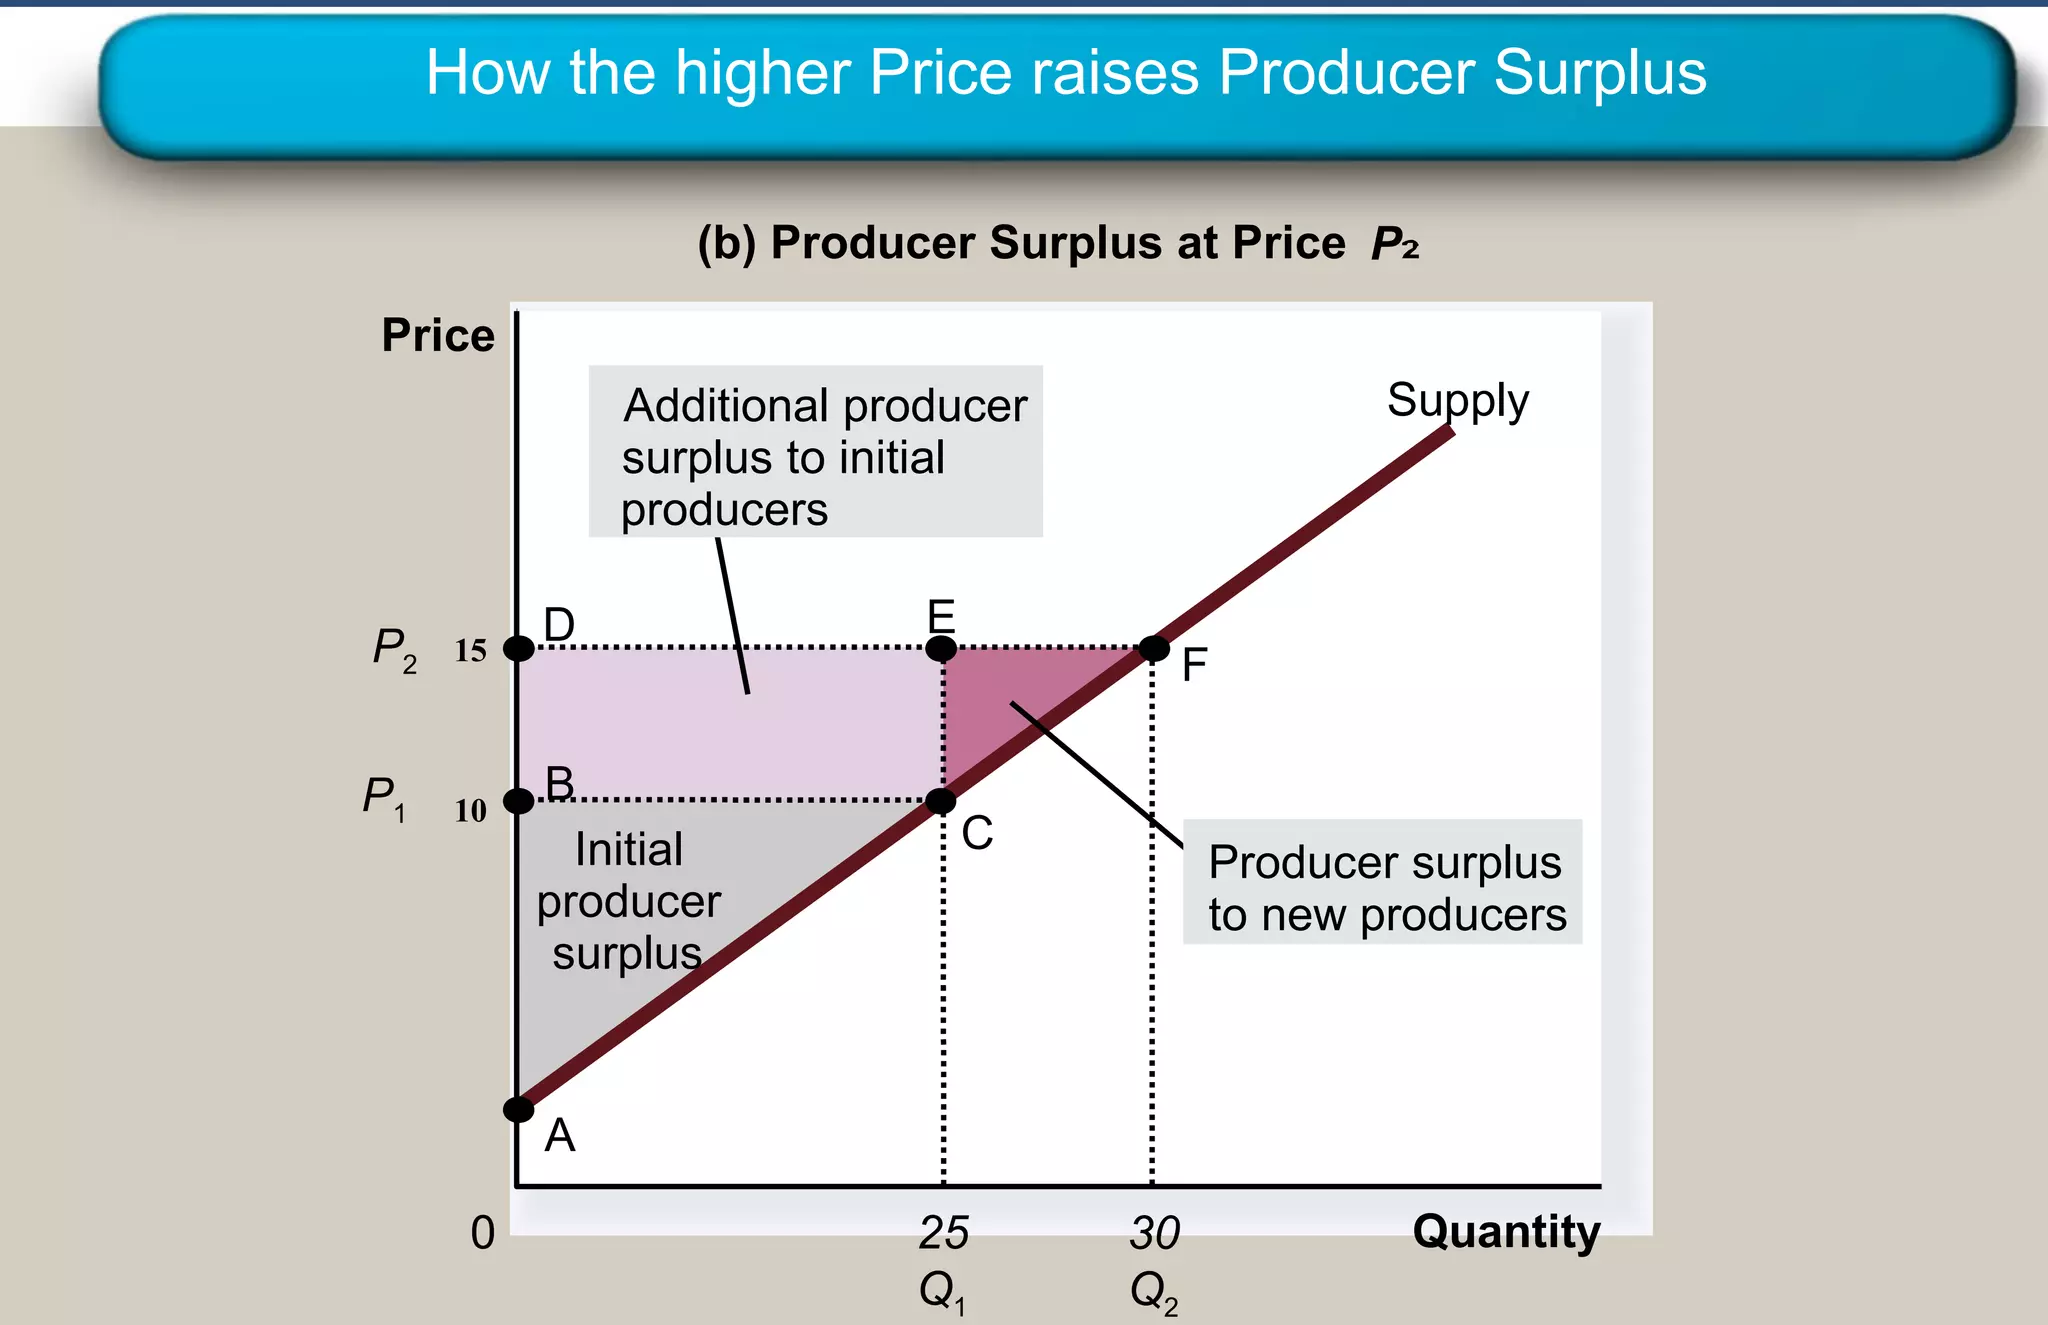
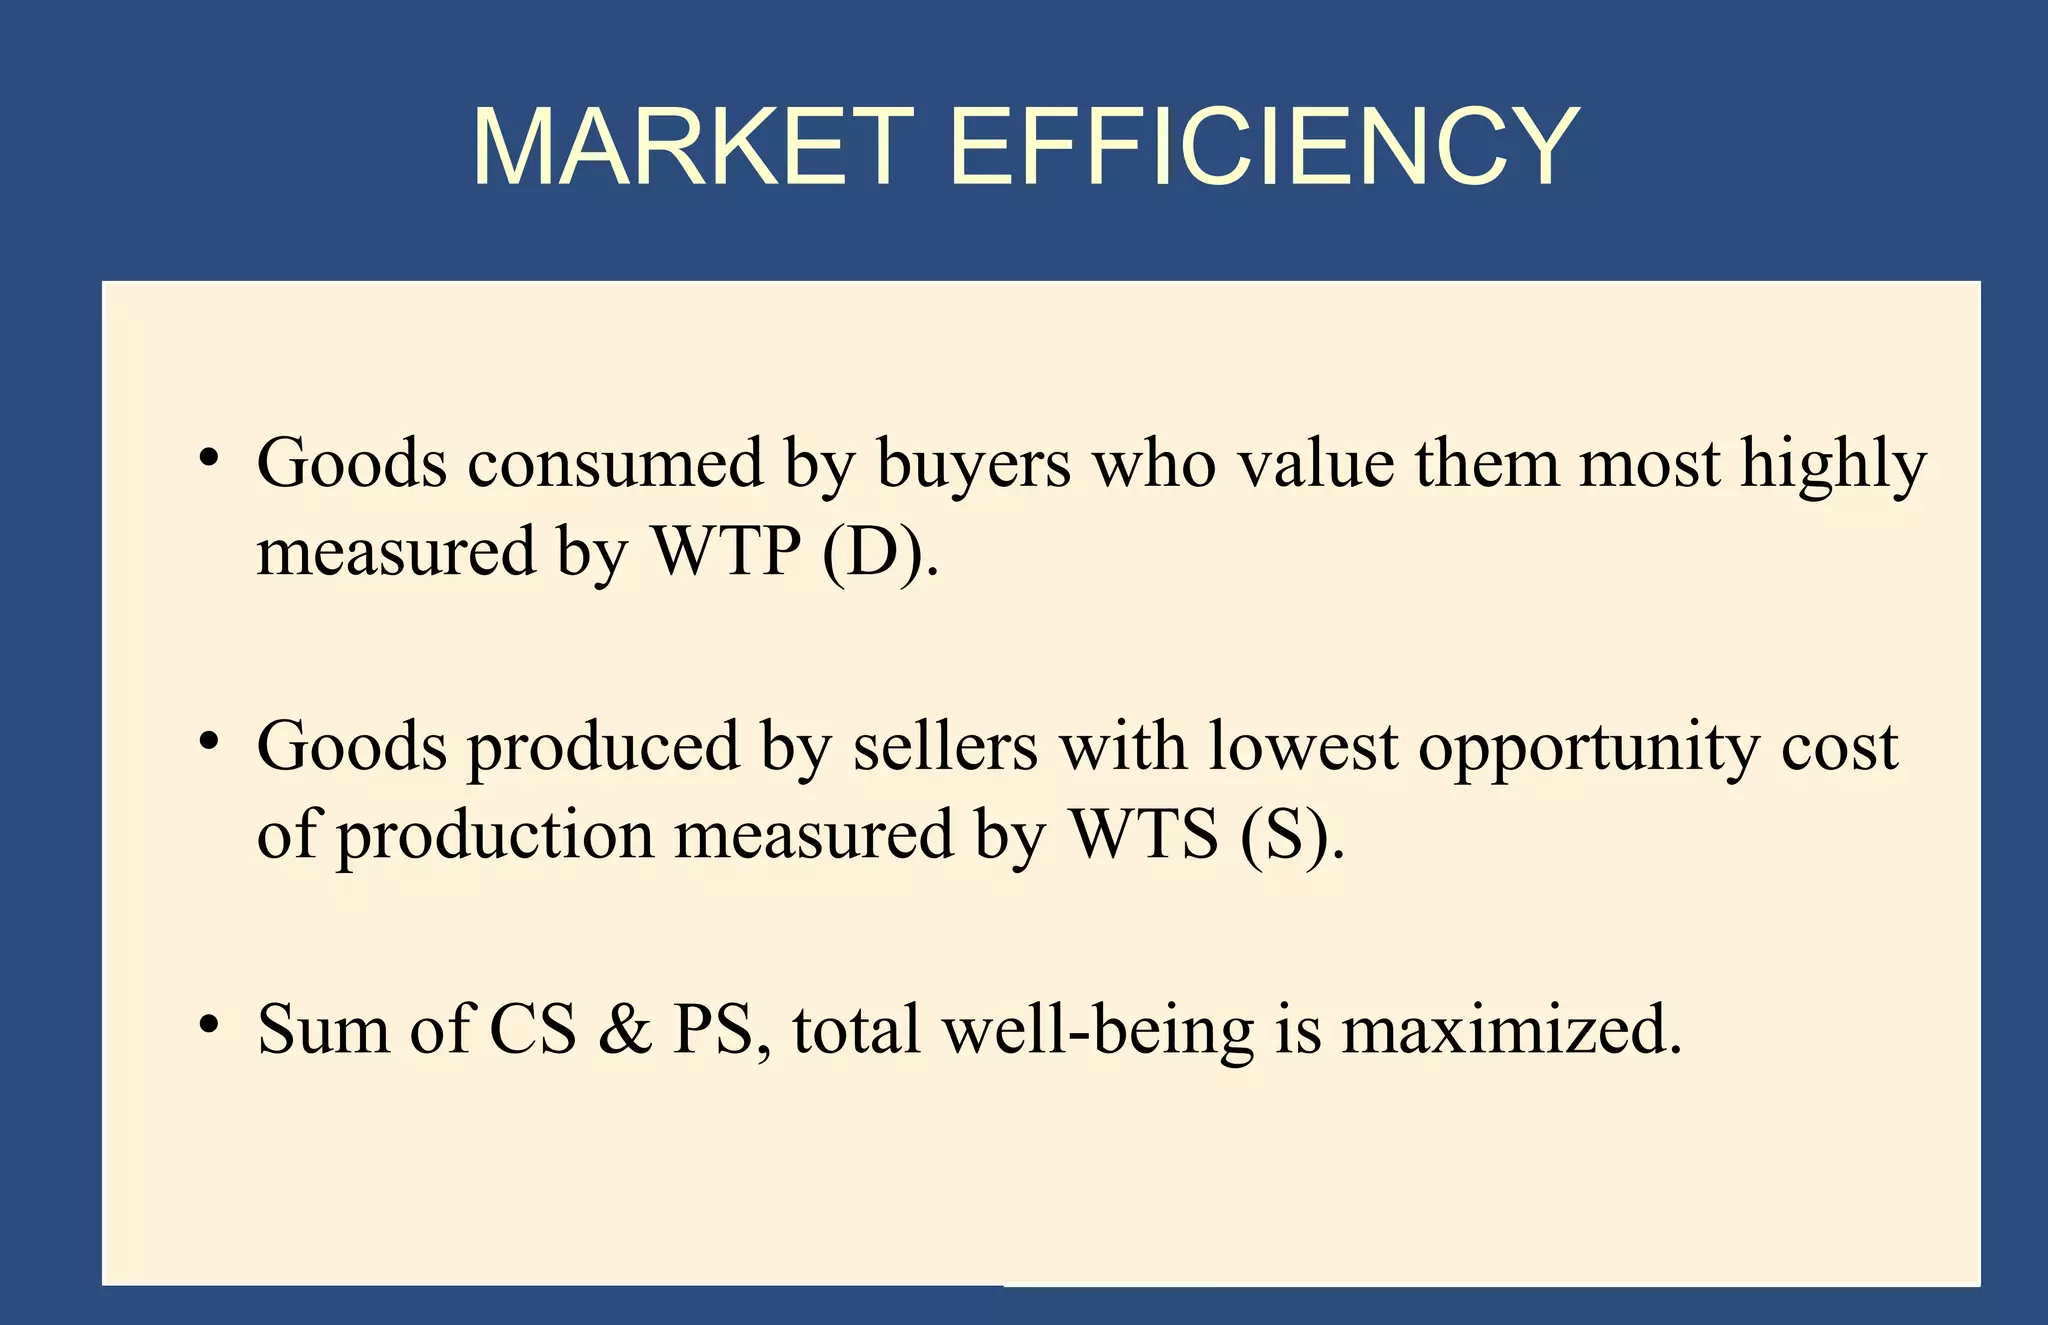
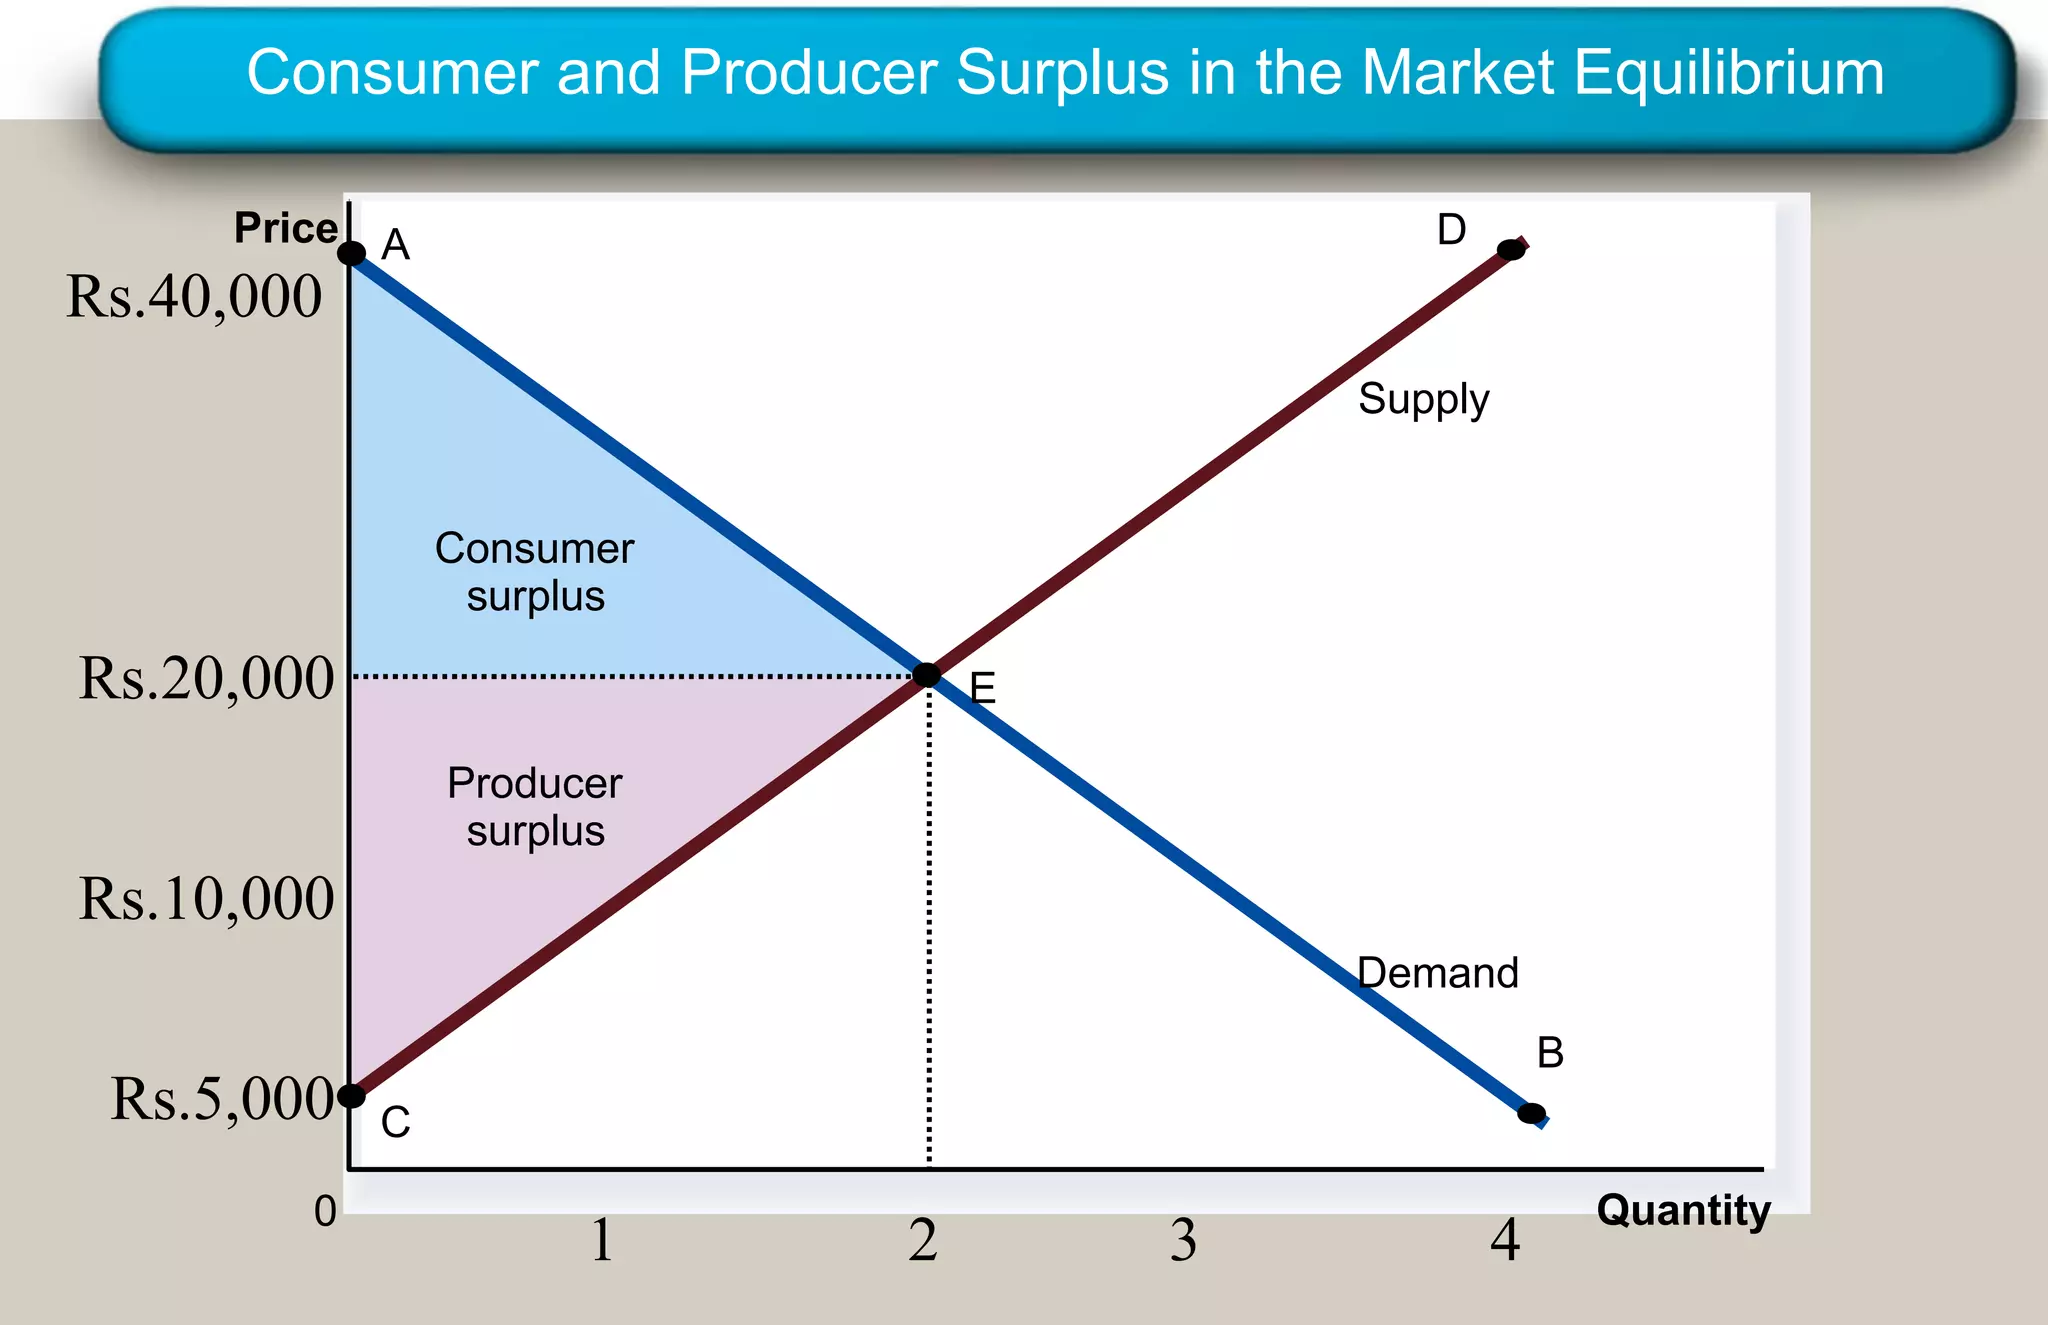
Group no. 2
Copyright © 2004 South-Western
PRODUCER SURPLUS
• Willingness to sell is the minimum amount that a
seller will sell a good for.
• It measures the cost to the seller of producing the
good or service.
• Producer surplus is the price the seller receives
seller’s for a good minus the amount it cost to
produce it.
Copyright © 2004 South-Western
Using the Supply Curve to Measure
Producer Surplus
• The market supply curve depicts the various
quantities that sellers would be willing and able to
sell at different prices.
• The area below the price and above the supply
curve measures the producer surplus in a market.

Copyright © 2004 South-Western
How the Price Affects Producer Surplus
(a) Producer Surplus at Price P
Price
Supply

P1

B

C

Producer
surplus

A
0

Q1

Quantity
Copyright©2003 Southwestern/Thomson Learning
How higher prices raises PS
Sellers are willing to sell 25 pack of
apple juice at Rs.10 a pack and here
Sellers cost is Rs.8. buyers are
willing to purchase these pack Rs.10
10 Rs. for 25 pack
25 pack
per pack. If the Sellers sells all of the
1 pack
pack to buyers for Rs.10 (1st
condition), it will receive Rs.250.
15 Rs. For 25 & 30
30 pack
• In 2nd condition Sellers are willing to
1 pack
sell 30 pack of apple juice at Rs.15 a
Producers surplus :- (amount received – cost) pack by the amount it was willing to
1st condition- (10*25 – 8*25)
accept, (in this case Rs.15), and you
Producers surplus =(250 – 200) 50 Rs.
find it will receive Rs.375 (by selling
nd
2 condition- (15*25 – 8*25)
25 pack) & 450 (by selling 30 pack).
Producers surplus =(375 – 200) 175 Rs.
(On 30 QD) – PS = (450 – 200) 250 Rs.

Price

Quantity Quantity
demanded supplied

•

Copyright © 2004 South-Western
How the higher Price raises Producer Surplus
(b) Producer Surplus at Price P
Price
Supply

Additional producer
surplus to initial
producers
P2

15

P1

10

D
B
Initial
producer
surplus

E

F
C

Producer surplus
to new producers

A
0

25
Q1

30
Q2

Quantity
Copyright©2003 Southwestern/Thomson Learning
Welfare Economics
• Buyers and sellers receive benefits from taking
part in the market.
• The equilibrium in a market maximizes the total
welfare of buyers and sellers.

Copyright © 2004 South-Western
MARKET EFFICIENCY
• Goods consumed by buyers who value them most highly
measured by WTP (D).
• Goods produced by sellers with lowest opportunity cost
of production measured by WTS (S).
• Sum of CS & PS, total well-being is maximized.

Copyright © 2004 South-Western
• Buyers

• Sellers

P

Qd

Qs

3.50
3.70
3.90
4.10
4.30
4.50
4.70
4.90
5.10

35
33
31
29
27
23
18
11
4

4
11
18
23
27
29
31
33
35

In the Chips
• Buyers

Market Forces & Equilibrium

• Sellers

• Price squeezes to where Qs = Qd and the market clears.
• This price facilitates all transactions that can improve
the well-being of market participants.
• Goods purchased by those with highest value.
• Goods produced by those with lowest opportunity cost.
• The well-being of society is maximized.
Copyright © 2004 South-Western
• Buyers

Market Forces & Equilibrium
Total Quantity 4

IPHONE 5

• Day 1When price is
Rs.40,000
• Day 2 When price is
Rs.20,000
• Day 3When price is
Rs.10,000
• Day 4 When price is
Rs.5,000
Copyright © 2004 South-Western
Market Forces & Equilibrium

• Sellers

Total Quantity 4

• Day 1When price is
Rs.5,000(Cost)
• Day 2 When price is
Rs.10,000
• Day 3When price is
Rs.20,000
• Day 4 When price is
Rs.40,000

IPHONE 5

Copyright © 2004 South-Western
Consumer and Producer Surplus in the Market Equilibrium
Price A

D

Rs.40,000

Supply
Consumer
surplus

Rs.20,000

E
Producer
surplus

Rs.10,000
Demand

Rs.5,000
0

B
C

1

2

3

4

Quantity

Copyright © 2004 South-Western
Copyright©2003 Southwestern/Thomson Learning
Summary
• Producer surplus measures the benefit sellers and Consumer surplus
measures the benefit buyers get from participating in a market.
• An allocation of resources that maximizes the sum of consumer surplus
and producer surplus is efficient.
• The competitive market equilibrium outcome maximizes the sum of
consumer surplus and producer surplus and thus maximizes the wellbeing of market participants.
• All transactions that could possibly improve the well-being of market
participants have taken place.
Copyright © 2004 South-Western

Producer Surplus basics

  • 1.
    Group no. 2 Copyright© 2004 South-Western
  • 2.
    PRODUCER SURPLUS • Willingnessto sell is the minimum amount that a seller will sell a good for. • It measures the cost to the seller of producing the good or service. • Producer surplus is the price the seller receives seller’s for a good minus the amount it cost to produce it. Copyright © 2004 South-Western
  • 3.
    Using the SupplyCurve to Measure Producer Surplus • The market supply curve depicts the various quantities that sellers would be willing and able to sell at different prices. • The area below the price and above the supply curve measures the producer surplus in a market. Copyright © 2004 South-Western
  • 4.
    How the PriceAffects Producer Surplus (a) Producer Surplus at Price P Price Supply P1 B C Producer surplus A 0 Q1 Quantity Copyright©2003 Southwestern/Thomson Learning
  • 5.
    How higher pricesraises PS Sellers are willing to sell 25 pack of apple juice at Rs.10 a pack and here Sellers cost is Rs.8. buyers are willing to purchase these pack Rs.10 10 Rs. for 25 pack 25 pack per pack. If the Sellers sells all of the 1 pack pack to buyers for Rs.10 (1st condition), it will receive Rs.250. 15 Rs. For 25 & 30 30 pack • In 2nd condition Sellers are willing to 1 pack sell 30 pack of apple juice at Rs.15 a Producers surplus :- (amount received – cost) pack by the amount it was willing to 1st condition- (10*25 – 8*25) accept, (in this case Rs.15), and you Producers surplus =(250 – 200) 50 Rs. find it will receive Rs.375 (by selling nd 2 condition- (15*25 – 8*25) 25 pack) & 450 (by selling 30 pack). Producers surplus =(375 – 200) 175 Rs. (On 30 QD) – PS = (450 – 200) 250 Rs. Price Quantity Quantity demanded supplied • Copyright © 2004 South-Western
  • 6.
    How the higherPrice raises Producer Surplus (b) Producer Surplus at Price P Price Supply Additional producer surplus to initial producers P2 15 P1 10 D B Initial producer surplus E F C Producer surplus to new producers A 0 25 Q1 30 Q2 Quantity Copyright©2003 Southwestern/Thomson Learning
  • 7.
    Welfare Economics • Buyersand sellers receive benefits from taking part in the market. • The equilibrium in a market maximizes the total welfare of buyers and sellers. Copyright © 2004 South-Western
  • 8.
    MARKET EFFICIENCY • Goodsconsumed by buyers who value them most highly measured by WTP (D). • Goods produced by sellers with lowest opportunity cost of production measured by WTS (S). • Sum of CS & PS, total well-being is maximized. Copyright © 2004 South-Western
  • 9.
  • 10.
    • Buyers Market Forces& Equilibrium • Sellers • Price squeezes to where Qs = Qd and the market clears. • This price facilitates all transactions that can improve the well-being of market participants. • Goods purchased by those with highest value. • Goods produced by those with lowest opportunity cost. • The well-being of society is maximized. Copyright © 2004 South-Western
  • 11.
    • Buyers Market Forces& Equilibrium Total Quantity 4 IPHONE 5 • Day 1When price is Rs.40,000 • Day 2 When price is Rs.20,000 • Day 3When price is Rs.10,000 • Day 4 When price is Rs.5,000 Copyright © 2004 South-Western
  • 12.
    Market Forces &Equilibrium • Sellers Total Quantity 4 • Day 1When price is Rs.5,000(Cost) • Day 2 When price is Rs.10,000 • Day 3When price is Rs.20,000 • Day 4 When price is Rs.40,000 IPHONE 5 Copyright © 2004 South-Western
  • 13.
    Consumer and ProducerSurplus in the Market Equilibrium Price A D Rs.40,000 Supply Consumer surplus Rs.20,000 E Producer surplus Rs.10,000 Demand Rs.5,000 0 B C 1 2 3 4 Quantity Copyright © 2004 South-Western Copyright©2003 Southwestern/Thomson Learning
  • 14.
    Summary • Producer surplusmeasures the benefit sellers and Consumer surplus measures the benefit buyers get from participating in a market. • An allocation of resources that maximizes the sum of consumer surplus and producer surplus is efficient. • The competitive market equilibrium outcome maximizes the sum of consumer surplus and producer surplus and thus maximizes the wellbeing of market participants. • All transactions that could possibly improve the well-being of market participants have taken place. Copyright © 2004 South-Western

Editor's Notes