Downloaded 76 times


This document provides an overview of key concepts related to demand and supply in economics. It defines demand as the quantity of a good or service consumers are willing and able to purchase at a given price. The law of demand states that as price increases, quantity demanded decreases, and vice versa. Factors that influence demand include income, tastes, prices of substitutes and complements. Supply is defined as the quantity producers are willing and able to offer for sale at a given price. The law of supply states that as price increases, quantity supplied increases, and vice versa. Factors that influence supply include costs of production, technology, and expectations. Market equilibrium occurs where quantity demanded equals quantity supplied. Disequilibria result in sur
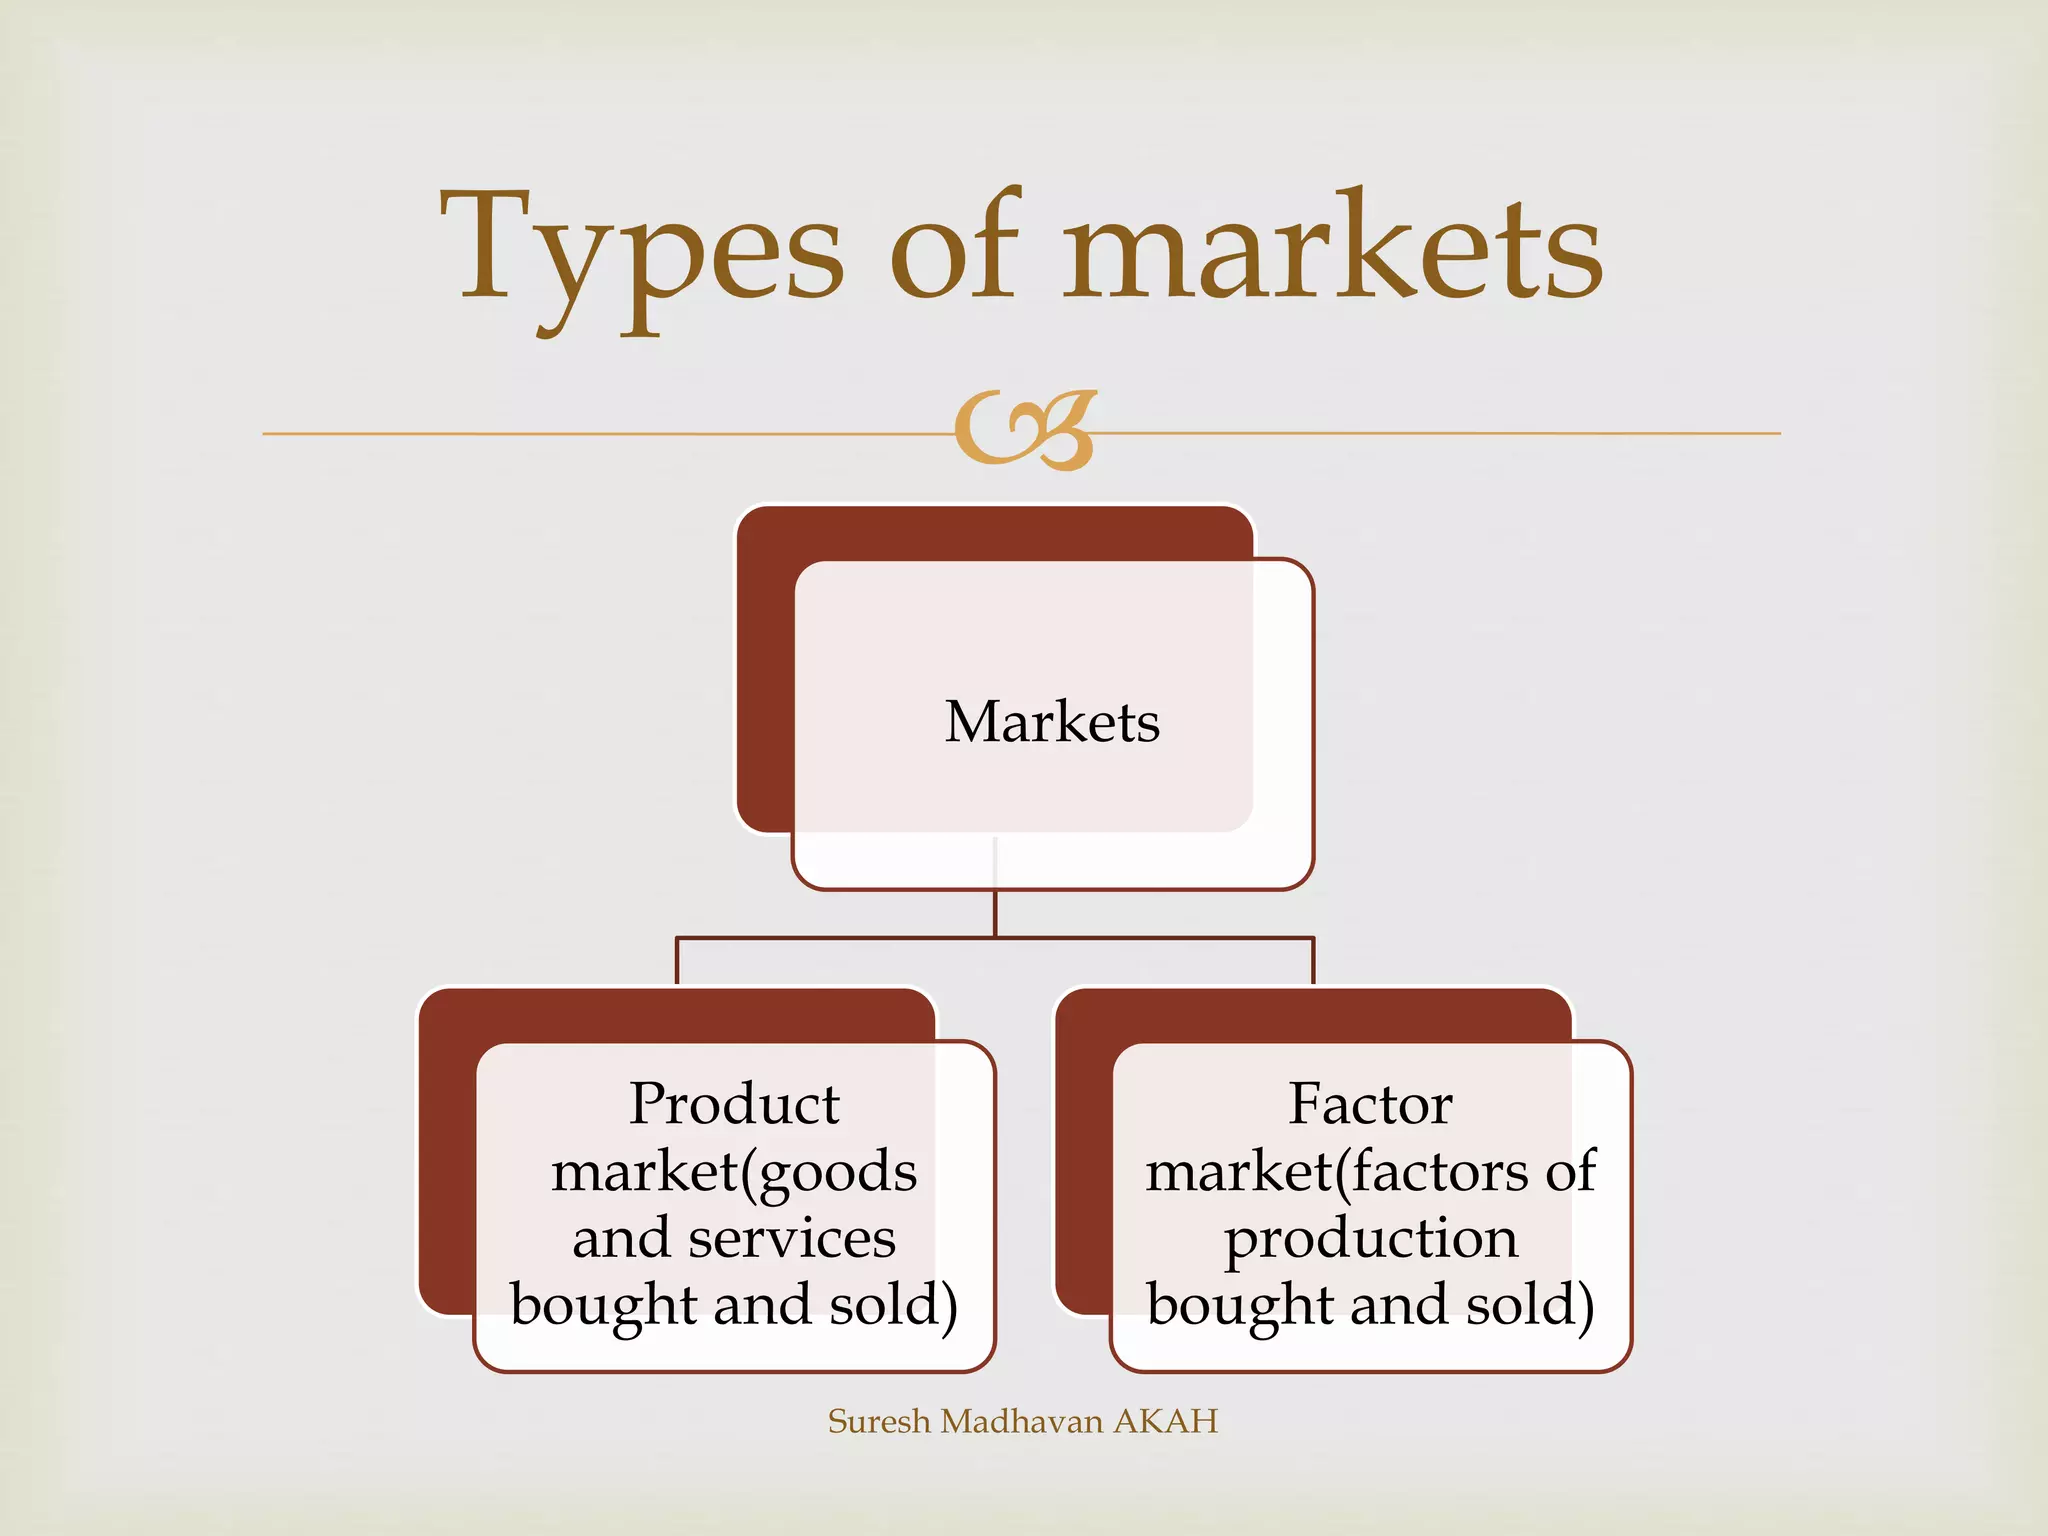
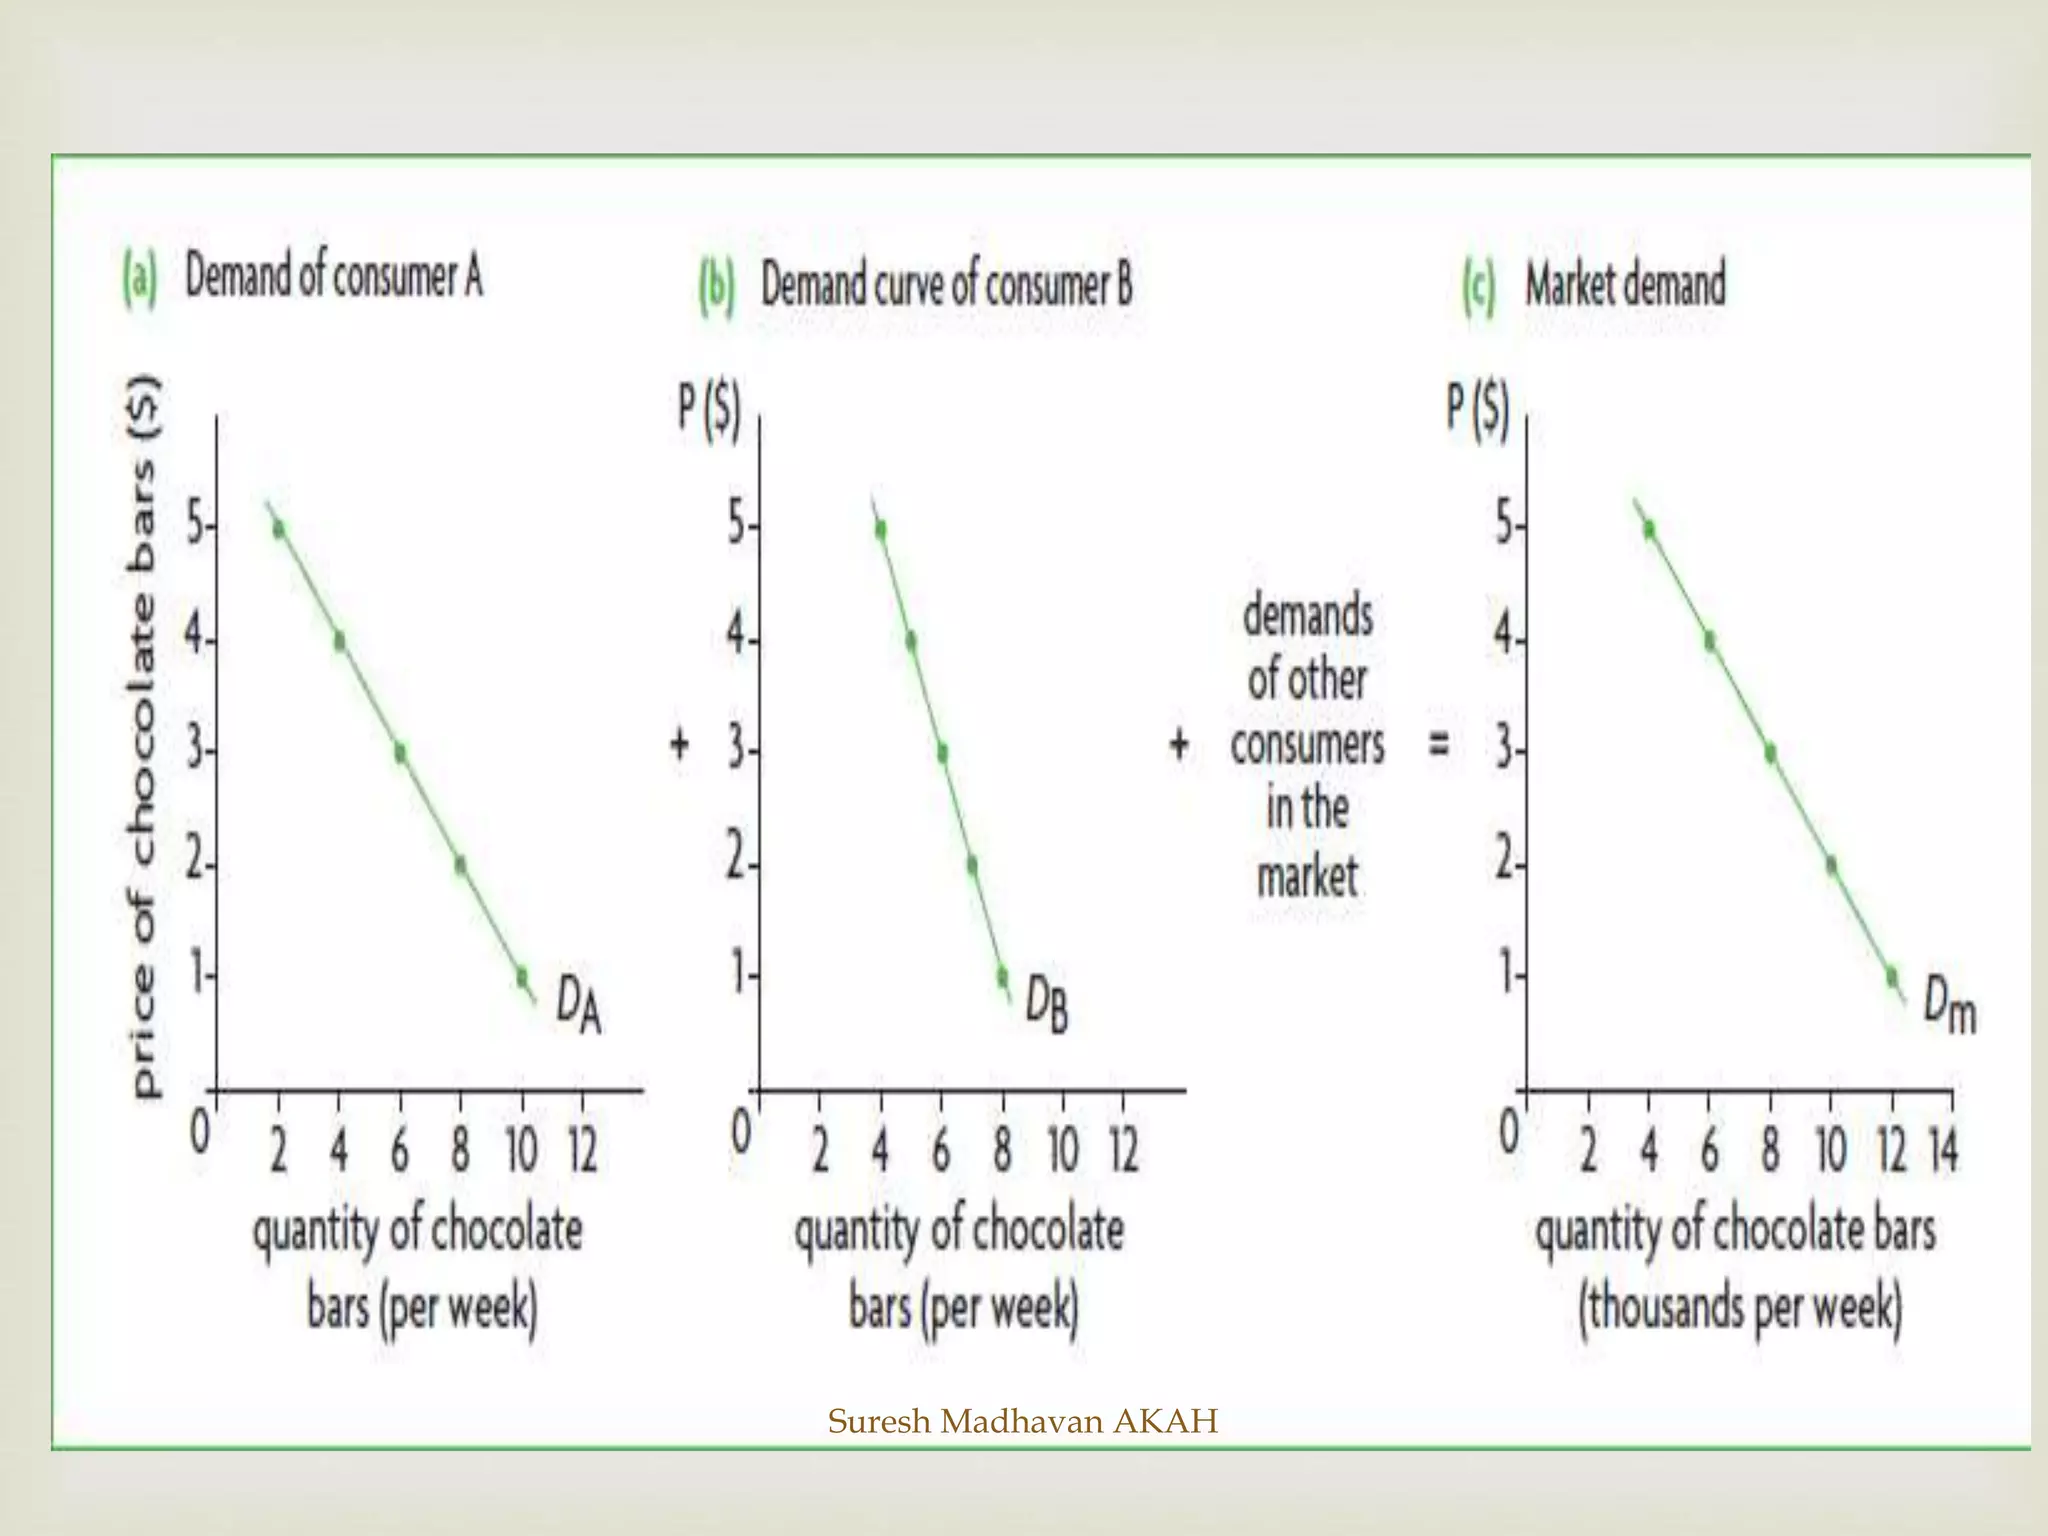
Introduction to market types, demand definition, demand schedule, and the law of demand.
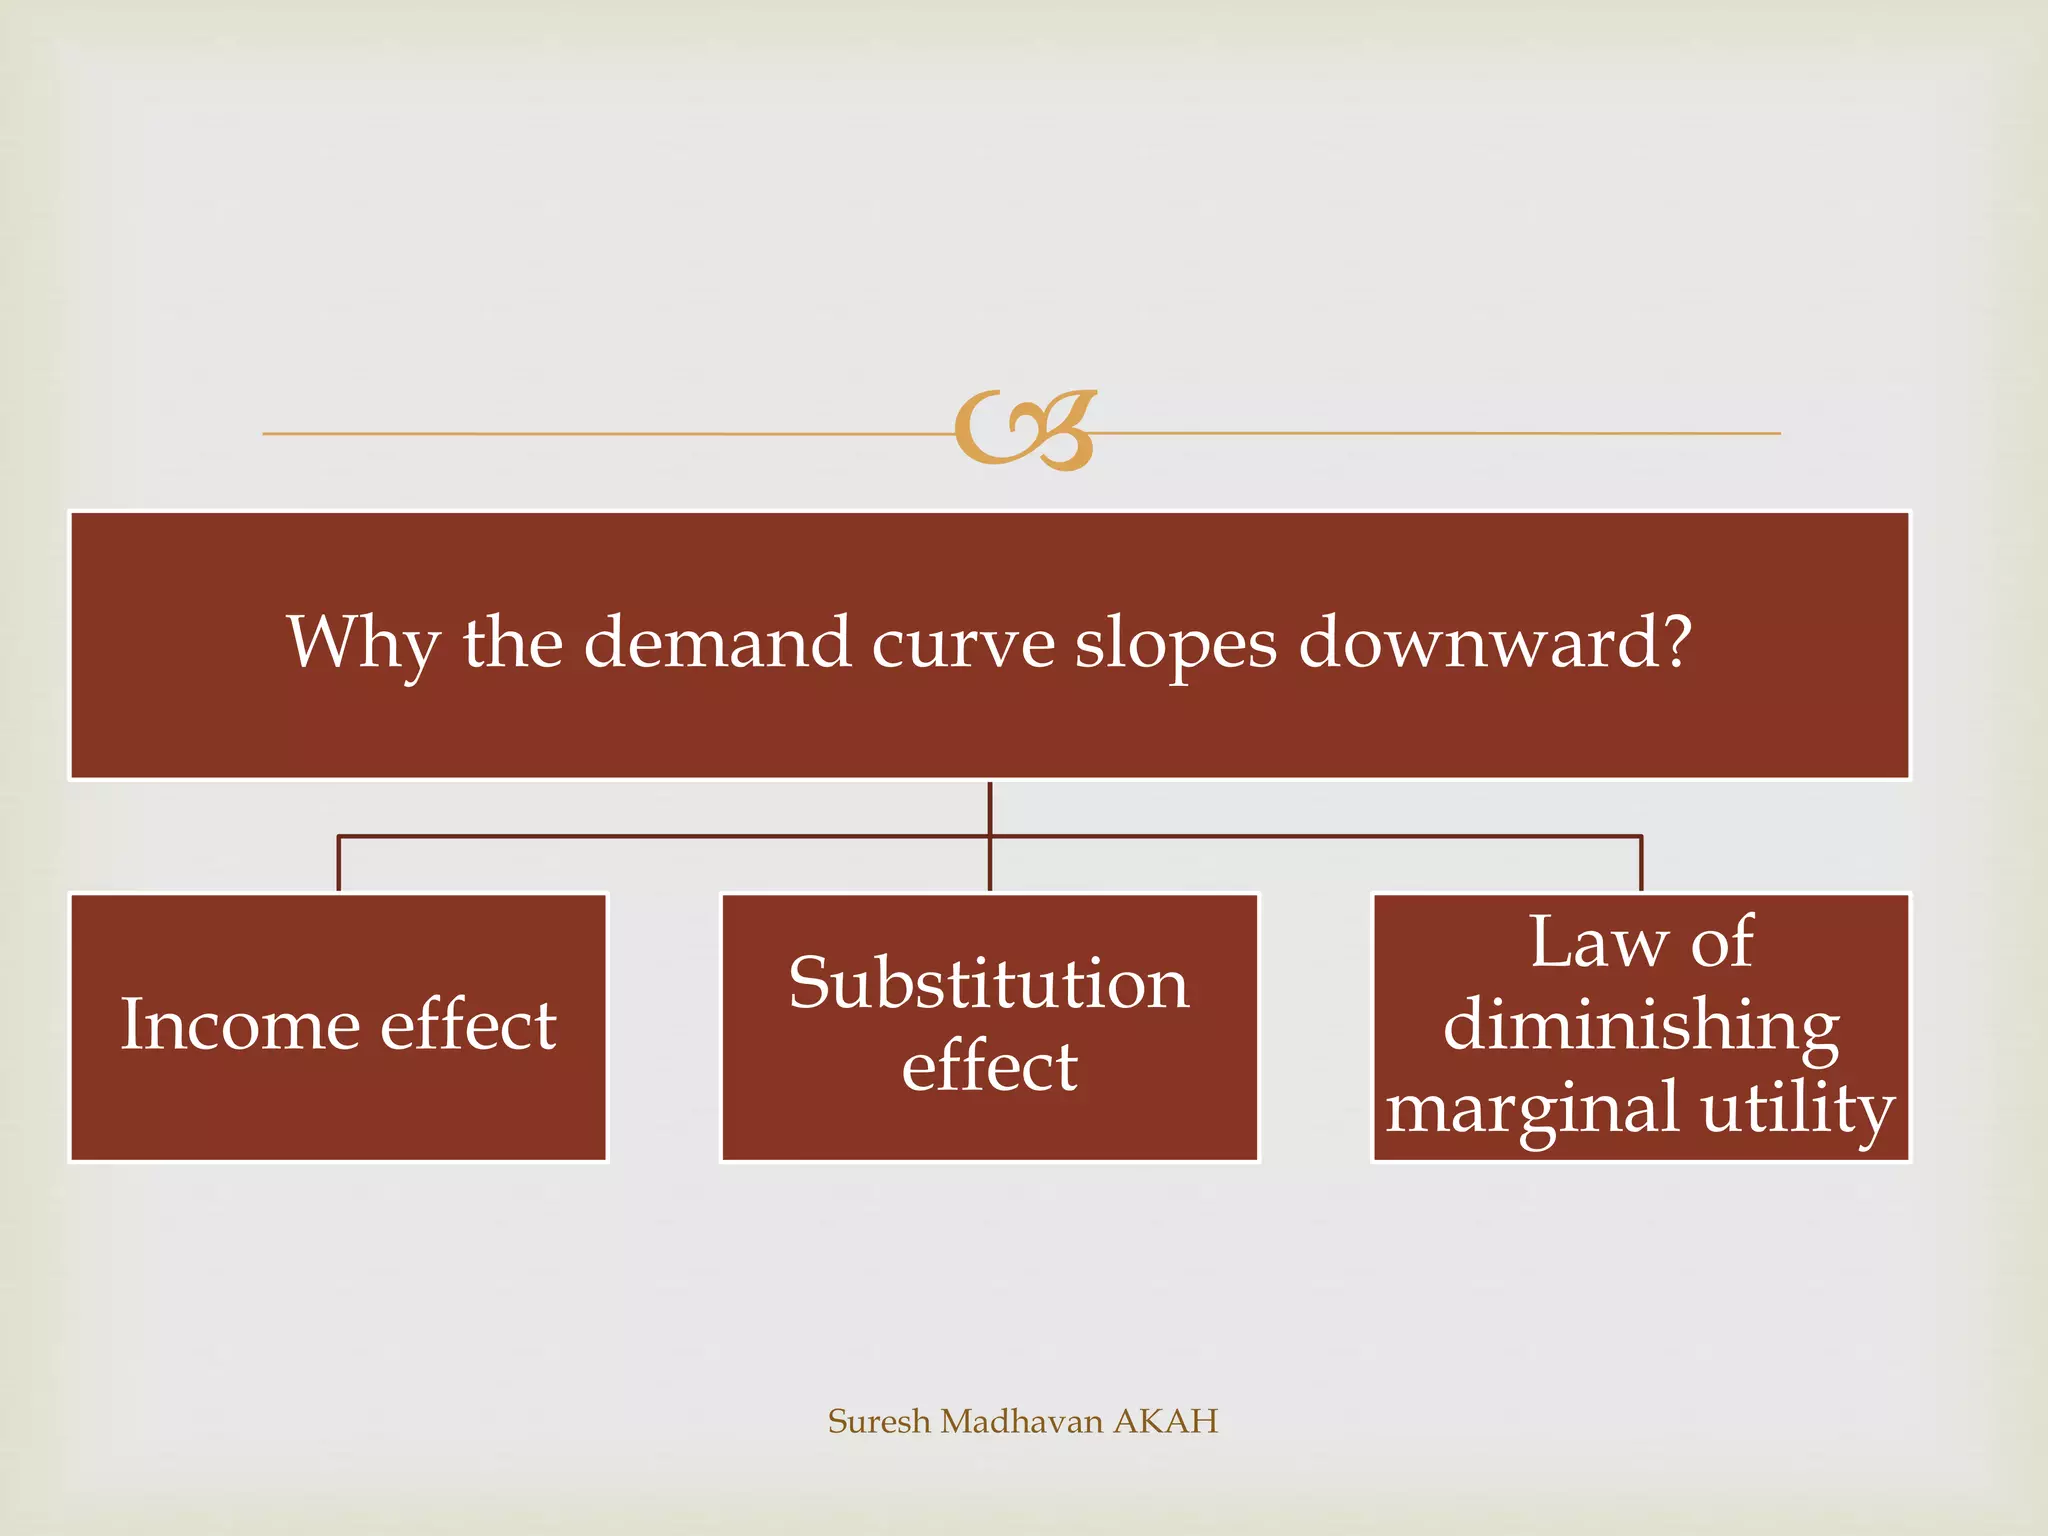
Factors affecting demand such as income effect, substitution effect, and other determinants. Movements along and shifts of the demand curve, including exceptions to the law of demand.
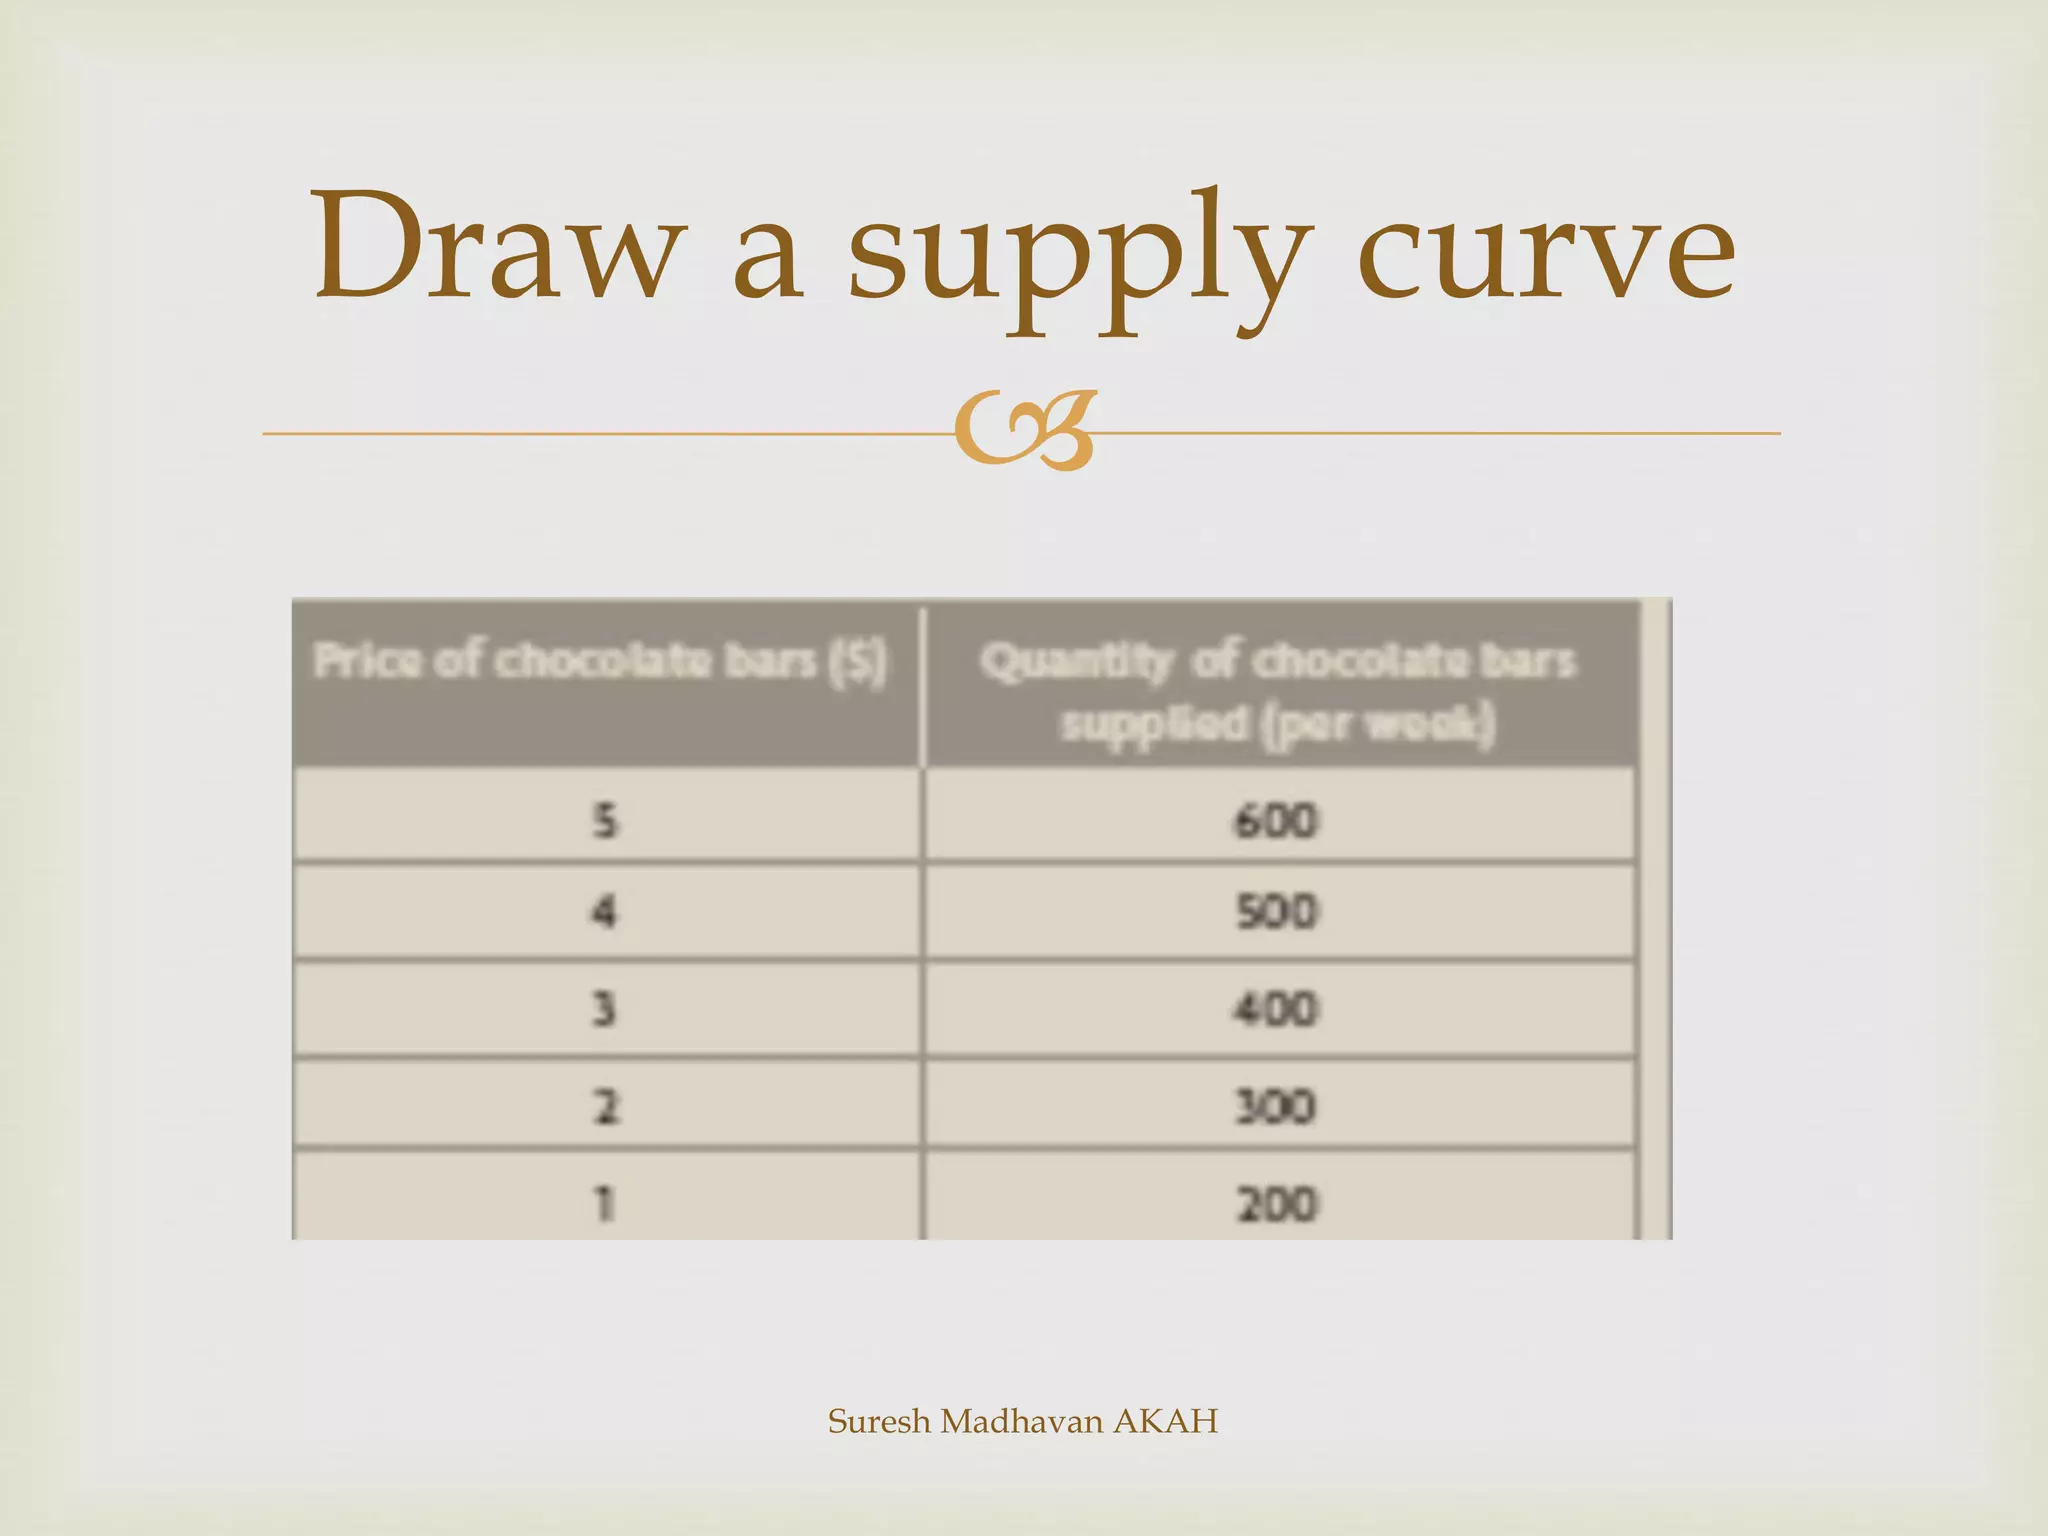
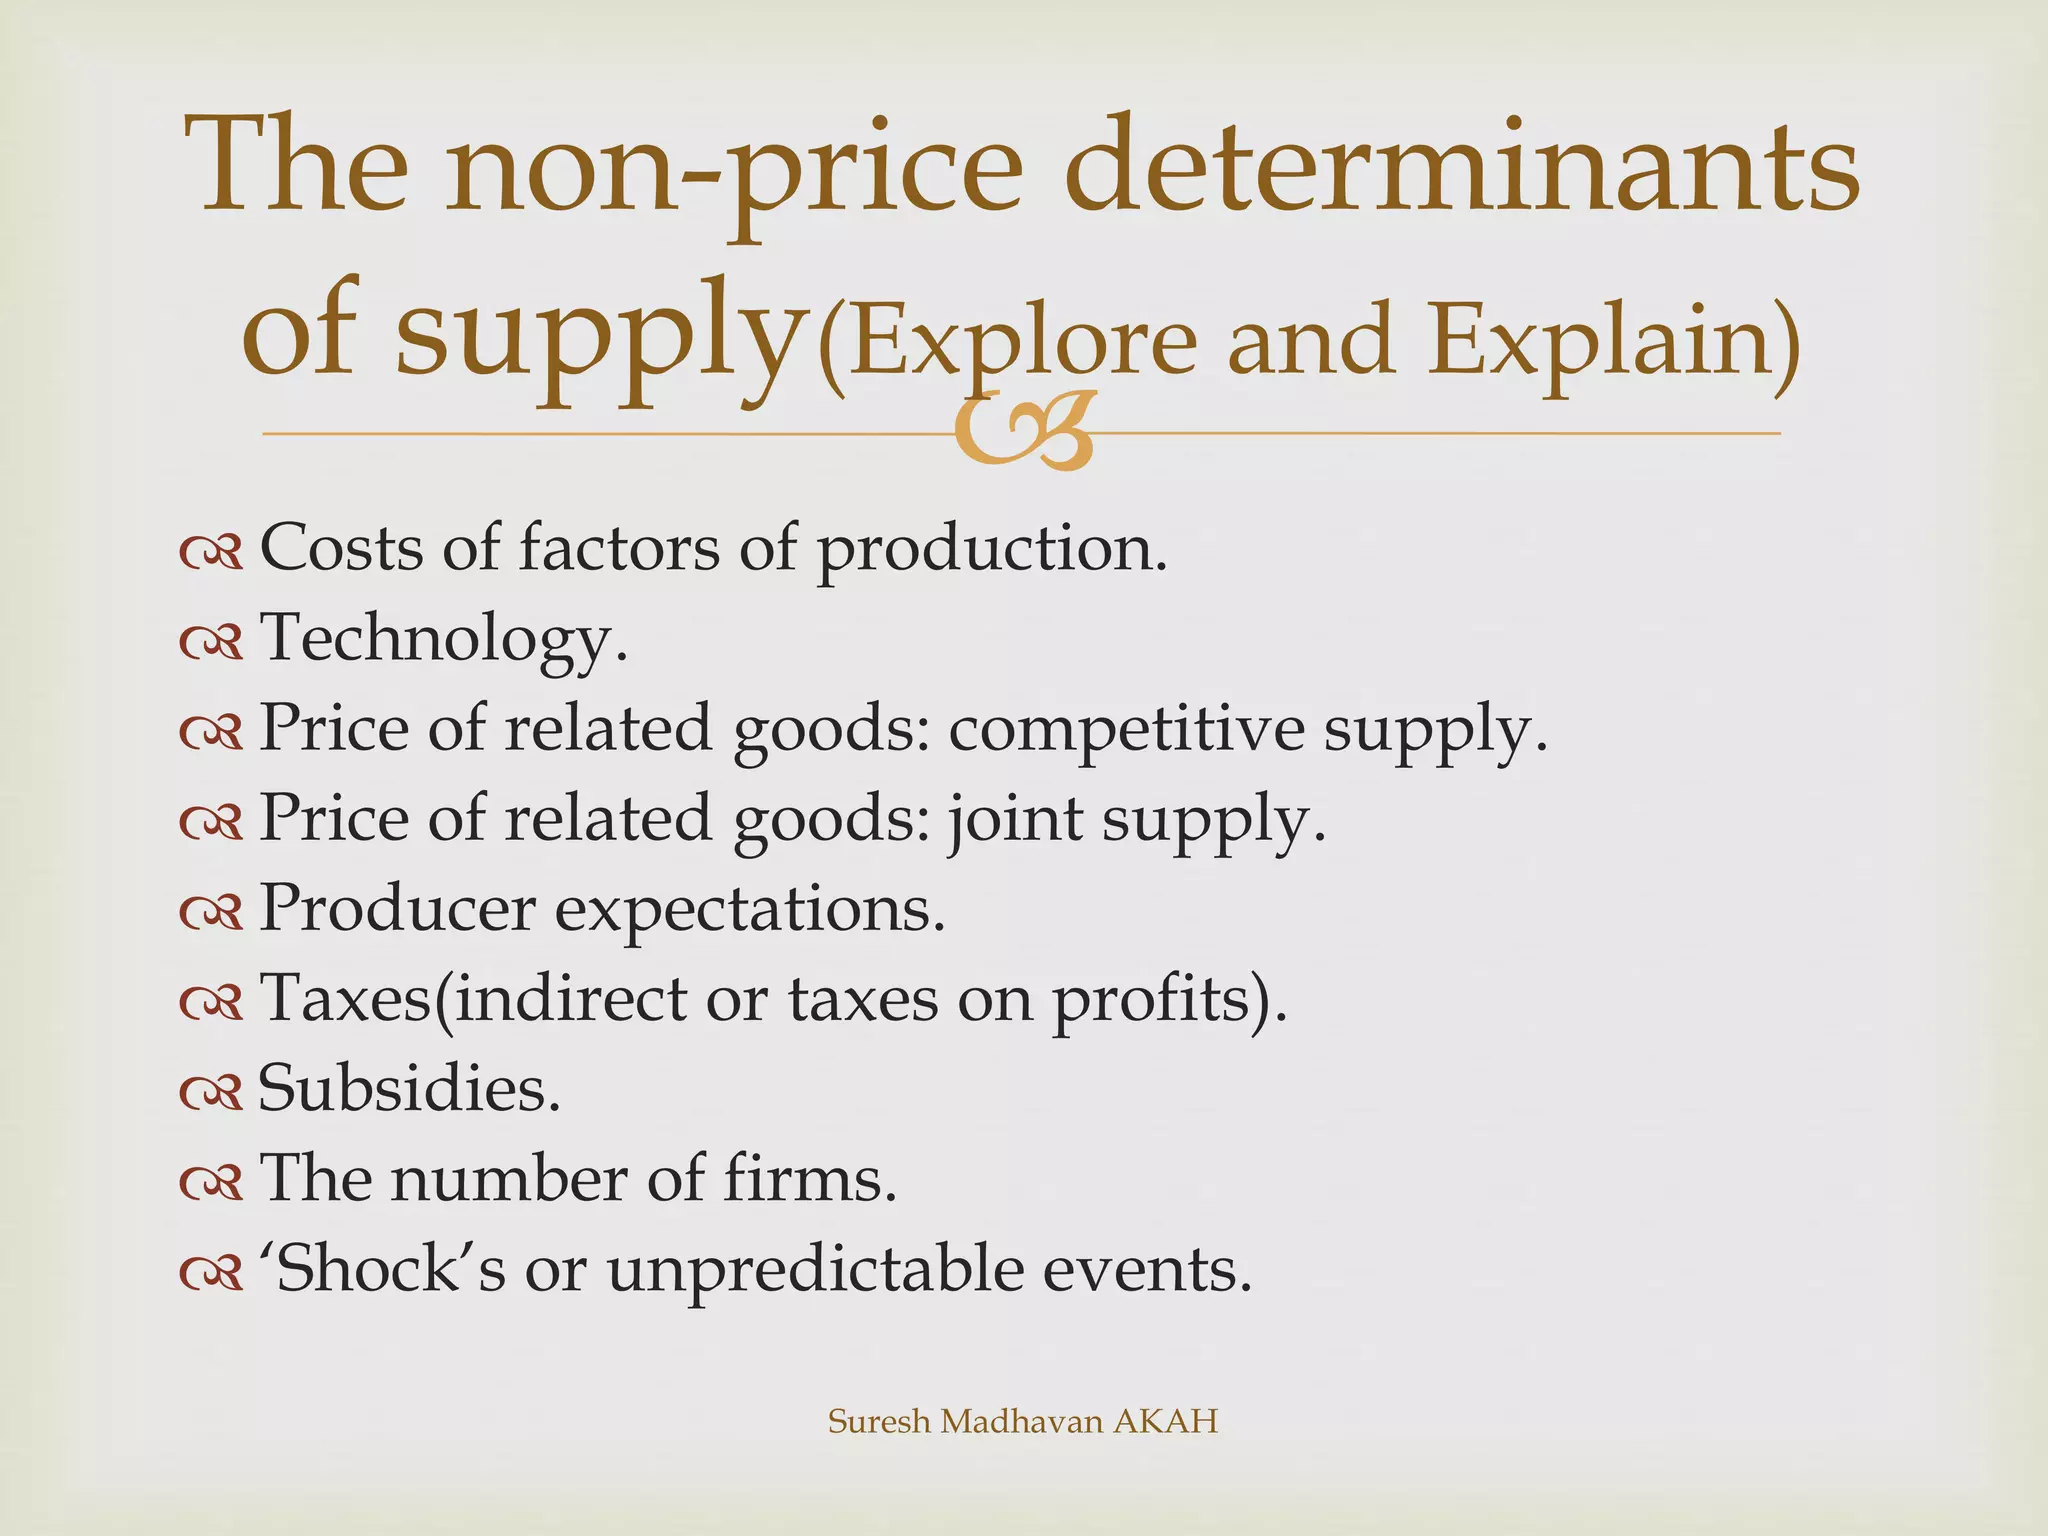
Introduction to supply, law of supply, market supply, upward supply slope, and non-price determinants.
Impact of various factors on the supply curve of a product, including technology and market conditions.
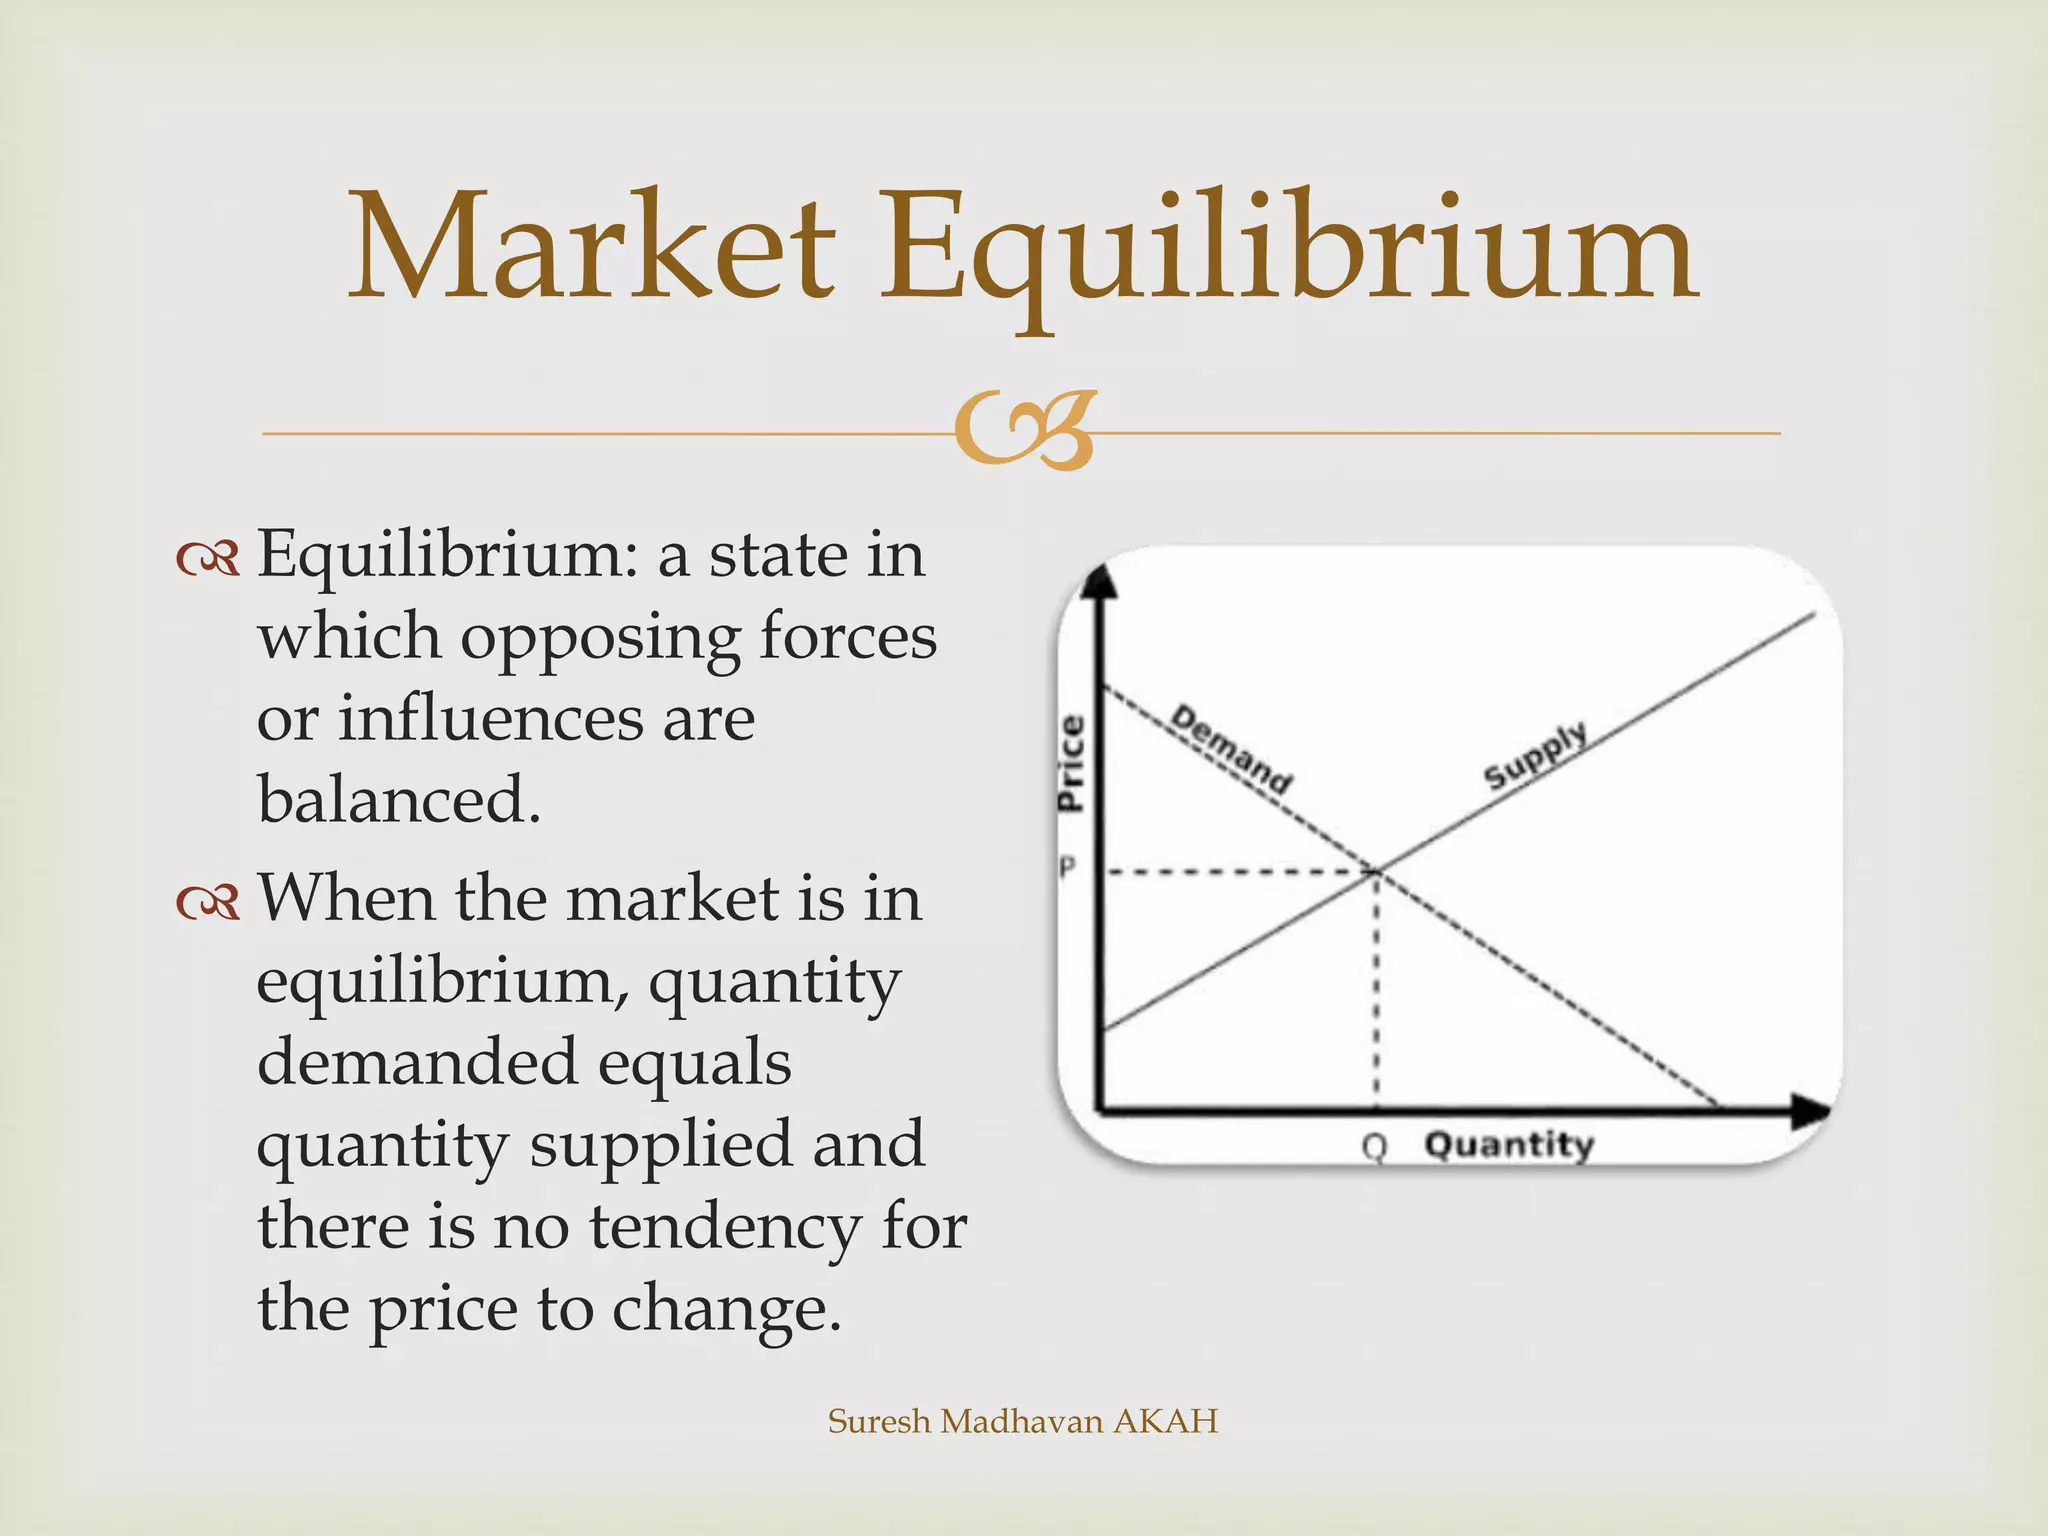
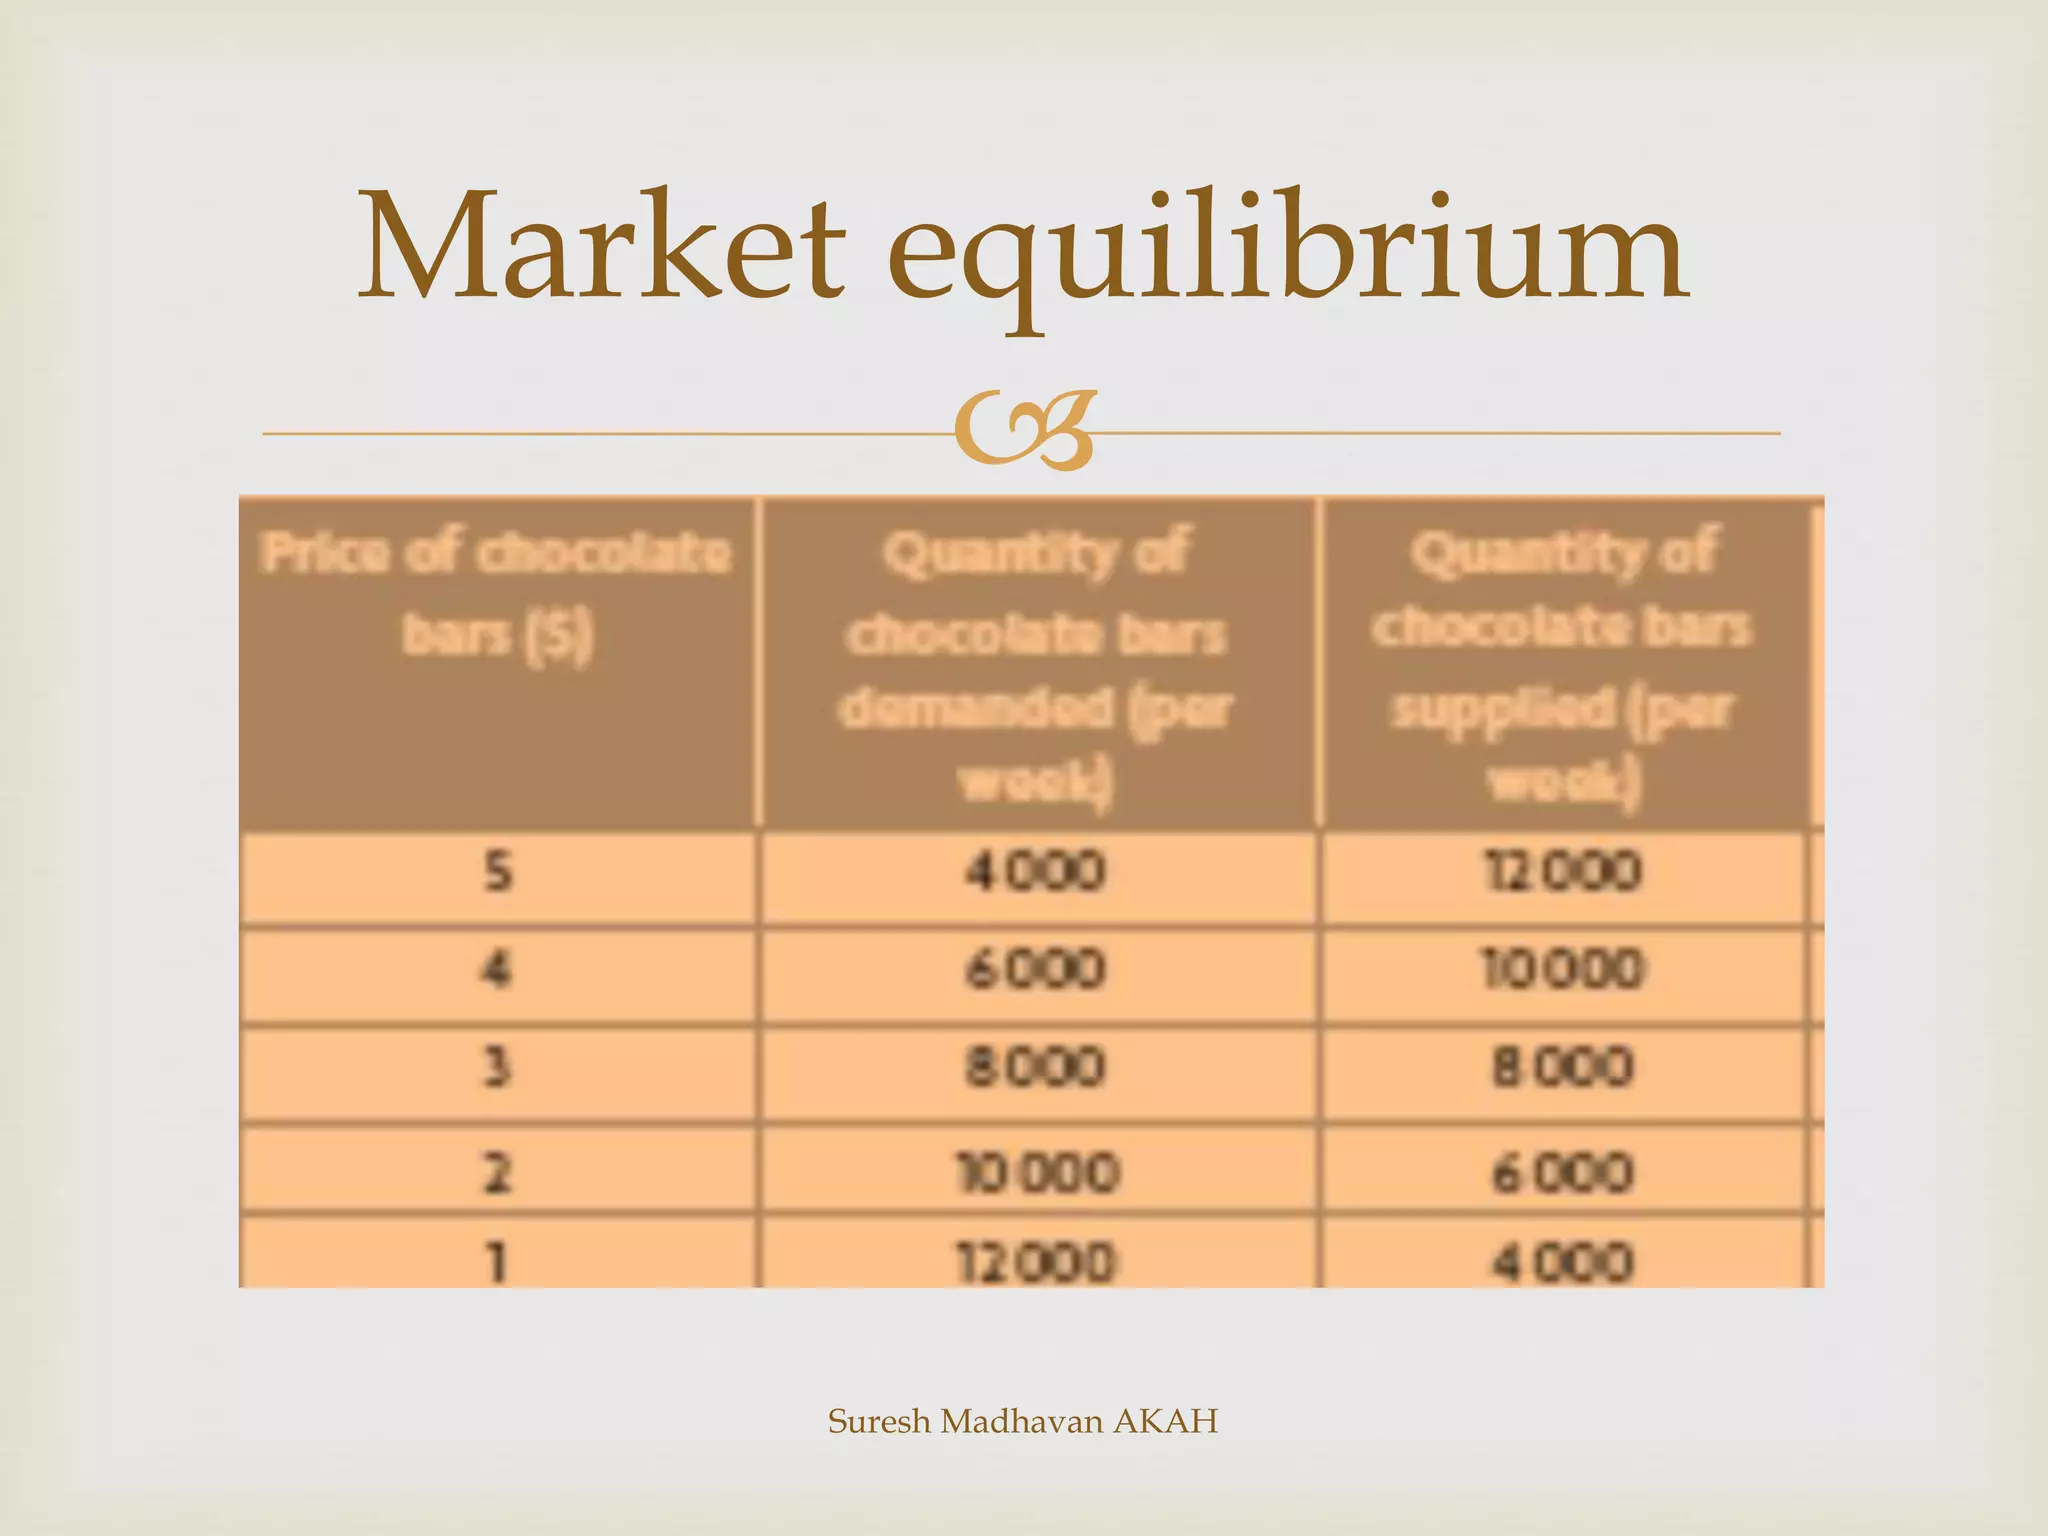
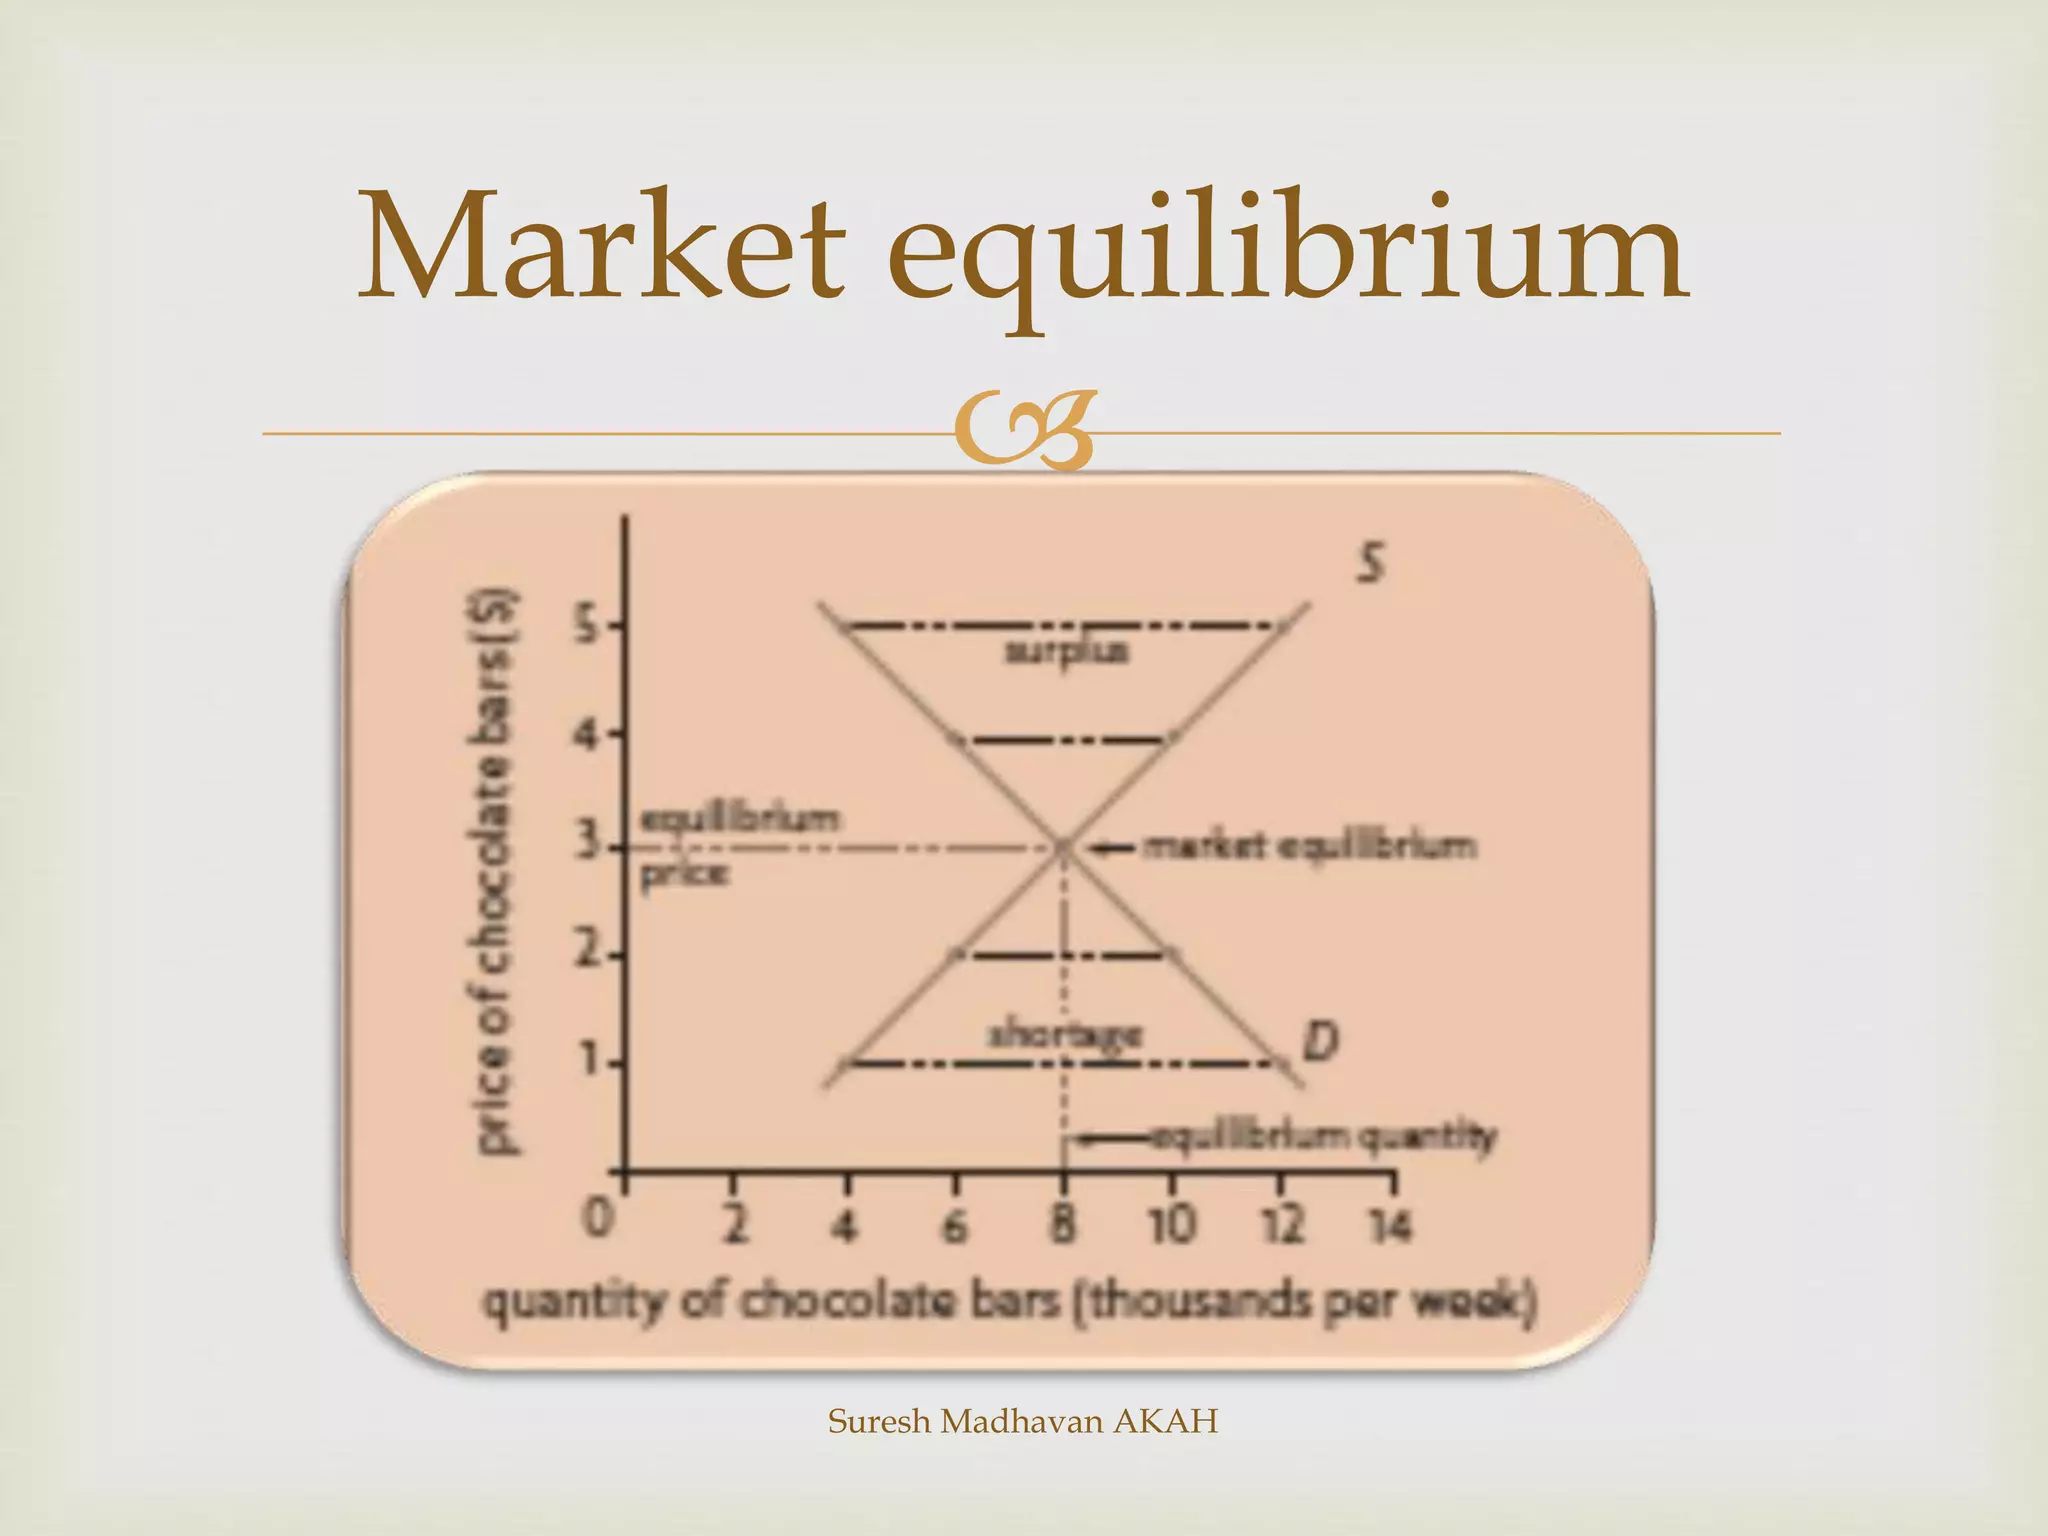
Concept of market equilibrium, surpluses, shortages, and adjustments towards equilibrium.
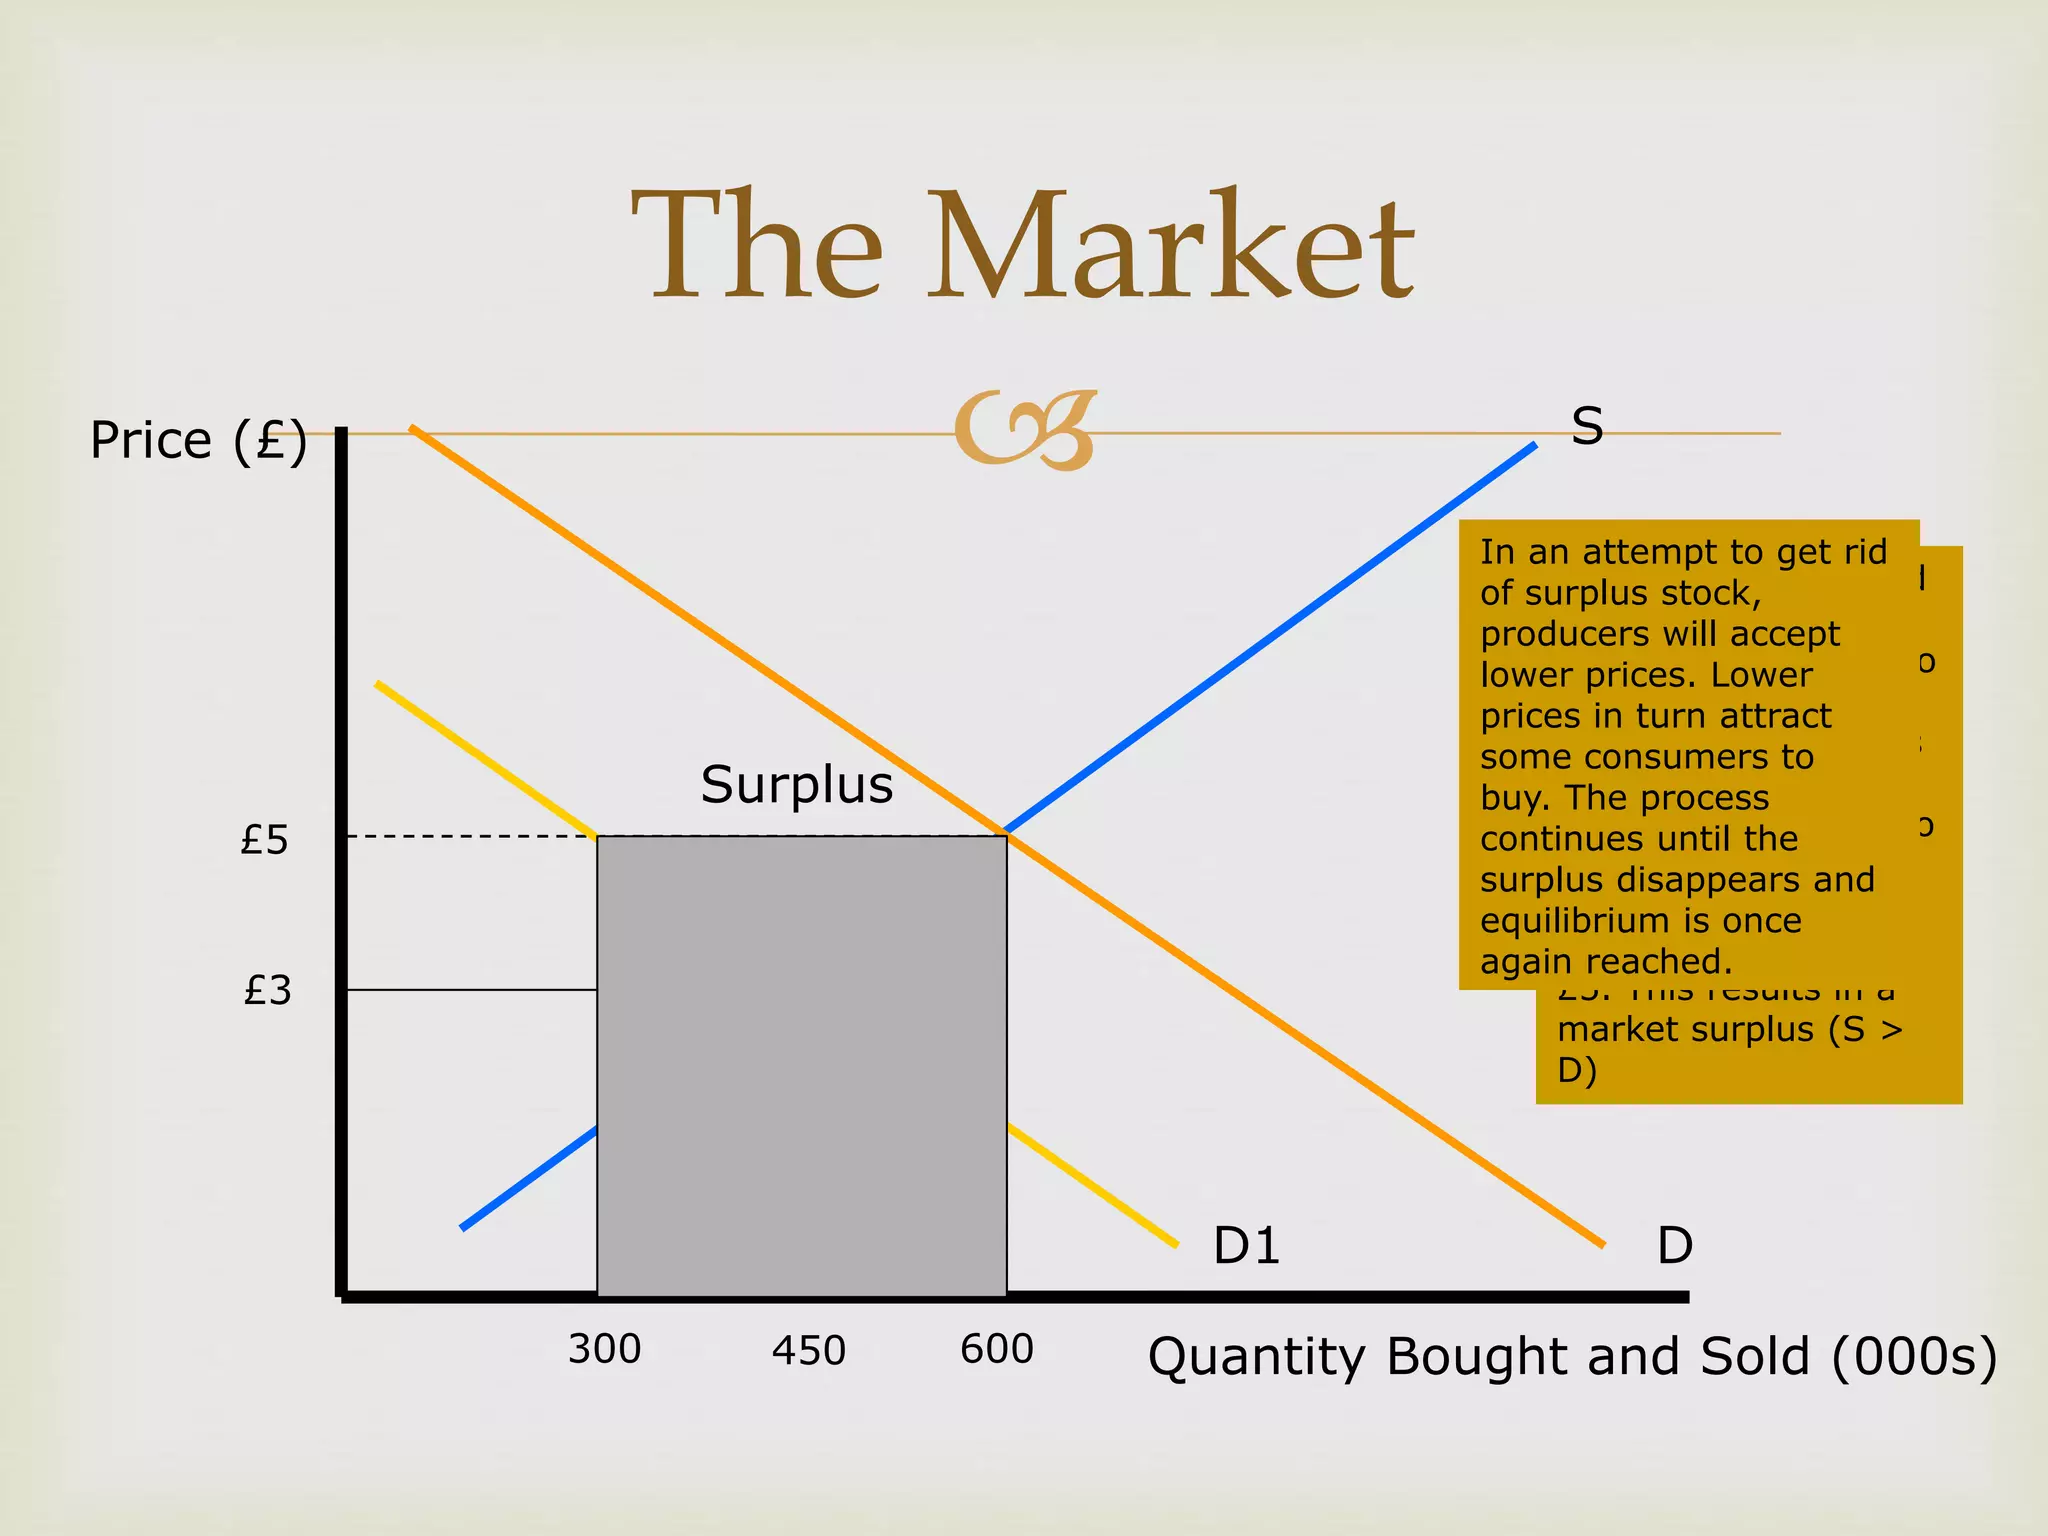
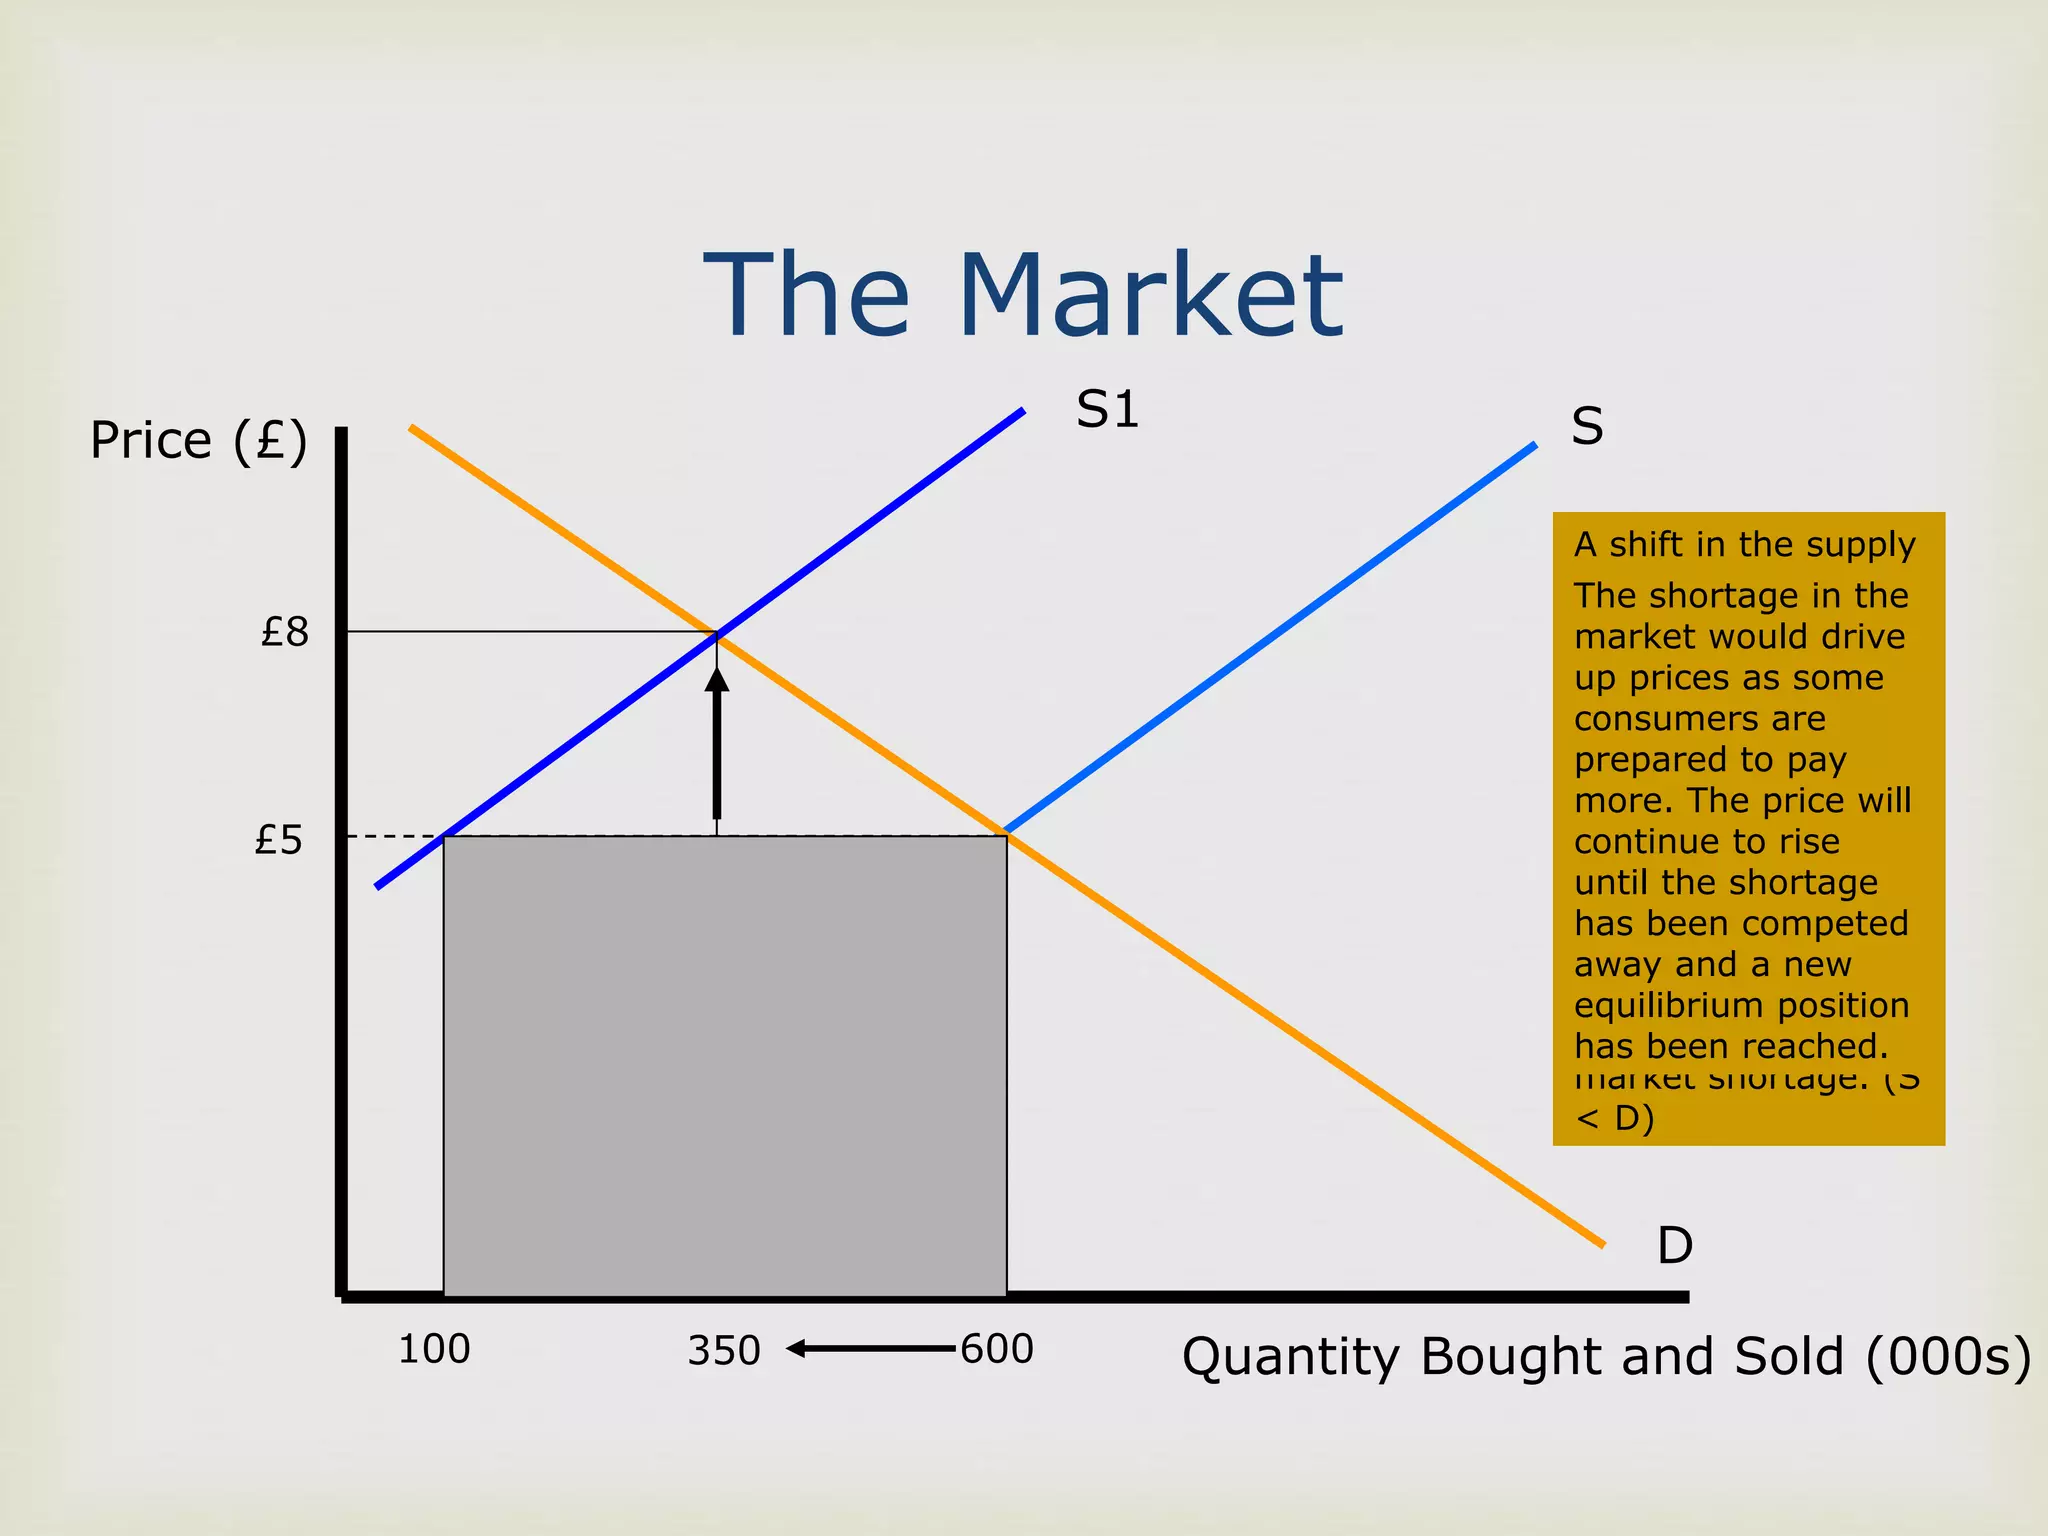
Impact of changes in supply and demand on market equilibrium through graphical analysis.
Literature and resources for further study in economics.