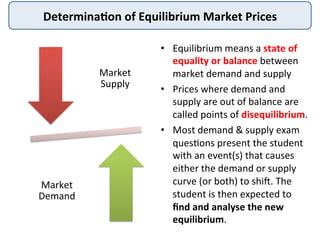
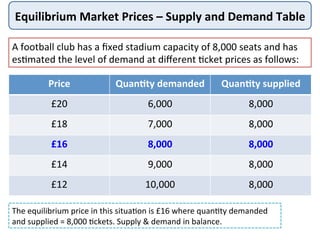
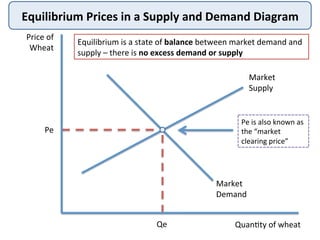
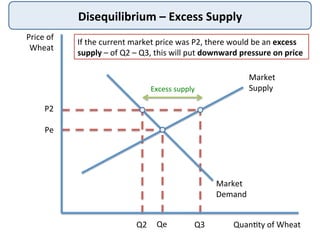
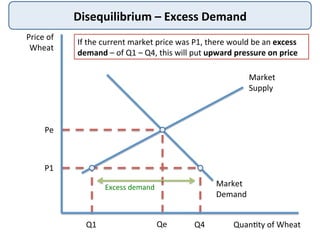
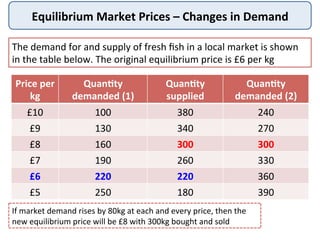
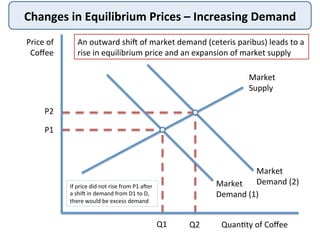
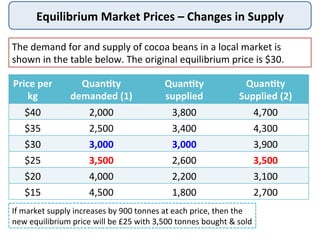
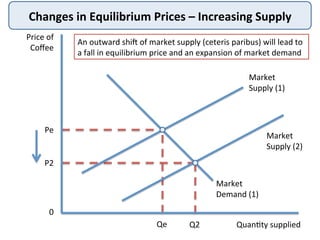
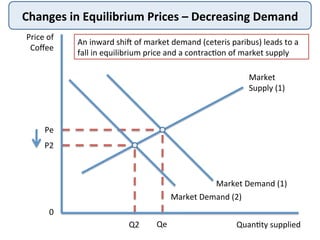
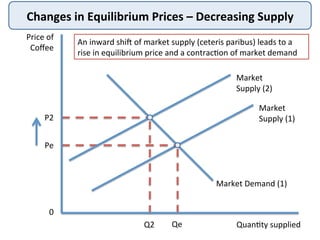
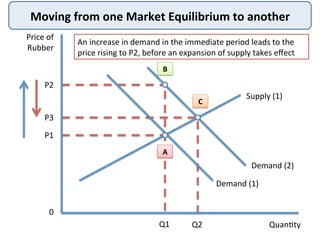
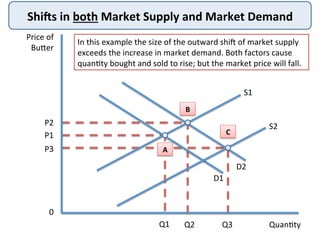
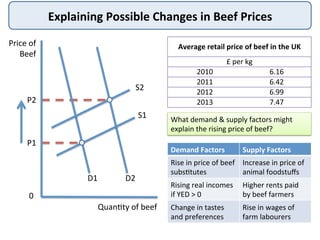
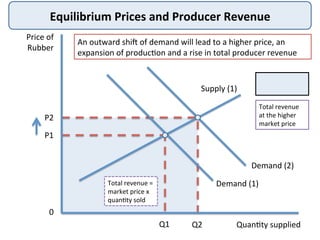
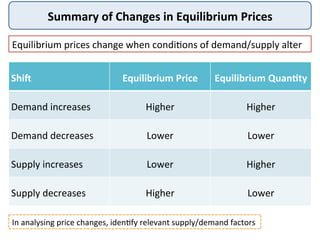
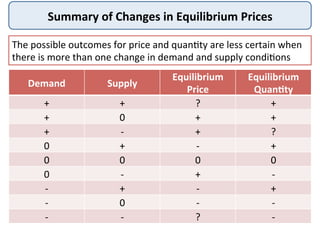
Price	
  Determina,on	
  
EdExcel	
  Economics	
  1.2.6	
  
Determina,on	
  of	
  Equilibrium	
  Market	
  Prices	
  
•  Equilibrium	
  means	
  a	
  state	
  of	
  
equality	
  or	
  balance	
  between	
  
market	
  demand	
  and	
  supply	
  
•  Prices	
  where	
  demand	
  and	
  
supply	
  are	
  out	
  of	
  balance	
  are	
  
called	
  points	
  of	
  disequilibrium.	
  	
  
•  Most	
  demand	
  &	
  supply	
  exam	
  
ques@ons	
  present	
  the	
  student	
  
with	
  an	
  event(s)	
  that	
  causes	
  
either	
  the	
  demand	
  or	
  supply	
  
curve	
  (or	
  both)	
  to	
  shiD.	
  The	
  
student	
  is	
  then	
  expected	
  to	
  
find	
  and	
  analyse	
  the	
  new	
  
equilibrium.	
  
Market	
  
Supply	
  
Market	
  
Demand	
  
Equilibrium	
  Market	
  Prices	
  –	
  Supply	
  and	
  Demand	
  Table	
  
Price	
   Quan,ty	
  demanded	
   Quan,ty	
  supplied	
  
£20	
   6,000	
   8,000	
  
£18	
   7,000	
   8,000	
  
£16	
   8,000	
   8,000	
  
£14	
   9,000	
   8,000	
  
£12	
   10,000	
   8,000	
  
A	
  football	
  club	
  has	
  a	
  fixed	
  stadium	
  capacity	
  of	
  8,000	
  seats	
  and	
  has	
  
es@mated	
  the	
  level	
  of	
  demand	
  at	
  different	
  @cket	
  prices	
  as	
  follows:	
  
The	
  equilibrium	
  price	
  in	
  this	
  situa@on	
  is	
  £16	
  where	
  quan@ty	
  demanded	
  
and	
  supplied	
  =	
  8,000	
  @ckets.	
  Supply	
  &	
  demand	
  in	
  balance.	
  
Equilibrium	
  Prices	
  in	
  a	
  Supply	
  and	
  Demand	
  Diagram	
  
Price	
  of	
  
Wheat	
  
Quan@ty	
  of	
  wheat	
  
Market	
  
Supply	
  
Pe	
  
Qe	
  
Equilibrium	
  is	
  a	
  state	
  of	
  balance	
  between	
  market	
  demand	
  and	
  
supply	
  –	
  there	
  is	
  no	
  excess	
  demand	
  or	
  supply	
  
Market	
  
Demand	
  
Pe	
  is	
  also	
  known	
  as	
  
the	
  “market	
  
clearing	
  price”	
  
Disequilibrium	
  –	
  Excess	
  Supply	
  
Price	
  of	
  
Wheat	
  
Quan@ty	
  of	
  Wheat	
  
Market	
  
Supply	
  
Pe	
  
Qe	
  
If	
  the	
  current	
  market	
  price	
  was	
  P2,	
  there	
  would	
  be	
  an	
  excess	
  
supply	
  –	
  of	
  Q2	
  –	
  Q3,	
  this	
  will	
  put	
  downward	
  pressure	
  on	
  price	
  
Market	
  
Demand	
  
P2	
  
Q2	
   Q3	
  
Excess	
  supply	
  
Disequilibrium	
  –	
  Excess	
  Demand	
  
Price	
  of	
  
Wheat	
  
Quan@ty	
  of	
  Wheat	
  
Market	
  
Supply	
  
Pe	
  
Qe	
  
If	
  the	
  current	
  market	
  price	
  was	
  P1,	
  there	
  would	
  be	
  an	
  excess	
  
demand	
  –	
  of	
  Q1	
  –	
  Q4,	
  this	
  will	
  put	
  upward	
  pressure	
  on	
  price	
  
Market	
  
Demand	
  
P1	
  
Q1	
   Q4	
  
Excess	
  demand	
  
Equilibrium	
  Market	
  Prices	
  –	
  Changes	
  in	
  Demand	
  
Price	
  per	
  
kg	
  
Quan,ty	
  	
  
demanded	
  (1)	
  
Quan,ty	
  
supplied	
  
Quan,ty	
  	
  
demanded	
  (2)	
  
£10	
   100	
   380	
   240	
  
£9	
   130	
   340	
   270	
  
£8	
   160	
   300	
   300	
  
£7	
   190	
   260	
   330	
  
£6	
   220	
   220	
   360	
  
£5	
   250	
   180	
   390	
  
The	
  demand	
  for	
  and	
  supply	
  of	
  fresh	
  fish	
  in	
  a	
  local	
  market	
  is	
  shown	
  
in	
  the	
  table	
  below.	
  The	
  original	
  equilibrium	
  price	
  is	
  £6	
  per	
  kg	
  
If	
  market	
  demand	
  rises	
  by	
  80kg	
  at	
  each	
  and	
  every	
  price,	
  then	
  the	
  
new	
  equilibrium	
  price	
  will	
  be	
  £8	
  with	
  300kg	
  bought	
  and	
  sold	
  
Changes	
  in	
  Equilibrium	
  Prices	
  –	
  Increasing	
  Demand	
  
Price	
  of	
  
Coffee	
  
Quan@ty	
  of	
  Coffee	
  
Market	
  
Supply	
  
P1	
  
Q1	
  
An	
  outward	
  shiD	
  of	
  market	
  demand	
  (ceteris	
  paribus)	
  leads	
  to	
  a	
  
rise	
  in	
  equilibrium	
  price	
  and	
  an	
  expansion	
  of	
  market	
  supply	
  
Market	
  
Demand	
  (1)	
  
Market	
  
Demand	
  (2)	
  
P2	
  
Q2	
  
If	
  price	
  did	
  not	
  rise	
  from	
  P1	
  aDer	
  
a	
  shiD	
  in	
  demand	
  from	
  D1	
  to	
  D,	
  
there	
  would	
  be	
  excess	
  demand	
  
Equilibrium	
  Market	
  Prices	
  –	
  Changes	
  in	
  Supply	
  
Price	
  per	
  
kg	
  
Quan,ty	
  	
  
demanded	
  (1)	
  
Quan,ty	
  
supplied	
  	
  
Quan,ty	
  	
  
Supplied	
  (2)	
  
$40	
   2,000	
   3,800	
   4,700	
  
$35	
   2,500	
   3,400	
   4,300	
  
$30	
   3,000	
   3,000	
   3,900	
  
$25	
   3,500	
   2,600	
   3,500	
  
$20	
   4,000	
   2,200	
   3,100	
  
$15	
   4,500	
   1,800	
   2,700	
  
The	
  demand	
  for	
  and	
  supply	
  of	
  cocoa	
  beans	
  in	
  a	
  local	
  market	
  is	
  
shown	
  in	
  the	
  table	
  below.	
  The	
  original	
  equilibrium	
  price	
  is	
  $30.	
  
If	
  market	
  supply	
  increases	
  by	
  900	
  tonnes	
  at	
  each	
  price,	
  then	
  the	
  
new	
  equilibrium	
  price	
  will	
  be	
  £25	
  with	
  3,500	
  tonnes	
  bought	
  &	
  sold	
  
Changes	
  in	
  Equilibrium	
  Prices	
  –	
  Increasing	
  Supply	
  
Price	
  of	
  
Coffee	
  
Quan@ty	
  supplied	
  
Market	
  
Supply	
  (1)	
  
Pe	
  
Qe	
  
An	
  outward	
  shiD	
  of	
  market	
  supply	
  (ceteris	
  paribus)	
  will	
  lead	
  to	
  
a	
  fall	
  in	
  equilibrium	
  price	
  and	
  an	
  expansion	
  of	
  market	
  demand	
  
Market	
  
Demand	
  (1)	
  
P2	
  
Q2	
  
Market	
  
Supply	
  (2)	
  
0	
  
Changes	
  in	
  Equilibrium	
  Prices	
  –	
  Decreasing	
  Demand	
  
Price	
  of	
  
Coffee	
  
Quan@ty	
  supplied	
  
Market	
  
Supply	
  (1)	
  
Pe	
  
Qe	
  
An	
  inward	
  shiD	
  of	
  market	
  demand	
  (ceteris	
  paribus)	
  leads	
  to	
  a	
  
fall	
  in	
  equilibrium	
  price	
  and	
  a	
  contrac@on	
  of	
  market	
  supply	
  
Market	
  Demand	
  (1)	
  
P2	
  
Q2	
  
Market	
  Demand	
  (2)	
  
0	
  
Changes	
  in	
  Equilibrium	
  Prices	
  –	
  Decreasing	
  Supply	
  
Price	
  of	
  
Coffee	
  
Quan@ty	
  supplied	
  
Market	
  
Supply	
  (1)	
  
Pe	
  
Qe	
  
An	
  inward	
  shiD	
  of	
  market	
  supply	
  (ceteris	
  paribus)	
  leads	
  to	
  a	
  
rise	
  in	
  equilibrium	
  price	
  and	
  a	
  contrac@on	
  of	
  market	
  demand	
  
Market	
  Demand	
  (1)	
  
P2	
  
Q2	
  
Market	
  
Supply	
  (2)	
  
0	
  
Moving	
  from	
  one	
  Market	
  Equilibrium	
  to	
  another	
  
Price	
  of	
  
Rubber	
  
Quan@ty	
  
P1	
  
Q1	
  
An	
  increase	
  in	
  demand	
  in	
  the	
  immediate	
  period	
  leads	
  to	
  the	
  
price	
  rising	
  to	
  P2,	
  before	
  an	
  expansion	
  of	
  supply	
  takes	
  effect	
  
Demand	
  (1)	
  
P3	
  
Q2	
  
Supply	
  (1)	
  
Demand	
  (2)	
  
P2	
  
A	
  
B	
  
C	
  
0	
  
ShiSs	
  in	
  both	
  Market	
  Supply	
  and	
  Market	
  Demand	
  
Price	
  of	
  
Buaer	
  
Quan@ty	
  
P1	
  
Q1	
  
In	
  this	
  example	
  the	
  size	
  of	
  the	
  outward	
  shiD	
  of	
  market	
  supply	
  
exceeds	
  the	
  increase	
  in	
  market	
  demand.	
  Both	
  factors	
  cause	
  
quan@ty	
  bought	
  and	
  sold	
  to	
  rise;	
  but	
  the	
  market	
  price	
  will	
  fall.	
  
D1	
  
P3	
  
Q2	
  
S1	
  
P2	
   S2	
  
D2	
  
Q3	
  
A	
  
B	
  
C	
  
0	
  
Explaining	
  Possible	
  Changes	
  in	
  Beef	
  Prices	
  
Price	
  of	
  
Beef	
  
Quan@ty	
  of	
  beef	
  
Average	
  retail	
  price	
  of	
  beef	
  in	
  the	
  UK	
  
£	
  per	
  kg
2010 6.16
2011 6.42
2012 6.99
2013 7.47
What	
  demand	
  &	
  supply	
  factors	
  might	
  
explain	
  the	
  rising	
  price	
  of	
  beef?	
  
Demand	
  Factors	
   Supply	
  Factors	
  
Rise	
  in	
  price	
  of	
  beef	
  
subs@tutes	
  
Increase	
  in	
  price	
  of	
  
animal	
  foodstuffs	
  
Rising	
  real	
  incomes	
  
if	
  YED	
  >	
  0	
  
Higher	
  rents	
  paid	
  
by	
  beef	
  farmers	
  
Change	
  in	
  tastes	
  
and	
  preferences	
  
Rise	
  in	
  wages	
  of	
  
farm	
  labourers	
  
D1	
   D2	
  
S1	
  
S2	
  
P1	
  
P2	
  
0	
  
Real	
  World:	
  Explaining	
  Changes	
  in	
  UK	
  Footwear	
  Prices	
  
80	
  
85	
  
90	
  
95	
  
100	
  
105	
  
110	
  
2003	
  
2004	
  
2005	
  
2006	
  
2007	
  
2008	
  
2009	
  
2010	
  
2011	
  
2012	
  
2013	
  
2014	
  
Consumer	
  price	
  index	
  for	
  footwear	
  products	
  in	
  UK	
  
Global	
  compe@@on	
  
from	
  lower	
  cost	
  
countries	
  
Intense	
  retail	
  
compe@@on	
  on	
  the	
  
high	
  street	
  and	
  
online	
  
Falling	
  input	
  costs	
  
have	
  increased	
  
market	
  supply	
  
Strong	
  exchange	
  rate	
  
–	
  which	
  makes	
  
imports	
  of	
  shoes	
  
cheaper	
  
Likely	
  Effects	
  of	
  Changes	
  in	
  UK	
  Wheat	
  Prices	
  
0	
  
20	
  
40	
  
60	
  
80	
  
100	
  
120	
  
140	
  
160	
  
180	
  
200	
  
2002	
  
2003	
  
2004	
  
2005	
  
2006	
  
2007	
  
2008	
  
2009	
  
2010	
  
2011	
  
2012	
  
2013	
  
2014	
  
2015*	
  
Price	
  per	
  tonne	
  in	
  £s	
  
UK	
  wheat	
  price,	
  average	
  price	
  per	
  tonne	
  (£)	
  
•  Lower	
  prices	
  may	
  cause	
  a	
  
contrac@on	
  of	
  wheat	
  supply	
  
Produc@on	
  
•  Lower	
  revenues	
  might	
  
damage	
  incomes	
  for	
  farmers	
  
Revenues	
  and	
  Profits	
  
•  Bread	
  manufacturers	
  will	
  
benefit	
  from	
  lower	
  wheat	
  
prices	
  –	
  their	
  input	
  costs	
  
have	
  fallen	
  
Manufacturing	
  costs	
  
Equilibrium	
  Prices	
  and	
  Producer	
  Revenue	
  
Price	
  of	
  
Rubber	
  
Quan@ty	
  supplied	
  
P1	
  
Q1	
  
An	
  outward	
  shiD	
  of	
  demand	
  will	
  lead	
  to	
  a	
  higher	
  price,	
  an	
  
expansion	
  of	
  produc@on	
  and	
  a	
  rise	
  in	
  total	
  producer	
  revenue	
  
Demand	
  (1)	
  
P2	
  
Q2	
  
Supply	
  (1)	
  
Demand	
  (2)	
  
Total	
  revenue	
  
at	
  the	
  higher	
  
market	
  price	
  
0	
  
Total	
  revenue	
  =	
  
market	
  price	
  x	
  
quan@ty	
  sold	
  
Summary	
  of	
  Changes	
  in	
  Equilibrium	
  Prices	
  
Equilibrium	
  prices	
  change	
  when	
  condi@ons	
  of	
  demand/supply	
  alter	
  
ShiS	
   Equilibrium	
  Price	
   Equilibrium	
  Quan,ty	
  
Demand	
  increases	
   Higher	
   Higher	
  
Demand	
  decreases	
   Lower	
   Lower	
  
Supply	
  increases	
   Lower	
   Higher	
  
Supply	
  decreases	
   Higher	
   Lower	
  
In	
  analysing	
  price	
  changes,	
  iden@fy	
  relevant	
  supply/demand	
  factors	
  
Summary	
  of	
  Changes	
  in	
  Equilibrium	
  Prices	
  
Demand Supply
Equilibrium	
  
Price
Equilibrium	
  
Quan,ty
+ + ? +
+ 0 + +
+ -­‐ + ?
0 + -­‐ +
0 0 0 0
0 -­‐ + -­‐
-­‐ + -­‐ +
-­‐ 0 -­‐ -­‐
-­‐ -­‐ ? -­‐
The	
  possible	
  outcomes	
  for	
  price	
  and	
  quan@ty	
  are	
  less	
  certain	
  when	
  
there	
  is	
  more	
  than	
  one	
  change	
  in	
  demand	
  and	
  supply	
  condi@ons	
  
Regulated	
  Prices	
  and	
  Industry	
  Regulators	
  
•  Not	
  all	
  prices	
  are	
  set	
  by	
  the	
  free-­‐
market	
  forces	
  of	
  supply	
  and	
  demand.	
  	
  
•  In	
  Britain,	
  a	
  number	
  of	
  prices	
  are	
  
affected	
  by	
  regulators	
  who	
  may	
  
impose	
  a	
  pricing	
  formula	
  on	
  suppliers	
  
•  Good	
  examples	
  are	
  rail	
  fares,	
  the	
  cost	
  
of	
  postage	
  stamps	
  and	
  water	
  bills.	
  
•  In	
  the	
  UK	
  rail	
  industry,	
  some	
  fares	
  are	
  
unregulated	
  allowing	
  train	
  opera@ng	
  
companies	
  to	
  set	
  their	
  own	
  prices.	
  	
  
•  But	
  around	
  half	
  of	
  the	
  fares	
  charged	
  
for	
  rail	
  travellers	
  are	
  set	
  by	
  the	
  rail	
  
regulator.	
  	
  
The	
  EU	
  has	
  capped	
  
mobile	
  phone	
  
roaming	
  charges	
  
Many	
  rail	
  fares	
  in	
  the	
  
UK	
  are	
  heavily	
  
regulated	
  
9	
  
8	
  
6	
  
0	
  
1	
  
2	
  
3	
  
4	
  
5	
  
6	
  
7	
  
8	
  
9	
  
10	
  
July	
  2012	
   July	
  2013	
   July	
  2014	
  
Price	
  cap	
  in	
  Euro	
  cents	
  	
  
Mobile	
  Phone	
  Price	
  Caps	
  Set	
  by	
  the	
  European	
  Union	
  
70	
  
45	
  
20	
  
0	
  
10	
  
20	
  
30	
  
40	
  
50	
  
60	
  
70	
  
80	
  
July	
  2012	
   July	
  2013	
   July	
  2014	
  
Price	
  cap	
  in	
  Euro	
  cents	
  per	
  MB	
  	
  
EU	
  Price	
  caps	
  on	
  text	
  
messages	
  (SMS)	
  	
  
EU	
  Price	
  caps	
  on	
  mobile	
  
data	
  roaming	
  	
  
ADer	
  interven@on	
  by	
  the	
  EU	
  Compe@@on	
  Commission,	
  from	
  15	
  June	
  2017,	
  those	
  travelling	
  
within	
  the	
  EU	
  will	
  be	
  able	
  to	
  use	
  their	
  mobile	
  internet	
  abroad	
  at	
  no	
  extra	
  charge.	
  
Consumer	
  Price	
  Index	
  for	
  UK	
  Rail	
  Fares	
  2003-­‐2014	
  
92.5	
   96.3	
   100	
   104.2	
  
109.4	
  
114.2	
  
120.6	
  
130.5	
  
139.3	
  
146.3	
  
152	
  
157	
  
0	
  
20	
  
40	
  
60	
  
80	
  
100	
  
120	
  
140	
  
160	
  
180	
  
2003	
   2004	
   2005	
   2006	
   2007	
   2008	
   2009	
   2010	
   2011	
   2012	
   2013	
   2014	
  
Consumer	
  price	
  index	
  for	
  rail	
  fares	
  
2005=100	
  
Around	
  45	
  per	
  cent	
  of	
  UK	
  rail	
  fares	
  are	
  subject	
  to	
  regula@on	
  (since	
  2015	
  this	
  is	
  
limited	
  to	
  the	
  rate	
  of	
  RPI	
  infla@on.	
  All	
  other	
  fares	
  are	
  set	
  at	
  a	
  commercial	
  rate	
  by	
  
the	
  train	
  opera@ng	
  companies	
  such	
  as	
  First	
  Great	
  Western	
  and	
  Virgin	
  Trains	
  
Price	
  Determina,on	
  
EdExcel	
  Economics	
  1.2.6	
  

Price determination

  • 1.
    Price  Determina,on   EdExcel  Economics  1.2.6  
  • 2.
    Determina,on  of  Equilibrium  Market  Prices   •  Equilibrium  means  a  state  of   equality  or  balance  between   market  demand  and  supply   •  Prices  where  demand  and   supply  are  out  of  balance  are   called  points  of  disequilibrium.     •  Most  demand  &  supply  exam   ques@ons  present  the  student   with  an  event(s)  that  causes   either  the  demand  or  supply   curve  (or  both)  to  shiD.  The   student  is  then  expected  to   find  and  analyse  the  new   equilibrium.   Market   Supply   Market   Demand  
  • 3.
    Equilibrium  Market  Prices  –  Supply  and  Demand  Table   Price   Quan,ty  demanded   Quan,ty  supplied   £20   6,000   8,000   £18   7,000   8,000   £16   8,000   8,000   £14   9,000   8,000   £12   10,000   8,000   A  football  club  has  a  fixed  stadium  capacity  of  8,000  seats  and  has   es@mated  the  level  of  demand  at  different  @cket  prices  as  follows:   The  equilibrium  price  in  this  situa@on  is  £16  where  quan@ty  demanded   and  supplied  =  8,000  @ckets.  Supply  &  demand  in  balance.  
  • 4.
    Equilibrium  Prices  in  a  Supply  and  Demand  Diagram   Price  of   Wheat   Quan@ty  of  wheat   Market   Supply   Pe   Qe   Equilibrium  is  a  state  of  balance  between  market  demand  and   supply  –  there  is  no  excess  demand  or  supply   Market   Demand   Pe  is  also  known  as   the  “market   clearing  price”  
  • 5.
    Disequilibrium  –  Excess  Supply   Price  of   Wheat   Quan@ty  of  Wheat   Market   Supply   Pe   Qe   If  the  current  market  price  was  P2,  there  would  be  an  excess   supply  –  of  Q2  –  Q3,  this  will  put  downward  pressure  on  price   Market   Demand   P2   Q2   Q3   Excess  supply  
  • 6.
    Disequilibrium  –  Excess  Demand   Price  of   Wheat   Quan@ty  of  Wheat   Market   Supply   Pe   Qe   If  the  current  market  price  was  P1,  there  would  be  an  excess   demand  –  of  Q1  –  Q4,  this  will  put  upward  pressure  on  price   Market   Demand   P1   Q1   Q4   Excess  demand  
  • 7.
    Equilibrium  Market  Prices  –  Changes  in  Demand   Price  per   kg   Quan,ty     demanded  (1)   Quan,ty   supplied   Quan,ty     demanded  (2)   £10   100   380   240   £9   130   340   270   £8   160   300   300   £7   190   260   330   £6   220   220   360   £5   250   180   390   The  demand  for  and  supply  of  fresh  fish  in  a  local  market  is  shown   in  the  table  below.  The  original  equilibrium  price  is  £6  per  kg   If  market  demand  rises  by  80kg  at  each  and  every  price,  then  the   new  equilibrium  price  will  be  £8  with  300kg  bought  and  sold  
  • 8.
    Changes  in  Equilibrium  Prices  –  Increasing  Demand   Price  of   Coffee   Quan@ty  of  Coffee   Market   Supply   P1   Q1   An  outward  shiD  of  market  demand  (ceteris  paribus)  leads  to  a   rise  in  equilibrium  price  and  an  expansion  of  market  supply   Market   Demand  (1)   Market   Demand  (2)   P2   Q2   If  price  did  not  rise  from  P1  aDer   a  shiD  in  demand  from  D1  to  D,   there  would  be  excess  demand  
  • 9.
    Equilibrium  Market  Prices  –  Changes  in  Supply   Price  per   kg   Quan,ty     demanded  (1)   Quan,ty   supplied     Quan,ty     Supplied  (2)   $40   2,000   3,800   4,700   $35   2,500   3,400   4,300   $30   3,000   3,000   3,900   $25   3,500   2,600   3,500   $20   4,000   2,200   3,100   $15   4,500   1,800   2,700   The  demand  for  and  supply  of  cocoa  beans  in  a  local  market  is   shown  in  the  table  below.  The  original  equilibrium  price  is  $30.   If  market  supply  increases  by  900  tonnes  at  each  price,  then  the   new  equilibrium  price  will  be  £25  with  3,500  tonnes  bought  &  sold  
  • 10.
    Changes  in  Equilibrium  Prices  –  Increasing  Supply   Price  of   Coffee   Quan@ty  supplied   Market   Supply  (1)   Pe   Qe   An  outward  shiD  of  market  supply  (ceteris  paribus)  will  lead  to   a  fall  in  equilibrium  price  and  an  expansion  of  market  demand   Market   Demand  (1)   P2   Q2   Market   Supply  (2)   0  
  • 11.
    Changes  in  Equilibrium  Prices  –  Decreasing  Demand   Price  of   Coffee   Quan@ty  supplied   Market   Supply  (1)   Pe   Qe   An  inward  shiD  of  market  demand  (ceteris  paribus)  leads  to  a   fall  in  equilibrium  price  and  a  contrac@on  of  market  supply   Market  Demand  (1)   P2   Q2   Market  Demand  (2)   0  
  • 12.
    Changes  in  Equilibrium  Prices  –  Decreasing  Supply   Price  of   Coffee   Quan@ty  supplied   Market   Supply  (1)   Pe   Qe   An  inward  shiD  of  market  supply  (ceteris  paribus)  leads  to  a   rise  in  equilibrium  price  and  a  contrac@on  of  market  demand   Market  Demand  (1)   P2   Q2   Market   Supply  (2)   0  
  • 13.
    Moving  from  one  Market  Equilibrium  to  another   Price  of   Rubber   Quan@ty   P1   Q1   An  increase  in  demand  in  the  immediate  period  leads  to  the   price  rising  to  P2,  before  an  expansion  of  supply  takes  effect   Demand  (1)   P3   Q2   Supply  (1)   Demand  (2)   P2   A   B   C   0  
  • 14.
    ShiSs  in  both  Market  Supply  and  Market  Demand   Price  of   Buaer   Quan@ty   P1   Q1   In  this  example  the  size  of  the  outward  shiD  of  market  supply   exceeds  the  increase  in  market  demand.  Both  factors  cause   quan@ty  bought  and  sold  to  rise;  but  the  market  price  will  fall.   D1   P3   Q2   S1   P2   S2   D2   Q3   A   B   C   0  
  • 15.
    Explaining  Possible  Changes  in  Beef  Prices   Price  of   Beef   Quan@ty  of  beef   Average  retail  price  of  beef  in  the  UK   £  per  kg 2010 6.16 2011 6.42 2012 6.99 2013 7.47 What  demand  &  supply  factors  might   explain  the  rising  price  of  beef?   Demand  Factors   Supply  Factors   Rise  in  price  of  beef   subs@tutes   Increase  in  price  of   animal  foodstuffs   Rising  real  incomes   if  YED  >  0   Higher  rents  paid   by  beef  farmers   Change  in  tastes   and  preferences   Rise  in  wages  of   farm  labourers   D1   D2   S1   S2   P1   P2   0  
  • 16.
    Real  World:  Explaining  Changes  in  UK  Footwear  Prices   80   85   90   95   100   105   110   2003   2004   2005   2006   2007   2008   2009   2010   2011   2012   2013   2014   Consumer  price  index  for  footwear  products  in  UK   Global  compe@@on   from  lower  cost   countries   Intense  retail   compe@@on  on  the   high  street  and   online   Falling  input  costs   have  increased   market  supply   Strong  exchange  rate   –  which  makes   imports  of  shoes   cheaper  
  • 17.
    Likely  Effects  of  Changes  in  UK  Wheat  Prices   0   20   40   60   80   100   120   140   160   180   200   2002   2003   2004   2005   2006   2007   2008   2009   2010   2011   2012   2013   2014   2015*   Price  per  tonne  in  £s   UK  wheat  price,  average  price  per  tonne  (£)   •  Lower  prices  may  cause  a   contrac@on  of  wheat  supply   Produc@on   •  Lower  revenues  might   damage  incomes  for  farmers   Revenues  and  Profits   •  Bread  manufacturers  will   benefit  from  lower  wheat   prices  –  their  input  costs   have  fallen   Manufacturing  costs  
  • 18.
    Equilibrium  Prices  and  Producer  Revenue   Price  of   Rubber   Quan@ty  supplied   P1   Q1   An  outward  shiD  of  demand  will  lead  to  a  higher  price,  an   expansion  of  produc@on  and  a  rise  in  total  producer  revenue   Demand  (1)   P2   Q2   Supply  (1)   Demand  (2)   Total  revenue   at  the  higher   market  price   0   Total  revenue  =   market  price  x   quan@ty  sold  
  • 19.
    Summary  of  Changes  in  Equilibrium  Prices   Equilibrium  prices  change  when  condi@ons  of  demand/supply  alter   ShiS   Equilibrium  Price   Equilibrium  Quan,ty   Demand  increases   Higher   Higher   Demand  decreases   Lower   Lower   Supply  increases   Lower   Higher   Supply  decreases   Higher   Lower   In  analysing  price  changes,  iden@fy  relevant  supply/demand  factors  
  • 20.
    Summary  of  Changes  in  Equilibrium  Prices   Demand Supply Equilibrium   Price Equilibrium   Quan,ty + + ? + + 0 + + + -­‐ + ? 0 + -­‐ + 0 0 0 0 0 -­‐ + -­‐ -­‐ + -­‐ + -­‐ 0 -­‐ -­‐ -­‐ -­‐ ? -­‐ The  possible  outcomes  for  price  and  quan@ty  are  less  certain  when   there  is  more  than  one  change  in  demand  and  supply  condi@ons  
  • 21.
    Regulated  Prices  and  Industry  Regulators   •  Not  all  prices  are  set  by  the  free-­‐ market  forces  of  supply  and  demand.     •  In  Britain,  a  number  of  prices  are   affected  by  regulators  who  may   impose  a  pricing  formula  on  suppliers   •  Good  examples  are  rail  fares,  the  cost   of  postage  stamps  and  water  bills.   •  In  the  UK  rail  industry,  some  fares  are   unregulated  allowing  train  opera@ng   companies  to  set  their  own  prices.     •  But  around  half  of  the  fares  charged   for  rail  travellers  are  set  by  the  rail   regulator.     The  EU  has  capped   mobile  phone   roaming  charges   Many  rail  fares  in  the   UK  are  heavily   regulated  
  • 22.
    9   8   6   0   1   2   3   4   5   6   7   8   9   10   July  2012   July  2013   July  2014   Price  cap  in  Euro  cents     Mobile  Phone  Price  Caps  Set  by  the  European  Union   70   45   20   0   10   20   30   40   50   60   70   80   July  2012   July  2013   July  2014   Price  cap  in  Euro  cents  per  MB     EU  Price  caps  on  text   messages  (SMS)     EU  Price  caps  on  mobile   data  roaming     ADer  interven@on  by  the  EU  Compe@@on  Commission,  from  15  June  2017,  those  travelling   within  the  EU  will  be  able  to  use  their  mobile  internet  abroad  at  no  extra  charge.  
  • 23.
    Consumer  Price  Index  for  UK  Rail  Fares  2003-­‐2014   92.5   96.3   100   104.2   109.4   114.2   120.6   130.5   139.3   146.3   152   157   0   20   40   60   80   100   120   140   160   180   2003   2004   2005   2006   2007   2008   2009   2010   2011   2012   2013   2014   Consumer  price  index  for  rail  fares   2005=100   Around  45  per  cent  of  UK  rail  fares  are  subject  to  regula@on  (since  2015  this  is   limited  to  the  rate  of  RPI  infla@on.  All  other  fares  are  set  at  a  commercial  rate  by   the  train  opera@ng  companies  such  as  First  Great  Western  and  Virgin  Trains  
  • 24.
    Price  Determina,on   EdExcel  Economics  1.2.6