Downloaded 158 times

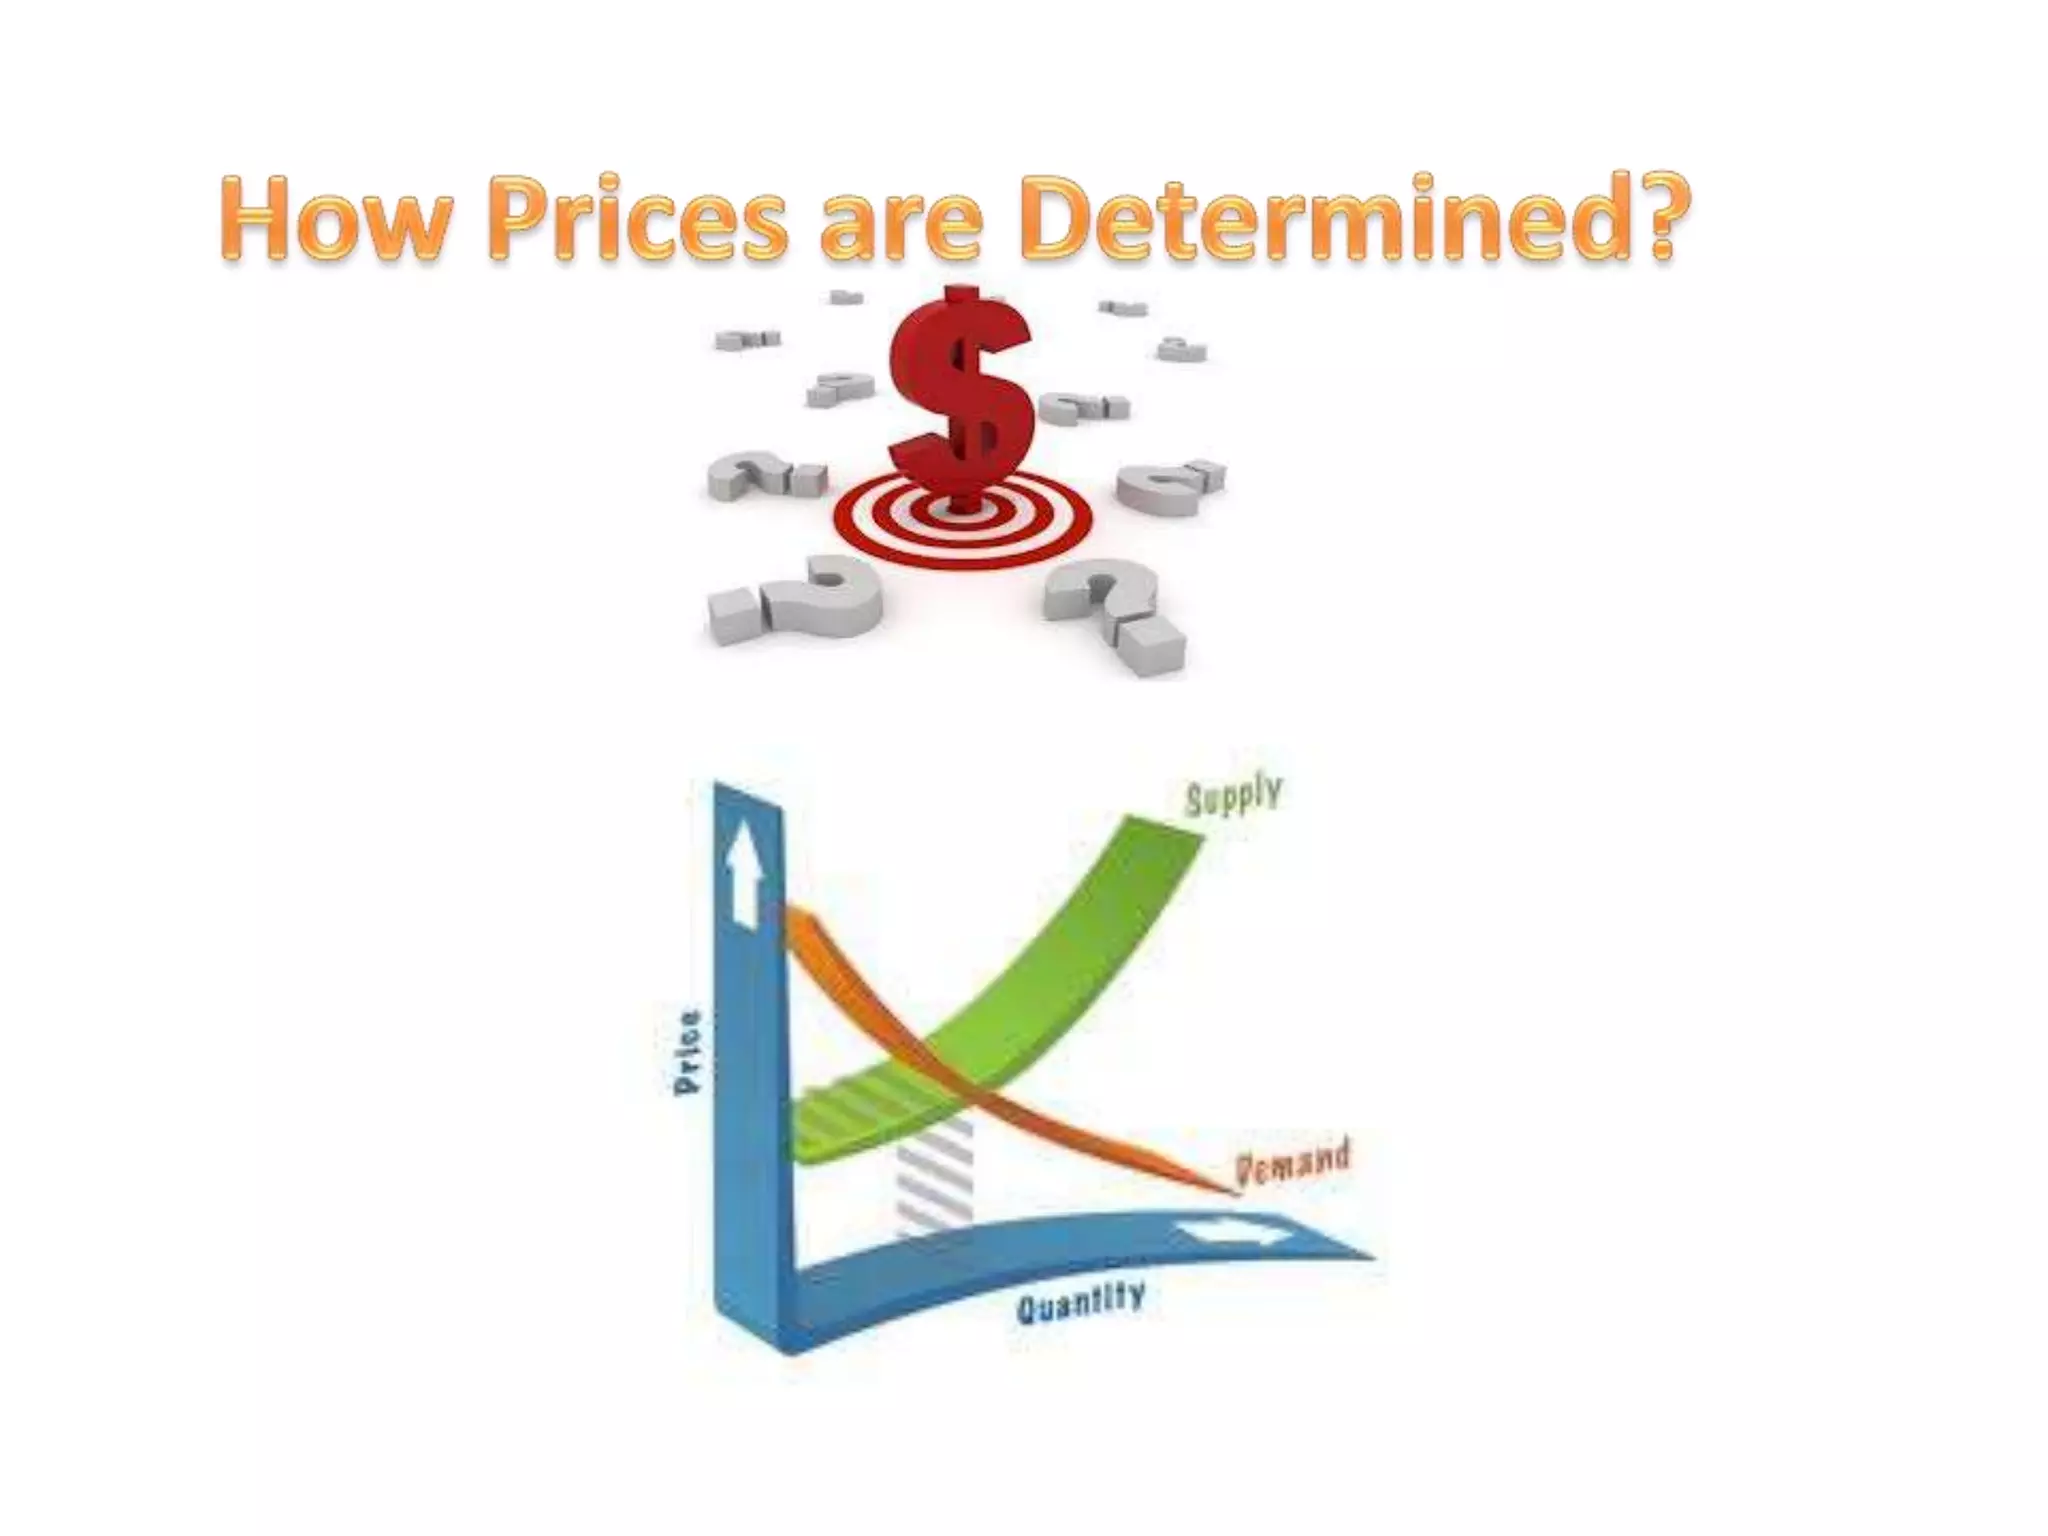

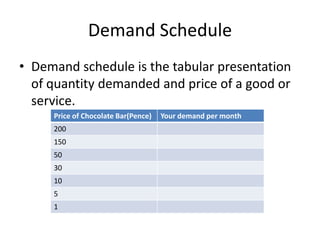
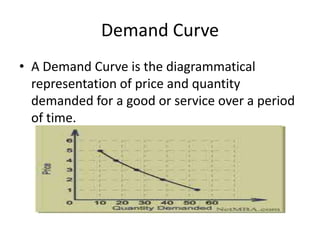
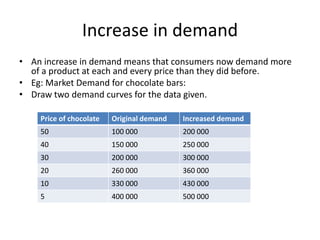
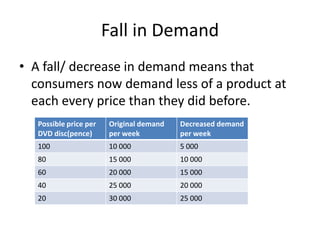


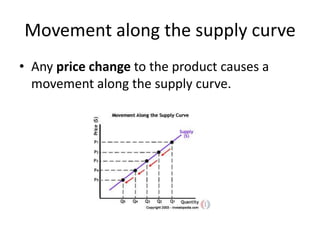
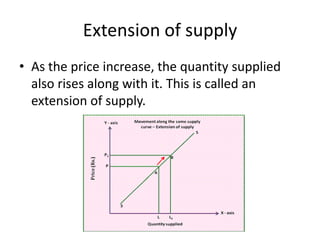
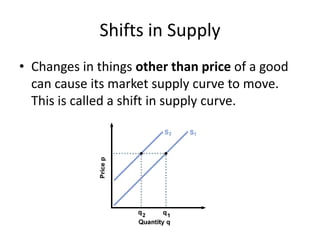


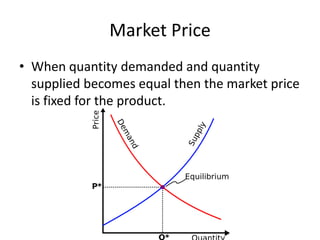
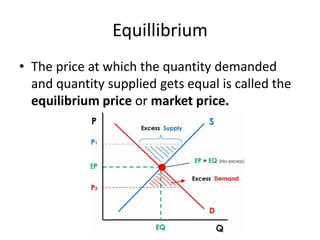
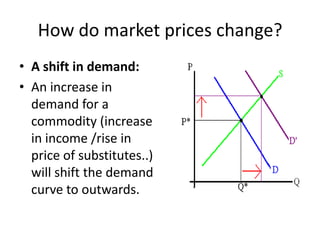
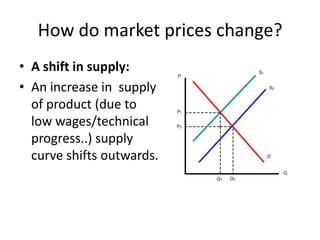
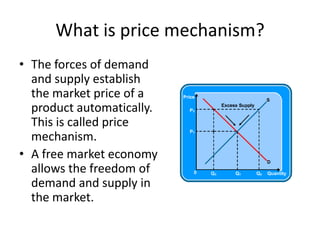

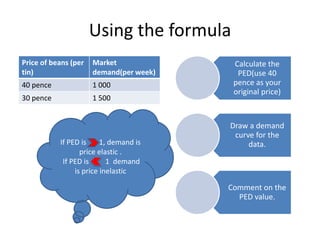


Demand refers to how much of a good or service consumers are willing and able to purchase at different price levels. Quantity demanded is the total amount consumers want to buy at a given price. Market demand is the sum of all individual demands. Demand curves slope downward, showing an inverse relationship between price and quantity demanded. Supply refers to how much producers are willing to sell at different prices. Quantity supplied is the total amount producers want to sell at a given price. Market supply curves slope upward, showing a direct relationship between price and quantity supplied. Equilibrium occurs where quantity demanded equals quantity supplied, establishing the market price.