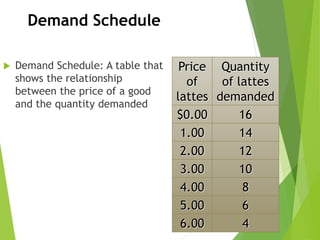
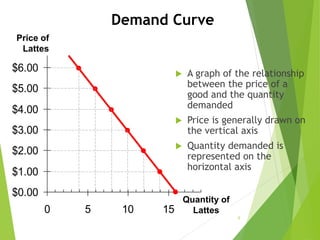
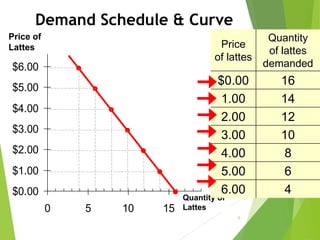
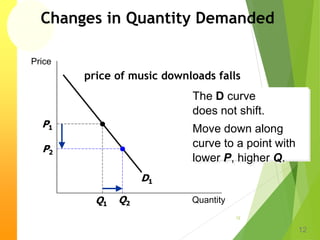
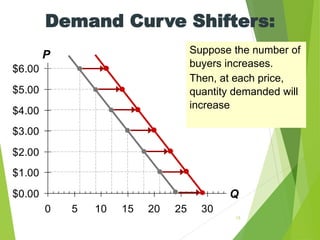
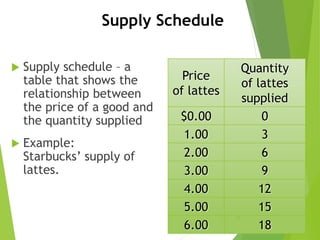
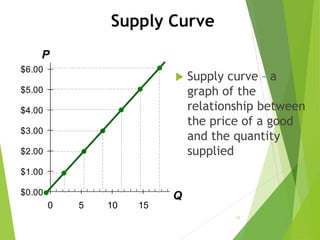
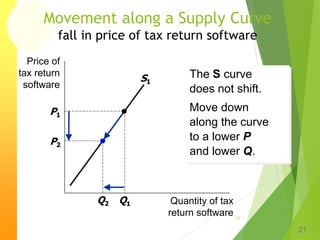
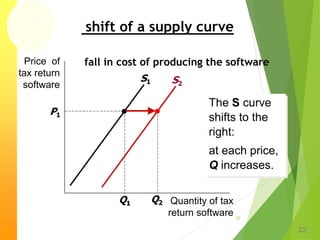
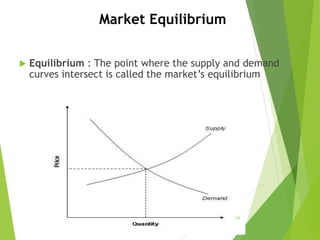
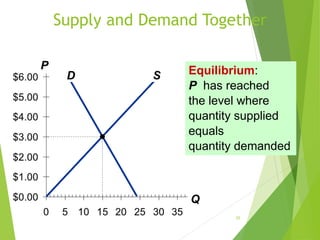
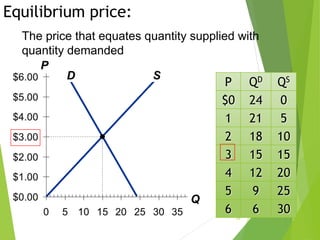
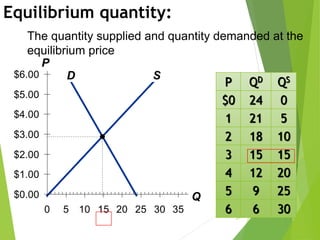
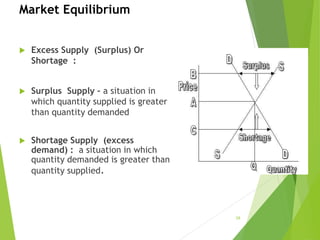
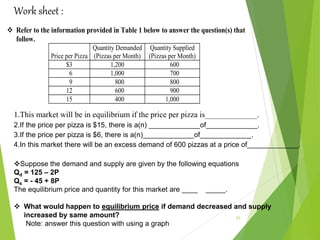
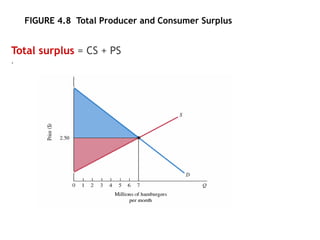
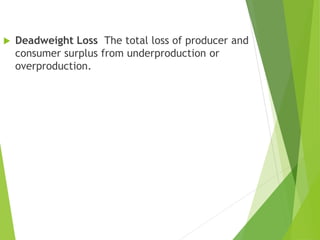
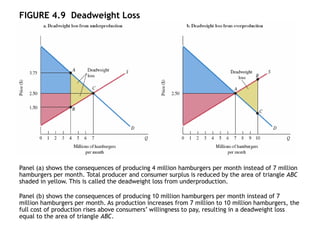
Ch.3
Demand, Supply, and Market
Equilibrium
1
Markets
 Market – a group of buyers and sellers of a particular good or service
2
Demand
 Demand comes from the behavior of buyers.
 Demand : the representation of the various
amounts of product that consumer are
willing and able to purchase at each of a
series of possible price during a specific
period of time.
3
Demand Schedule
 Demand Schedule: A table that
shows the relationship
between the price of a good
and the quantity demanded
Price
of
lattes
Quantity
of lattes
demanded
$0.00 16
1.00 14
2.00 12
3.00 10
4.00 8
5.00 6
6.00 4
4
$0.00
$1.00
$2.00
$3.00
$4.00
$5.00
$6.00
0 5 10 15
Price of
Lattes
Quantity of
Lattes
Demand Curve
 A graph of the relationship
between the price of a
good and the quantity
demanded
 Price is generally drawn on
the vertical axis
 Quantity demanded is
represented on the
horizontal axis
5
$0.00
$1.00
$2.00
$3.00
$4.00
$5.00
$6.00
0 5 10 15
Price of
Lattes
Quantity of
Lattes
6
Demand Schedule & Curve
Price
of lattes
Quantity
of lattes
demanded
$0.00 16
1.00 14
2.00 12
3.00 10
4.00 8
5.00 6
6.00 4
law of Demand
 law of demand The negative relationship between
price and quantity demanded.
 As price rises, quantity demanded decreases; as price
falls, quantity demanded increases during a given
period of time, all other things remaining constant.
 A demand curve has a negative slope (Downward -
sloping )
7
 Determinants Of Demand :
1. Number of buyers
An increase in the number of buyers causes an increase in quantity
demanded at each price, which shifts the demand curve to the right.
2. Expectations -future income or future prices-
Examples:
 If people expect their incomes to rise, their demand for meals at
expensive restaurants may increase now.
3. Consumer Tastes
4. Prices of related goods
5. Income
8
Determinants Of Demand :
 Income:
The relationship between income and quantity demanded
depends on what type of good.
 Demand for a normal good is positively related to
income.
 Demand for an inferior good is negatively related to
income.
9
Determinants Of Demand :
 Prices of related goods :
 Substitutes – two goods for which an increase in the price of one
good leads to an increase in the demand for the other
 Example: hot dogs and hamburgers.
An increase in the price of hot dogs
increases demand for hamburgers,
shifting hamburger demand curve to the right.
 Complements – two goods for which an increase in the price of one good
leads to a decrease in the demand for the other
 Example: computers and software.
If price of computers rises, people buy fewer computers, and therefore less
software.
Software demand curve shifts left.
10
Changes in Quantity Demanded versus
Changes in Demand :
 Changes in the price of a product affect the quantity demanded per
period → movement along the curve
 Changes in any other factor, such as income or tastes, affect demand →
shifting demand curve to the right or the left side
11
Changes in Quantity Demanded
price of music downloads falls
12
12
The D curve
does not shift.
Move down along
curve to a point with
lower P, higher Q.
Price
Quantity
D1
P1
Q1 Q2
P2
$0.00
$1.00
$2.00
$3.00
$4.00
$5.00
$6.00
0 5 10 15 20 25 30
P
Q
Suppose the number of
buyers increases.
Then, at each price,
quantity demanded will
increase
Demand Curve Shifters:
13
Work sheet:
14
Fill in the blank :
1.According to the law of demand ,there is a________________________,
2._____________ is the willingness to buy a product and the ability to pay
for it.
3.PlayStation 3 and XBOX 360 are substitutes. If the price of PlayStation 3
increases what will happen to the quantity demanded for XBOX 360?
________________________,
4.Milk and chocolate chip cookies are complementary goods. If the price of
milk decreases what will happen to the quantity demanded for chocolate
chip cookies? ________________________,
5.Normally a demand curve will have the shape_____________.
6.If the demand for coffee decreases as income decreases, coffee is a(n)
_____________.
7. A change in the price of a good or service leads to a ________ that
leads to a ________.
Supply
 Supply comes from the behavior of sellers.
 Quantity Supplied – the amount of a good that sellers are willing and able
to sell
 Quantity supplied is positively related to price
 law of supply: The positive relationship between price and quantity of a
good supplied
15
Supply Schedule
 Supply schedule – a
table that shows the
relationship between
the price of a good and
the quantity supplied
 Example:
Starbucks’ supply of
lattes.
Price
of lattes
Quantity
of lattes
supplied
$0.00 0
1.00 3
2.00 6
3.00 9
4.00 12
5.00 15
6.00 18
16
Supply Curve
$0.00
$1.00
$2.00
$3.00
$4.00
$5.00
$6.00
0 5 10 15
 Supply curve – a
graph of the
relationship between
the price of a good
and the quantity
supplied
17
P
Q
 Determinants Of Supply :
1.Number of sellers:
An increase in the number of sellers increases the quantity
supplied at each price, shifts the S curve to the right.
2. Technology:
 Technology determines how much inputs are required to
produce a unit of output.
 A cost-saving technological improvement has same effect as
a fall in input prices,
shifts the S curve to the right
.
18
Determinants Of Supply :
3. Input prices/Resource(factor) prices
 Examples of input prices:
wages, prices of raw materials.
 A fall in input prices makes production
more profitable at each output price,
so firms supply a larger quantity at each price,
and the S curve shifts to the right.
4. Taxes/subsidies
 When a tax is added to a good the supply will decrease, when a
subsidy is added to a good the supply will increase
19
Shift Of Supply Versus Movement Along A Supply
Curve :
 Movement along a supply curve The change in quantity supplied brought
about by a change in price.
 Shift of a supply curve The change that takes place in a supply curve
corresponding to a new relationship between quantity supplied of a good and
the price of that good. The shift is brought about by a change in the original
conditions.
20
Movement along a Supply Curve
fall in price of tax return software
21
21
The S curve
does not shift.
Move down
along the curve
to a lower P
and lower Q.
Price of
tax return
software
Quantity of tax
return software
S1
P1
Q1
Q2
P2
shift of a supply curve
fall in cost of producing the software
22
22
The S curve
shifts to the
right:
at each price,
Q increases.
Price of
tax return
software
Quantity of tax
return software
S1
P1
Q1
S2
Q2
Worksheet:
23
 Fill in the blank :
 According to the law of supply, there is a ________________________,
 The price of hard drives used in the manufacturing of laptop computers has
risen. This will lead to ________ laptop computers.
 A change in the price of a good or service leads to a ________ that leads to
a ________.
 True or false :
 A shift of the supply curve is caused by a change in a good's own price.
 An increase in the wage rate of steel workers will reduce the supply of
steel.( )
 movement along the supply curve is caused by a change in a good's own
price( ).
Market Equilibrium
 Equilibrium : The point where the supply and demand
curves intersect is called the market’s equilibrium
24
$0.00
$1.00
$2.00
$3.00
$4.00
$5.00
$6.00
0 5 10 15 20 25 30 35
P
Q
Supply and Demand Together
25
D S Equilibrium:
P has reached
the level where
quantity supplied
equals
quantity demanded
D S
$0.00
$1.00
$2.00
$3.00
$4.00
$5.00
$6.00
0 5 10 15 20 25 30 35
P
Q
Equilibrium price:
26
P QD QS
$0 24 0
1 21 5
2 18 10
3 15 15
4 12 20
5 9 25
6 6 30
The price that equates quantity supplied with
quantity demanded
D S
$0.00
$1.00
$2.00
$3.00
$4.00
$5.00
$6.00
0 5 10 15 20 25 30 35
P
Q
Equilibrium quantity:
27
P QD QS
$0 24 0
1 21 5
2 18 10
3 15 15
4 12 20
5 9 25
6 6 30
The quantity supplied and quantity demanded at the
equilibrium price
Market Equilibrium
 Excess Supply (Surplus) Or
Shortage :
 Surplus Supply – a situation in
which quantity supplied is greater
than quantity demanded
 Shortage Supply (excess
demand) : a situation in which
quantity demanded is greater than
quantity supplied.
28
Changes in Equilibrium
When supply and demand curves shift, the equilibrium price and
quantity change.
1. Change in demand.
2. Change in supply.
3. Change in demand and supply in the same direction
4. Change in demand and supply in opposite direction
29
Work sheet :
30
 Refer to the information provided in Table 1 below to answer the question(s) that
follow.
Price per Pizza
Quantity Demanded
(Pizzas per Month)
Quantity Supplied
(Pizzas per Month)
$3 1,200 600
6 1,000 700
9 800 800
12 600 900
15 400 1,000
1.This market will be in equilibrium if the price per pizza is_____________.
2.If the price per pizza is $15, there is a(n) _____________of_____________.
3.If the price per pizza is $6, there is a(n)_____________of_____________.
4.In this market there will be an excess demand of 600 pizzas at a price of_____________.
Suppose the demand and supply are given by the following equations
Qd = 125 – 2P
Qs = - 45 + 8P
The equilibrium price and quantity for this market are ____ _____.
Work sheet :
31
 Refer to the information provided in Table 1 below to answer the question(s) that
follow.
Price per Pizza
Quantity Demanded
(Pizzas per Month)
Quantity Supplied
(Pizzas per Month)
$3 1,200 600
6 1,000 700
9 800 800
12 600 900
15 400 1,000
1.This market will be in equilibrium if the price per pizza is_____________.
2.If the price per pizza is $15, there is a(n) _____________of_____________.
3.If the price per pizza is $6, there is a(n)_____________of_____________.
4.In this market there will be an excess demand of 600 pizzas at a price of_____________.
Suppose the demand and supply are given by the following equations
Qd = 125 – 2P
Qs = - 45 + 8P
The equilibrium price and quantity for this market are ____ _____.
 What would happen to equilibrium price if demand decreased and supply
increased by same amount?
Note: answer this question with using a graph
CONSUMERS, PRODUCERS, AND THE
EFFICIENCY OF MARKETS
• Supply and demand curves can be used to illustrate
market efficiency, which can be understood through
the concepts of consumer and producer surplus.
Consumer Surplus :
 consumer surplus The difference between the
maximum amount a person is willing to pay for a
good and its current market price.
CONSUMERS, PRODUCERS, AND THE
EFFICIENCY OF MARKETS
 producer surplus The difference between the
current market price and the cost of production for
the firm.
4-34
FIGURE 4.8 Total Producer and Consumer Surplus
Total surplus = CS + PS
.
Competitive Markets Maximize the Sum of
Producer and Consumer Surplus
 Deadweight Loss The total loss of producer and
consumer surplus from underproduction or
overproduction.
4-36
FIGURE 4.9 Deadweight Loss
Panel (a) shows the consequences of producing 4 million hamburgers per month instead of 7 million
hamburgers per month. Total producer and consumer surplus is reduced by the area of triangle ABC
shaded in yellow. This is called the deadweight loss from underproduction.
Panel (b) shows the consequences of producing 10 million hamburgers per month instead of 7
million hamburgers per month. As production increases from 7 million to 10 million hamburgers, the
full cost of production rises above consumers’ willingness to pay, resulting in a deadweight loss
equal to the area of triangle ABC.

micro ch.3(1).pptx

  • 1.
    Ch.3 Demand, Supply, andMarket Equilibrium 1
  • 2.
    Markets  Market –a group of buyers and sellers of a particular good or service 2
  • 3.
    Demand  Demand comesfrom the behavior of buyers.  Demand : the representation of the various amounts of product that consumer are willing and able to purchase at each of a series of possible price during a specific period of time. 3
  • 4.
    Demand Schedule  DemandSchedule: A table that shows the relationship between the price of a good and the quantity demanded Price of lattes Quantity of lattes demanded $0.00 16 1.00 14 2.00 12 3.00 10 4.00 8 5.00 6 6.00 4 4
  • 5.
    $0.00 $1.00 $2.00 $3.00 $4.00 $5.00 $6.00 0 5 1015 Price of Lattes Quantity of Lattes Demand Curve  A graph of the relationship between the price of a good and the quantity demanded  Price is generally drawn on the vertical axis  Quantity demanded is represented on the horizontal axis 5
  • 6.
    $0.00 $1.00 $2.00 $3.00 $4.00 $5.00 $6.00 0 5 1015 Price of Lattes Quantity of Lattes 6 Demand Schedule & Curve Price of lattes Quantity of lattes demanded $0.00 16 1.00 14 2.00 12 3.00 10 4.00 8 5.00 6 6.00 4
  • 7.
    law of Demand law of demand The negative relationship between price and quantity demanded.  As price rises, quantity demanded decreases; as price falls, quantity demanded increases during a given period of time, all other things remaining constant.  A demand curve has a negative slope (Downward - sloping ) 7
  • 8.
     Determinants OfDemand : 1. Number of buyers An increase in the number of buyers causes an increase in quantity demanded at each price, which shifts the demand curve to the right. 2. Expectations -future income or future prices- Examples:  If people expect their incomes to rise, their demand for meals at expensive restaurants may increase now. 3. Consumer Tastes 4. Prices of related goods 5. Income 8
  • 9.
    Determinants Of Demand:  Income: The relationship between income and quantity demanded depends on what type of good.  Demand for a normal good is positively related to income.  Demand for an inferior good is negatively related to income. 9
  • 10.
    Determinants Of Demand:  Prices of related goods :  Substitutes – two goods for which an increase in the price of one good leads to an increase in the demand for the other  Example: hot dogs and hamburgers. An increase in the price of hot dogs increases demand for hamburgers, shifting hamburger demand curve to the right.  Complements – two goods for which an increase in the price of one good leads to a decrease in the demand for the other  Example: computers and software. If price of computers rises, people buy fewer computers, and therefore less software. Software demand curve shifts left. 10
  • 11.
    Changes in QuantityDemanded versus Changes in Demand :  Changes in the price of a product affect the quantity demanded per period → movement along the curve  Changes in any other factor, such as income or tastes, affect demand → shifting demand curve to the right or the left side 11
  • 12.
    Changes in QuantityDemanded price of music downloads falls 12 12 The D curve does not shift. Move down along curve to a point with lower P, higher Q. Price Quantity D1 P1 Q1 Q2 P2
  • 13.
    $0.00 $1.00 $2.00 $3.00 $4.00 $5.00 $6.00 0 5 1015 20 25 30 P Q Suppose the number of buyers increases. Then, at each price, quantity demanded will increase Demand Curve Shifters: 13
  • 14.
    Work sheet: 14 Fill inthe blank : 1.According to the law of demand ,there is a________________________, 2._____________ is the willingness to buy a product and the ability to pay for it. 3.PlayStation 3 and XBOX 360 are substitutes. If the price of PlayStation 3 increases what will happen to the quantity demanded for XBOX 360? ________________________, 4.Milk and chocolate chip cookies are complementary goods. If the price of milk decreases what will happen to the quantity demanded for chocolate chip cookies? ________________________, 5.Normally a demand curve will have the shape_____________. 6.If the demand for coffee decreases as income decreases, coffee is a(n) _____________. 7. A change in the price of a good or service leads to a ________ that leads to a ________.
  • 15.
    Supply  Supply comesfrom the behavior of sellers.  Quantity Supplied – the amount of a good that sellers are willing and able to sell  Quantity supplied is positively related to price  law of supply: The positive relationship between price and quantity of a good supplied 15
  • 16.
    Supply Schedule  Supplyschedule – a table that shows the relationship between the price of a good and the quantity supplied  Example: Starbucks’ supply of lattes. Price of lattes Quantity of lattes supplied $0.00 0 1.00 3 2.00 6 3.00 9 4.00 12 5.00 15 6.00 18 16
  • 17.
    Supply Curve $0.00 $1.00 $2.00 $3.00 $4.00 $5.00 $6.00 0 510 15  Supply curve – a graph of the relationship between the price of a good and the quantity supplied 17 P Q
  • 18.
     Determinants OfSupply : 1.Number of sellers: An increase in the number of sellers increases the quantity supplied at each price, shifts the S curve to the right. 2. Technology:  Technology determines how much inputs are required to produce a unit of output.  A cost-saving technological improvement has same effect as a fall in input prices, shifts the S curve to the right . 18
  • 19.
    Determinants Of Supply: 3. Input prices/Resource(factor) prices  Examples of input prices: wages, prices of raw materials.  A fall in input prices makes production more profitable at each output price, so firms supply a larger quantity at each price, and the S curve shifts to the right. 4. Taxes/subsidies  When a tax is added to a good the supply will decrease, when a subsidy is added to a good the supply will increase 19
  • 20.
    Shift Of SupplyVersus Movement Along A Supply Curve :  Movement along a supply curve The change in quantity supplied brought about by a change in price.  Shift of a supply curve The change that takes place in a supply curve corresponding to a new relationship between quantity supplied of a good and the price of that good. The shift is brought about by a change in the original conditions. 20
  • 21.
    Movement along aSupply Curve fall in price of tax return software 21 21 The S curve does not shift. Move down along the curve to a lower P and lower Q. Price of tax return software Quantity of tax return software S1 P1 Q1 Q2 P2
  • 22.
    shift of asupply curve fall in cost of producing the software 22 22 The S curve shifts to the right: at each price, Q increases. Price of tax return software Quantity of tax return software S1 P1 Q1 S2 Q2
  • 23.
    Worksheet: 23  Fill inthe blank :  According to the law of supply, there is a ________________________,  The price of hard drives used in the manufacturing of laptop computers has risen. This will lead to ________ laptop computers.  A change in the price of a good or service leads to a ________ that leads to a ________.  True or false :  A shift of the supply curve is caused by a change in a good's own price.  An increase in the wage rate of steel workers will reduce the supply of steel.( )  movement along the supply curve is caused by a change in a good's own price( ).
  • 24.
    Market Equilibrium  Equilibrium: The point where the supply and demand curves intersect is called the market’s equilibrium 24
  • 25.
    $0.00 $1.00 $2.00 $3.00 $4.00 $5.00 $6.00 0 5 1015 20 25 30 35 P Q Supply and Demand Together 25 D S Equilibrium: P has reached the level where quantity supplied equals quantity demanded
  • 26.
    D S $0.00 $1.00 $2.00 $3.00 $4.00 $5.00 $6.00 0 510 15 20 25 30 35 P Q Equilibrium price: 26 P QD QS $0 24 0 1 21 5 2 18 10 3 15 15 4 12 20 5 9 25 6 6 30 The price that equates quantity supplied with quantity demanded
  • 27.
    D S $0.00 $1.00 $2.00 $3.00 $4.00 $5.00 $6.00 0 510 15 20 25 30 35 P Q Equilibrium quantity: 27 P QD QS $0 24 0 1 21 5 2 18 10 3 15 15 4 12 20 5 9 25 6 6 30 The quantity supplied and quantity demanded at the equilibrium price
  • 28.
    Market Equilibrium  ExcessSupply (Surplus) Or Shortage :  Surplus Supply – a situation in which quantity supplied is greater than quantity demanded  Shortage Supply (excess demand) : a situation in which quantity demanded is greater than quantity supplied. 28
  • 29.
    Changes in Equilibrium Whensupply and demand curves shift, the equilibrium price and quantity change. 1. Change in demand. 2. Change in supply. 3. Change in demand and supply in the same direction 4. Change in demand and supply in opposite direction 29
  • 30.
    Work sheet : 30 Refer to the information provided in Table 1 below to answer the question(s) that follow. Price per Pizza Quantity Demanded (Pizzas per Month) Quantity Supplied (Pizzas per Month) $3 1,200 600 6 1,000 700 9 800 800 12 600 900 15 400 1,000 1.This market will be in equilibrium if the price per pizza is_____________. 2.If the price per pizza is $15, there is a(n) _____________of_____________. 3.If the price per pizza is $6, there is a(n)_____________of_____________. 4.In this market there will be an excess demand of 600 pizzas at a price of_____________. Suppose the demand and supply are given by the following equations Qd = 125 – 2P Qs = - 45 + 8P The equilibrium price and quantity for this market are ____ _____.
  • 31.
    Work sheet : 31 Refer to the information provided in Table 1 below to answer the question(s) that follow. Price per Pizza Quantity Demanded (Pizzas per Month) Quantity Supplied (Pizzas per Month) $3 1,200 600 6 1,000 700 9 800 800 12 600 900 15 400 1,000 1.This market will be in equilibrium if the price per pizza is_____________. 2.If the price per pizza is $15, there is a(n) _____________of_____________. 3.If the price per pizza is $6, there is a(n)_____________of_____________. 4.In this market there will be an excess demand of 600 pizzas at a price of_____________. Suppose the demand and supply are given by the following equations Qd = 125 – 2P Qs = - 45 + 8P The equilibrium price and quantity for this market are ____ _____.  What would happen to equilibrium price if demand decreased and supply increased by same amount? Note: answer this question with using a graph
  • 32.
    CONSUMERS, PRODUCERS, ANDTHE EFFICIENCY OF MARKETS • Supply and demand curves can be used to illustrate market efficiency, which can be understood through the concepts of consumer and producer surplus. Consumer Surplus :  consumer surplus The difference between the maximum amount a person is willing to pay for a good and its current market price.
  • 33.
    CONSUMERS, PRODUCERS, ANDTHE EFFICIENCY OF MARKETS  producer surplus The difference between the current market price and the cost of production for the firm.
  • 34.
    4-34 FIGURE 4.8 TotalProducer and Consumer Surplus Total surplus = CS + PS .
  • 35.
    Competitive Markets Maximizethe Sum of Producer and Consumer Surplus  Deadweight Loss The total loss of producer and consumer surplus from underproduction or overproduction.
  • 36.
    4-36 FIGURE 4.9 DeadweightLoss Panel (a) shows the consequences of producing 4 million hamburgers per month instead of 7 million hamburgers per month. Total producer and consumer surplus is reduced by the area of triangle ABC shaded in yellow. This is called the deadweight loss from underproduction. Panel (b) shows the consequences of producing 10 million hamburgers per month instead of 7 million hamburgers per month. As production increases from 7 million to 10 million hamburgers, the full cost of production rises above consumers’ willingness to pay, resulting in a deadweight loss equal to the area of triangle ABC.